Hot Features
Key Highlights
ETH/USD price is stuck at the $1,300 high
Ethereum may face a price rebound or breakdown

Ethereum (ETH) Current Statistics
The current price: $1,265.74
Market Capitalization: $154,867,060,004
Trading Volume: $5,179,460,790
Key Resistance Zones: $2,500, $3,300, $4,000
Key Support Zones: $2,000, $1,500, $1,000
Ethereum (ETH) Price Analysis December 9, 2022
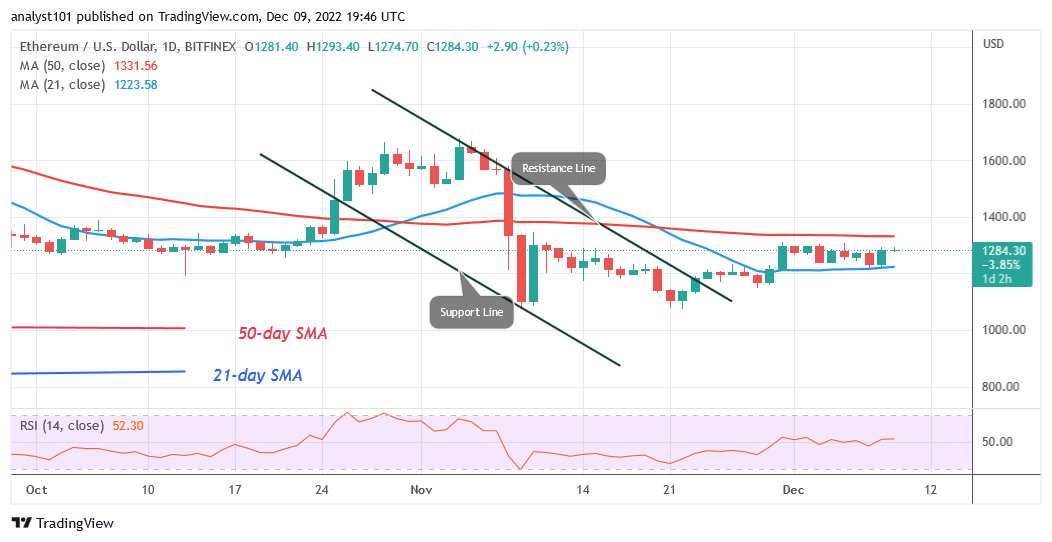
Ethereum (ETH) price has been ranging in a wide range since November 30. The moving average lines are contained by the price bars for the coin. As long as the moving average lines remain in place, the largest altcoin won’t trend. Yesterday, ETH tried to rally to the $1,300 resistance level but was unsuccessful. Currently, the price of Ether is wobbling beneath the resistance zone. Buyers will need to overcome the resistance over $1,300 to re-establish positive momentum on the upswing. The price of Ether will surge over the 50-day SMA if buyers are successful. Ether will further revisit the previous high of $1,600. Conversely, the biggest altcoin will start to decrease once sellers breach the 21-day line SMA. For instance, ETH/USD will decline to the previous low above $1,100.
Ethereum Technical Indicators Reading
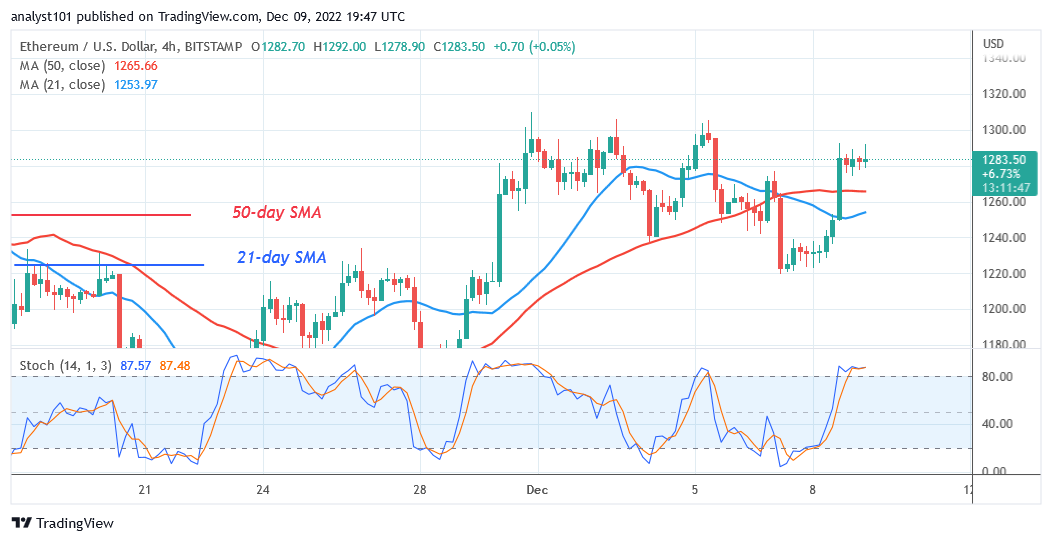
For period 14, Ethereum increased to level 52 on the Relative Strength Index. Ether is in a bullish trend zone and may continue to move higher. The price bars on the daily chart fall between the moving average lines, indicating that Ether’s price will probably fluctuate in a narrow range. It has reached the overbought region of the market. It exceeds the day’s Stochastic level of 80.
Conclusion
Between the moving average lines, Ethereum is wobbling sideways. The direction of the market has not changed. The rising advances have been halted at the $1,300 resistance zone. Ether’s price will soon rebound or crash as it trades in a narrow range of prices.
Learn from market wizards: Books to take your trading to the next level