Hot Features
ADA Price Analysis – January 25

When the sellers increase their momentum to push down price below $0.98, the support level of $0.83 and $0.73 may be tested. In case the Support level of $0.98 holds, the buyers may push up the price towards $1.11, $1.30 and $1.46 levels.
ADA/USD Market
Key Levels:
Resistance levels: $1.11, $1.30, $1.46
Support levels: $0.98, $0.83, $0.73
ADA/USD Long-term Trend: Bearish
Cardano is bearish on daily chart. Buyers and sellers are struggling over the crypto. The sellers are trying to overpower the buyers. Former support level of $1.30 and $1.11 has been penetrated downside by the sellers and the price exposes to $0.98 support level. There is tendency for the price to decline further if the sellers maintain their pressure.
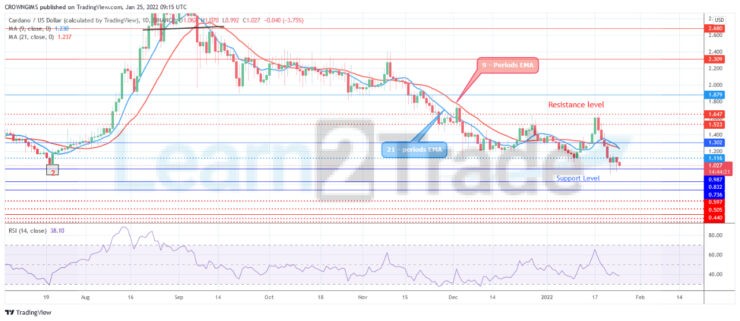
Cardano has crossed the two EMAs downside, currently trading below the 9 periods EMA and 21 periods EMA at distance which indicate a bearish movement. When the sellers increase their momentum to push down price below $0.98, the support level of $0.83 and $0.73 may be tested. In case the Support level of $0.98 holds, the buyers may push up the price towards $1.11, $1.30 and $1.46 levels. The relative Strength Index period 14 is at 40 levels with the signal line pointing downside which indicates sell signal.
ADA/USD Medium-term Trend: Bearish
Cardano is on the bearish movement on 4-hour chart. The bullish movement could not continue when the buyers pushed up Cardano to test the resistance level at $1.64. The bears reacted against the price increase with the formation of bearish engulfing candle. The price started decreasing and the support level of $1.30 is broken downside. Further price decrease envisaged as the price is below the two dynamic resistance levels.
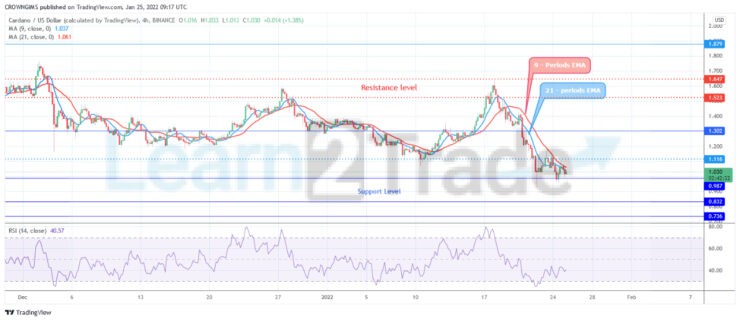
The price is trading below the 9 periods EMA and 21 periods EMA. The relative strength index period 14 is at 40 levels and the signal line pointing down to indicate sell signal.
Source: https://learn2.trade