PNC Financial on Pace for Largest Percent Decrease Since June 2016 After 3Q Earnings Report -- Data Talk
October 12 2018 - 1:35PM
Dow Jones News
PNC Financial Services Group, Inc. (PNC) is currently at
$123.46, down $8.15 or 6.19%
-- Would be lowest close since Sept. 8, 2017, when it closed at
$121.51
-- On pace for largest percent decrease since June 24, 2016,
when it fell 6.45%
-- Earlier Friday, the bank reported disappointing loan growth
and underwhelmed Wall Street with its loan guidance for the fourth
quarter. PNC Chief Executive Bill Demchak said on the company's
earnings call Friday that loans to corporate customers "came in
below our own expectations."
-- Currently down five of the past six days
-- Currently down four consecutive days; down 11.66% over this
period
-- Worst four-day stretch since the four days ending August 25,
2015, when it fell 12.37%
-- Down 11% this week; on pace for its worst week since May
2009
-- Down 14.44% year-to-date; on pace for worst year since 2008,
when it fell 25.36%
-- Traded as low as $123.40; lowest intraday level since Sept.
11, 2017, when it hit $122.66
-- Down 6.24% at today's intraday low; largest intraday percent
decrease since June 24, 2016, when it fell as much as 6.62%
-- Worst performer in the S&P 500 today
All data as of 12:54:41 PM
Source: Dow Jones Market Data, FactSet
(END) Dow Jones Newswires
October 12, 2018 13:20 ET (17:20 GMT)
Copyright (c) 2018 Dow Jones & Company, Inc.
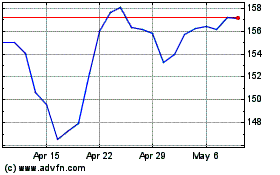
PNC Financial Services (NYSE:PNC)
Historical Stock Chart
From Mar 2024 to Apr 2024

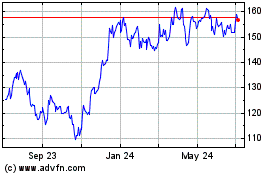
PNC Financial Services (NYSE:PNC)
Historical Stock Chart
From Apr 2023 to Apr 2024
