- Group sales revenue up 13.8%; order
intake up 14.5%; earnings margin1) 28.1%
- Dynamic development across all
product categories and geographies
- Management specifies 2018 sales
guidance at upper range of bandwidth
Regulatory News:
With double-digit increases in sales revenue and earnings,
Sartorius Stedim Biotech (SSB) (Paris:DIM), a leading partner
of the biopharma industry, continues on the growth track.
“Momentum developed very strongly in the course of this year,
even if we adjust for relative moderate comparables particularly in
the third quarter of 2017. We grew dynamically across all product
categories and geographies and increased our profitability
significantly. Conditions in the biopharma market continue to be
healthy and demand for our products remains high. Backed by a
strong order intake, we see us well on track to deliver on our
ambitious 2018 targets,” said Dr. Joachim Kreuzburg, Chairman of
the Board and CEO.
Business development of the Group
In the first nine months of 2018, Sartorius Stedim Biotech
increased its sales revenue in constant currencies by 13.8% to
896.1 million euros (reported +11.4%). Growth was driven both by
strong demand for equipment and single-use products. Almost all of
the increase in sales revenue was achieved organically, whereas the
acquisition of the software company Umetrics contributed around 0.5
percentage points of non-organic growth. Order intake also rose
significantly by 14.5% in constant currencies to 955.6 million
euros (reported +12.0%).
In view of the regions, the Americas led growth, reporting a
gain of 20.3% to 315.8 million euros relative to a moderate
previous-year base (reported +15.9%). Compared to high growth in
the year-earlier period, sales revenue in Asia|Pacific also showed
positive development, increasing by 11.9% to 203.8 million euros.
The EMEA2) region recorded a solid gain of 9.8% to 376.5 million
euros (reported +9.4%). (All regional growth in constant
currencies.)
In the first nine months of 2018, Sartorius Stedim Biotech
increased its underlying EBITDA1) overproportionately relative to
sales, by 17.2% to 251.4 million euros. Driven by economies of
scale and positive product mix effects, the Group's respective
margin improved significantly year over year from 26.7% to 28.1%.
Relevant net profit3) for the Group grew even more strongly by
22.9% from 130.8 million euros to 160.7 million euros thus earnings
per share were 1.74 euros (9M 2017: 1.42 euros).
The Group's key financial indicators remained at very robust
levels. At the end of the reporting period, the ratio of net debt
to underlying EBITDA stood at 0.4, and company's equity ratio was
61.6% (Dec. 31, 2017: 0.4 and 62.6%, resp.). The CAPEX ratio in the
first nine months of 2018 was 13.9%, in-line with expectations (9M
2017: 11.3%). Investment activities focused on the expansion of the
plant for manufacturing single-use bags and filters in Puerto Rico,
IT and digitalization projects, and on the consolidation and
expansion of sites and production capacity levels in G�ttingen,
Germany.
2018 guidance confirmed and specified
In view of positive business development in the first nine
months of 2018, management specified its full-year guidance as
follows: Sales revenue growth is now projected to be in the upper
range of the previously targeted bandwidth of 11% to 14% while the
underlying EBITDA margin continues to be expected at around 28.0%,
up from the prior-year figure of 27.3.
All forecasts are based on constant currencies. As a result of
changes in the currency exchange rates, reported figures in actual
currencies may differ from constant currency guidance.
1) Sartorius uses underlying EBITDA (earnings before interest,
taxes, depreciation and amortization and adjusted for extraordinary
items) as the key profitability indicator
2) EMEA = Europe | Middle East | Africa
3) After non-controlling interest, adjusted for extraordinary
items and non-cash amortization, as well as based on the normalized
financial result and corresponding tax effects
This press release contains statements about the future
development of the Sartorius Stedim Biotech Group. We cannot
guarantee that the content of these statements will actually apply
because these statements are based upon assumptions and estimates
that harbor certain risks and uncertainties.
Conference call
Joachim Kreuzburg, Chairman of the Board and CEO of the
Sartorius Stedim Biotech Group, will discuss the company’s results
with analysts and investors on Tuesday, October 23, 2018, at 3:00
p.m. Central European Time (CEST), in a teleconference. You may
register for the teleconference at:
http://services.choruscall.de/DiamondPassRegistration/register?confirmationNumber=6785779&linkSecurityString=2c6a4a5c7
Alternatively, you can dial into the teleconference, without
registering, at:
+49 (0) 69 566 03 6000
To view the presentation, log onto:
https://www.sartorius.com/en/company/investor-relations/sartorius-stedim-biotech-sa-investor-relations
Current image files
https://www.sartorius.com/en/company/newsroom/downloads-publications
Upcoming financial dates
January 29, 2019 Publication of preliminary figures for 2018
A profile of Sartorius Stedim Biotech
Sartorius Stedim Biotech is a leading international partner of
the biopharmaceutical industry. As a total solutions provider, the
company helps its customers to manufacture biotech medications
safely, rapidly and economically. Headquartered in Aubagne, France,
Sartorius Stedim Biotech is quoted on the Eurolist of Euronext
Paris. With its own manufacturing and R&D sites in Europe,
North America and Asia and an international network of sales
companies, Sartorius Stedim Biotech has a global reach. The Group
has been annually growing by double digits on average and has been
regularly expanding its portfolio by acquisitions of complementary
technologies. In 2017, Sartorius Stedim Biotech employed approx.
5,100 people and earned sales revenue of €1,081.0 million.
Key Performance Indicators for the Nine-Month Period of
2018
€ in millions unless
otherwise specified
9 months2018
9 months1)2017
∆ in %Reported
∆ in %cc2)
Sales revenue 896.1 804.7 +11.4 +13.8
EMEA3) 376.5 344.2 +9.4 +9.8 Americas3)
315.8 272.6 +15.9 +20.3 Asia |
Pacific3) 203.8 187.9 +8.4 +11.9 Order
intake 955.6 853.0 +12.0 +14.5 EBITDA4)
251.4 214.5 +17.2 EBITDA
margin4) in % 28.1 26.7 +1.4pp
Net profit5) 160.7 130.8 +22.9
Earnings per share5) in € 1.74 1.42 +22.9
1) Data slightly adjusted due to finalization of purchase price
allocation of the acquisition of Umetrics (now Sartorius Stedim
Data Analytics AB)
2) In constant currencies
3) According to customers’ location
4) Underlying EBITDA = earnings before interest, taxes,
depreciation and amortization, and adjusted for extraordinary
items
5) Underlying net profit = net profit after non-controlling
interest; adjusted for extraordinary items and non-cash
amortization, as well as based on a normalized financial result and
tax rate
View source
version on businesswire.com: https://www.businesswire.com/news/home/20181022005744/en/
Sartorius Stedim BiotechPetra KirchhoffHead of Corporate
Communications+49
(0)551.308.1686petra.kirchhoff@sartorius.comwww.sartorius-stedim.com
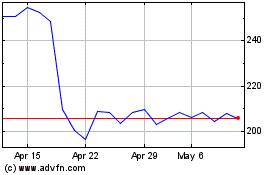
Sartorius Stedim Biotech (EU:DIM)
Historical Stock Chart
From Mar 2024 to Apr 2024

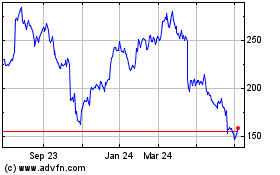
Sartorius Stedim Biotech (EU:DIM)
Historical Stock Chart
From Apr 2023 to Apr 2024
