LinkedIn Misses EPS, Revs Strong - Analyst Blog
August 03 2012 - 7:56AM
Zacks
LinkedIn Corporation (LNKD) reported adjusted
net earnings of 4 cents per share in the second quarter of 2012, an
inch short of the Zacks Consensus Estimate of 5 cents. The miss
could be attributed to higher expenses and tax.
Revenues
Revenues in the quarter were $228.2 million, an increase of
88.5% compared with $121.0 million in the second quarter of 2011.
The company witnessed terrific revenue growth across all three
product segments.
Looking at the segments, Hiring Solutions’
revenue soared almost 107.0% over the prior-year quarter. This
segment represented around 53% of the company’s total revenue
compared with 48% reported last year.
The company continues to add new product to its Hiring Solutions
product portfoliofrom recruiter to pipeline to jobs to recruitment
media, This growth deserves special mention, especially as the
segment was able to counter the European economic headwinds.
Marketing Solutions products increased 64.0%
year over year to $63.1 million, representing 28.0% of the total
revenue.
Premium Subscriptions products totaled $43.5
million, an increase of 82.0% year over year. Premium Subscriptions
accounted for 19.0% of the total revenue in the reported
quarter.
Geographically, U.S. revenues totaled $162.3 million, and
represented 71.1% of the revenues in the reported quarter. Revenue
from the international market amounted to $162.3 million, and
represented 71.1% of the quarter’s total revenue.
Operating Results
Operating cost and expense grew by 90% this year, attributable
to the increase in sales & marketing, product development and
general & marketing expense. The company reported operating
income of $13.5 million, up from the year-ago level of $9.9
million. Operating income increased as revenue grew at a higher
rate than cost and expenses.
Net profit on a GAAP basis in the second quarter was $2.8
million or 3 cents versus $4.5 million or 4 cents in the second
quarter of 2011. Excluding special items like amortization of
intangibles, non-GAAP earnings per share came at 4 cents, flat with
the second quarter of 2011.
Balance Sheet
LinkedIn Corporation ended the quarter with cash and cash
equivalents of $617.1 million versus $342.3 million in the prior
quarter. Accounts receivable in the quarter was $136.5 compared
with $116.3 million in the previous quarter. Total deferred revenue
in the quarter was $191.9 million, up from $174.8 million in the
previous quarter.
Guidance
For the third quarter of 2012, the company expects revenue in
the range of $235 million to $240 million. The company expects
adjusted EBITDA between $42.0 million and $45.0 million.
For 2012, the company expects revenue in the range of $915.0
million to $925.0 million, up from the prior range of $880.0
million to $900.0 million. The company upped the adjusted EBITDA
range to $185.0 million to $190.0 million from the prior range of
$170.0 million to $175.0 million.
Conclusion
LinkedIn commands a dominant position in the emerging online
professional networking segment. The company has attained worldwide
popularity and has grown steadily over the last few quarters. The
second quarter numbers were encouraging and revenues were
considerably higher across segments.
The Hiring solution segment was particularly strong Cost-control
measures were implemented effectively to improve its bottom line.
Moreover, LinkedIn’s current competitive pressure is not severe in
the professional networking space.
However, IT majors like Facebook (FB),
Google (GOOG) and Microsoft
(MSFT) are expected to enter the market soon. Hence, the
competitive scenario could change rapidly over the next few
years.
The company carries a Zacks #3 Rank, which translates into a
short-term Hold rating.
FACEBOOK INC-A (FB): Free Stock Analysis Report
GOOGLE INC-CL A (GOOG): Free Stock Analysis Report
LINKEDIN CORP-A (LNKD): Free Stock Analysis Report
MICROSOFT CORP (MSFT): Free Stock Analysis Report
To read this article on Zacks.com click here.
Zacks Investment Research
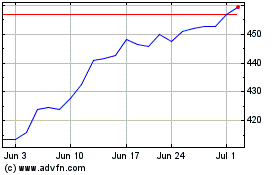
Microsoft (NASDAQ:MSFT)
Historical Stock Chart
From Mar 2024 to Apr 2024

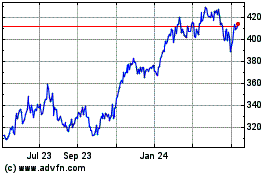
Microsoft (NASDAQ:MSFT)
Historical Stock Chart
From Apr 2023 to Apr 2024
