Goldman Sachs Down Over 6%, on Pace for Largest Percent Decrease Since June 2016 -- Data Talk
November 12 2018 - 12:35PM
Dow Jones News
Goldman Sachs Group, Inc. (GS) is currently at $208.41, down
$14.24 or 6.4%
-- Would be lowest close since Nov. 16, 2016 when it closed at
$206.26
-- On pace for largest percent decrease since June 24, 2016 when
it fell 7.07%
-- As reported on Friday, former Goldman Sachs Chief Executive
Lloyd Blankfein attended two meetings with a Malaysian financier at
the center of one of the world's largest financial scandals,
including one after the Wall Street bank's compliance department
had raised multiple concerns about the financier's background and
said the bank shouldn't do business with him
-- Currently down two consecutive days; down 10.03% over this
period
-- Down 18.19% year-to-date; on pace for worst year since 2011
when it fell 46.22%
-- Down 23.77% from its all-time closing high of $273.38 on
March 12, 2018
-- Down 13.26% from 52 weeks ago (Nov. 13, 2017), when it closed
at $240.27
-- Traded as low as $208.08; lowest intraday level since Nov.
17, 2016 when it hit $205.67
-- Down 6.54% at today's intraday low; largest intraday percent
decrease since Feb. 5, 2018 when it fell as much as 7.13%
-- Worst performer in the DJIA today
-- 10th worst performer in the S&P 500 today
-- Subtracted 96.55 points from the DJIA so far today
All data as of 11:43:33 AM
Source: Dow Jones Market Data, FactSet
(END) Dow Jones Newswires
November 12, 2018 12:20 ET (17:20 GMT)
Copyright (c) 2018 Dow Jones & Company, Inc.
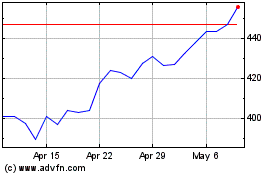
Goldman Sachs (NYSE:GS)
Historical Stock Chart
From Mar 2024 to Apr 2024

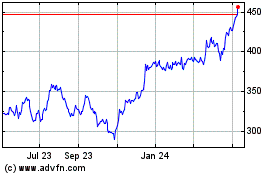
Goldman Sachs (NYSE:GS)
Historical Stock Chart
From Apr 2023 to Apr 2024
