Full UK Basic detailed breakdown |
| ? |
? |
UK basic is ADVFNs premier entry level package for Level 2 services. UK Basic gives you "unlimited" level 1, and "limited" level 2 access,
So you will never get timed out of level 1 "unlimited" screens, but you will be timed out of the "limited" UK Level 2 screens (note: as UK Basic is premium limited service access periods to the level 2 service are proportionally longer than our real-time free service).
only ?39.99 plus VAT per month
|
| ? |
? |
 |
About Level 2 |
| ? |
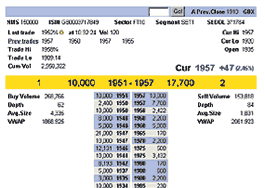
Level 1 data only shows you information on trades that have already gone through, and the current bid and offers (or data derived from that information like mid price High Low etc). Level 2 on the other hand show you the many orders sitting behind the bid and offer spread waiting their turn to move up the current price as orders are filled.
Looking at the unfilled orders behind the current spread gives you a more informed view on the direction of market sentiment. Helping you to judge the best entry and exit points for your trades. Day traders especially rely on Level 2 data, though anyone dealing in reasonable volumes can benefit from level 2 data screens. |
| ? |
? |
|
UK Level 2 |
| ? |
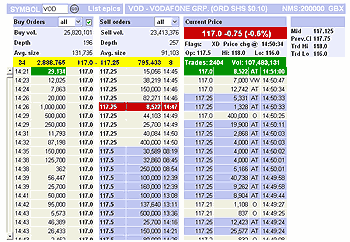
ADVFN has designed all of it's level 2 screens to be as user friendly and as informative as possible.
|
ADVFN screens give you an edge on traditional level 2 screen layouts.
|
| ? |
| This is a traditional Level 2 screen... |
| ? |
 |
| ? |
| and this is the improved ADVFN Level 2 screen |
| ? |
 |
| ? |
The ADVFN screen has much more information including order time stamps and trades information, the logical placement of order book summary data above the buy and sell columns means there is no waste of valuable screen space. |
|
|
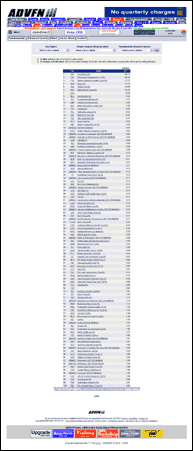
Order Book ?Toplist? |
| ? |
Stock screening by Level 2
order book activity |
| ? |
 |
? |
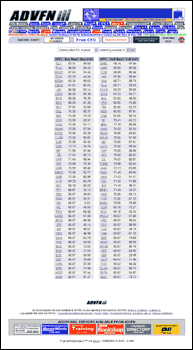
The ?Order Book? Toplist provides a league table, which shows you the stocks that have the highest percentage of orders in their order book near to the current price. |
| ? |
? |
? |
| ? |
Because the list shows the highest percentage not the highest number of bids and offers, it doesn?t give the usual and predictable catalogue of high volume FTSE250 stocks. The Order Book Toplist has two columns one for bids and one for offers. You can sort these lists by the highest percentage of volume or percentage of orders near to the current price. Level 2 data shows you the market makers order book, literally the bids and offers sitting behind the current price. Level 2 data and screening tools like ?Order Book? Toplist can help you identify areas of the market where demand is high and market direction and sentiment are being affected. This information can help you to make more informed and profitable trading
decisions. |
| ? |
? |
|
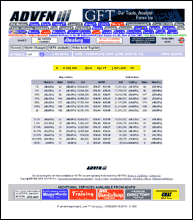
Quote Change Report |
| ? |
Quote Change Report
unique ADVFN feature |
| ? |
| ? |
 |
? |
Quote change report allows you to see when a market maker?s quote has changed the current price and how other market makers have responded to that change.
|
| ? |
? |
? |
? |
| ? |
The report lists quote changes in chronological order - the most recent change being at the top of the page.
If the current bid/offer changes it is listed in the Quote Changes Report as a yellow strip. Subsequent quote changes are listed behind the yellow strip. This helps you to distinguish if a quote change has actually moved the price or whether it is following other market makers? quotes. The report can also help you identify which market makers wish to be active at the current price. A price change can cause a flurry of quote amendments taking quotes away from or closer to the current price. This helps you to identify market sentiment and direction.
|
| ? |
? |
? |
? |
|
SETS analysis page |
| ? |
SETS Level 2 screens show the most liquid of London Stock Exchange stocks |
| ? |
? |
| ? |
 |
? |
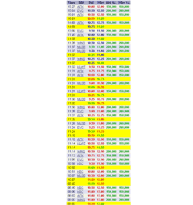
With fast moving SETS stocks the "SETS analysis page" is a fast way to identify buying and selling opportunities |
| ? |
? |
| ? |
Level 2 shows the bids (to buy) and offers (to sell) behind the current price. The level of demand to buy or sell shares has a direct affect on the price. By identifying which direction that the market is trying to push the share price, you can find the best exit and entry points for your share trading. Many day traders use this sort of information to develop intraday
trading strategies.With SETS Level 2, one of the most common issues is the speed at which transactions happen. Normally the most relevant information is within 1%-5% of the current share price, but trades in these highly liquid stocks can move very quickly. SETS analysis allows you to have a closer look at the share price horizon within Level 2 data. Like many of the best trading tools it's very simple to use and understand. The SETS analysis tool consists of two tables each containing two columns, the left column represents Bids and the right represents Offers.
The first table is a break down of the percentage pressure on the current bid and offer as orders move away from current best prices; 1%, 5%, 10%, 15%, 50%, 100% etc.
The second table breaks down the buying and selling pressure in the order book into separate bands as orders move away from the current price. Between 0%-1%, 1%-5%, 5%-10%, 10%-15%, 15%-50%, 50%-100%, 100%-.
There are several ways of utilising this information. For example, by using SETS analysis in conjunction with the Level 2 screen itself and charting market trends it is possible to quickly identify clumps of shares around the buy and sell price that may be filled en mass, so you can position your order in or behind these clumps to get the best price for your trades.
Whether you are day trading or just trying to get the best price you can on the day, tools like Level 2 and SETS analysis can be invaluable, helping you to maximise profit and minimise loss. |
| ? |
? |
|
Unlimited real-time level 1 UK prices data Uninterrupted level 1 access: No timeouts!
|
| ? |
What having an unlimited an "unlimited" UK service actually means.
With ADVFN's FREE UK real-time "limited" service you have to share your real-time prices with all of the free members that are logged on, this means you're limited to the length of time you can see real-time UK prices. The more people that are on the site the shorter the period you have to watch real-time prices. The "unlimited " UK silver level 1 service gives you a permanent connection for all London Stock Exchange prices no automated log outs
|
| |
| Additional functionality |
| ? |
|
Complete UK Company Financial (Fundamental) data
Extra 36 fields of financial data |
| ? |
? |
? |
? |
| ? |
 |
? |
Extra 4
Investment Ratios
Extra 16
Operating Ratios
Extra 16
Financial Ratios
?
? |
| ? |
? |
? |
? |
|
FilterX full service |
| ? |
? |
? |
? |
| ? |
 |
? |
Full access to all results and figures in Filter X's result screens
Free and bronze users can use Filter X but many |
| ? |
? |
? |
? |
|
PLUS all FREE Membership tools

Click here for full details |
| ? |
? |
|
PLUS All (Bronze) Premium Tools

Click here for full details
|
?

|