Money-Making Machines - Zacks Industry Rank Analysis
April 03 2012 - 8:00PM
Zacks
Industry Rank Analysis 4-4-12
The U.S. economy is continuing to recover, and one of the sectors
which has been the real engine of that growth is business
investment in equipment and software. While such investment
in the fourth quarter accounted for less than 7.6% of the overall
economy, it accounted for 18.3% of the overall growth in the fourth
quarter, and that was down from an astounding 62.2% in the third
quarter and 33.8% of the growth in the second quarter.
Today I am focusing on the equipment side of that, and more
specifically investments in machinery. The strong macro
performance of the sector is showing in upward estimate revisions
and positive earnings surprises, and those in turn at reflected in
the Zacks Rank.
Zacks Industry Classifications
The Zacks industry classifications are very fine, with 258
different industries tracked. It is not particularly
noteworthy if a single small industry shows up doing well; a single
firm with good news can propel a one or two firm industry to the
top (or bottom) of the charts.
It is interesting when you see a cluster of similar industries at
the top of the list. The same holds true for the bottom of
the list. The definition of size that matters here is not the
total sales or market capitalization but the number of companies in
the “industry.”
4 Machinery Groups Working Well
There are four Machinery “industries” that are showing up very well
on the Zacks Rank. The strongest three of which are about
median sized “industries,” with seven or eight firms in them.
The “weakest” of the four is by far the largest, General Industrial
Machinery, with 37 firms in it. It still shows up pretty
well, coming in 44th place, a drop of five slots from last
week. Its average Zacks Rank is 2.57, up slightly from 2.54
last week.
The strongest of the Groups is Machine Tools, with eight firms in
it. It is currently the fifth strongest “industry” with an
average Zacks Rank of 1.88, down from 2.00 last week. In
Between we have the Construction and Mining Machinery “industry” in
19th place (up one from last week, and an average Zacks Rank of
2.38, unchanged from last week), and The Farm Machinery “industry,”
a seven member group in 23rd place, slipping one spot from last
week on an unchanged average of 2.43.
If the Zacks Ranks were distributed randomly, one would expect that
only 5% of the members of the firms would earn the coveted Zacks #1
Rank (Strong Buy). Instead, of the total of 13 firms in these
four groups, 21.7%, have earned that distinction. If it were
random, only 15% would hold Zacks #2 Ranks (Buy) but actually 10
(16.7%) hold it.
Go Big or Go Small
There is a huge range of market capitalizations from which to
choose from on these lists, from very large down to micro
cap. While the growth rate from this year to next is not
shown directly, you can get a sense of it from looking at the
change in the P/E ratio from this year to next. Most of these
firms are looking at very respectable growth rates, at least in the
short term.
Of course, Machinery is a quintessentially cyclical part of the
market, so it is NOT a good idea to extrapolate those growth rates
too far into the future. It does, however, indicate that we
are in the middle of a cyclical upswing. Valuations on these stocks
-- particularly if you are willing to look out to FY2 (mostly 2013)
earnings -- are quite reasonable. While most of the smaller
cap names do not pay dividends, some of the large and mid-cap cap
names do provide a nice payout.
Number 1 Ranked Firms
| Company |
Ticker |
Market Cap ($ mil) |
P/E Using Curr FY Est |
P/E Using Next FY Est |
"%Ch Curr Fiscal Yr Est - 4 wks" |
"%Ch Next Fiscal Yr Est - 4 wks" |
"Current Price" |
Div Yield |
| Caterpillar Inc |
CAT |
$58,661 |
12.86 |
9.76 |
1.69% |
3.36% |
$90.99 |
2.02% |
| Lincoln Electrc |
LECO |
$2,639 |
12.95 |
10.94 |
12.37% |
9.97% |
$31.28 |
1.98% |
| Robbins & Myers |
RBN |
$1,987 |
18.6 |
14.36 |
0.00% |
0.00% |
$43.48 |
0.41% |
| Middleby Corp |
MIDD |
$1,434 |
16.58 |
13.95 |
0.00% |
0.00% |
$76.50 |
0.00% |
| Actuant Corp |
ATU |
$1,377 |
12.24 |
10.26 |
0.00% |
0.00% |
$20.06 |
0.20% |
| Barnes Grp |
B |
$1,191 |
15.37 |
12.61 |
5.29% |
3.58% |
$21.87 |
1.46% |
| Lindsay Corp |
LNN |
$692 |
18.55 |
17.45 |
0.00% |
0.00% |
$55.08 |
0.62% |
| Sun Hydraulics |
SNHY |
$647 |
17.2 |
14.7 |
0.08% |
0.06% |
$25.25 |
1.43% |
| H&E Equip Svcs |
HEES |
$355 |
N/A |
12.32 |
-226.32% |
0.00% |
$10.14 |
0.00% |
| Dxp Enterprises |
DXPE |
$322 |
11.66 |
9.81 |
4.45% |
4.10% |
$22.81 |
0.00% |
| Hurco Cos Inc |
HURC |
$168 |
18.11 |
12.98 |
0.00% |
0.00% |
$26.08 |
0.00% |
| Flow Intl Corp |
FLOW |
$146 |
19.87 |
11.41 |
0.00% |
0.00% |
$3.08 |
0.00% |
| Manitex Int Inc |
MNTX |
$48 |
16.96 |
8.48 |
0.00% |
0.00% |
$4.24 |
0.00% |
Number 2 Ranked Firms
| Company |
Ticker |
Market Cap ($ mil) |
P/E Using Curr FY Est |
P/E Using Next FY Est |
"%Ch Curr Fiscal Yr Est - 4 wks" |
"%Ch Next Fiscal Yr Est - 4 wks" |
"Current Price" |
Div Yield |
| Deere & Co |
DE |
$30,496 |
11.34 |
9.68 |
0.33% |
0.01% |
$72.66 |
2.26% |
| Sandvik Ab |
SDVKY |
$16,062 |
11.88 |
9.47 |
-8.80% |
-8.33% |
$13.54 |
2.86% |
| Eaton Corp |
ETN |
$14,450 |
10.51 |
8.88 |
2.60% |
2.62% |
$42.35 |
3.21% |
| Kubota Corp Adr |
KUB |
$10,827 |
15.37 |
14.14 |
0.00% |
0.00% |
$42.57 |
1.74% |
| Metso Corp -Adr |
MXCYY |
$5,765 |
13.64 |
10.66 |
-5.20% |
-4.74% |
$38.53 |
4.86% |
| Idex Corp |
IEX |
$3,128 |
15.33 |
13.17 |
1.69% |
2.14% |
$37.74 |
1.80% |
| Nordson Corp |
NDSN |
$2,944 |
12.65 |
11.61 |
0.13% |
0.13% |
$43.13 |
0.97% |
| Terex Corp |
TEX |
$2,016 |
35.81 |
8.55 |
-29.53% |
-8.27% |
$18.39 |
0.00% |
| Astec Inds Inc |
ASTE |
$730 |
16.19 |
12.77 |
13.95% |
8.92% |
$32.22 |
0.00% |
| Graham Corp |
GHM |
$178 |
17.07 |
13.16 |
4.64% |
1.99% |
$17.98 |
0.44% |
CATERPILLAR INC (CAT): Free Stock Analysis Report
DEERE & CO (DE): Free Stock Analysis Report
EATON CORP (ETN): Free Stock Analysis Report
KUBOTA CORP ADR (KUB): Free Stock Analysis Report
To read this article on Zacks.com click here.
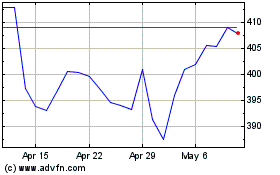
Deere (NYSE:DE)
Historical Stock Chart
From Mar 2024 to Apr 2024

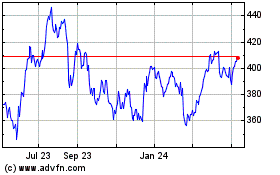
Deere (NYSE:DE)
Historical Stock Chart
From Apr 2023 to Apr 2024
