Earnings Push Shares Down in Early European Trading
October 28 2016 - 5:00AM
Dow Jones News
Shares in Europe fell Friday, while U.S. futures edged lower, as
investors digested the latest batch of corporate earnings results
and awaited a key reading on the health of the U.S. economy.
The Stoxx Europe 600 slipped 0.9% in early trade after Asian
shares broadly fell. Futures markets pointed to a 0.3% opening loss
for the S&P 500 after Wall Street ended lower Thursday amid a
sharp selloff in government bonds.
Bond markets broadly steadied Friday with the yield on the
10-year U.S. Treasury edging up to 1.862% recently, from 1.843% at
Thursday's close, according to Tradeweb. Yields rise as prices
fall.
Attention will turn later to the U.S. gross domestic product
report. Economists polled by The Wall Street Journal estimate that
third-quarter growth accelerated to 2.5% after three consecutive
quarters below 2%.
Earnings season, meanwhile, remains in full swing on both sides
of the Atlantic.
In Europe, food and beverage shares led the declines after
Anheuser-Busch InBev NV, the world's largest brewer, cut its
revenue forecast, sending its shares down around 5%.
Investors also continued to digest the latest batch of bank
earnings, with Swiss lender UBS Group AG reporting a fall in net
profit in the third quarter and French bank BNP Paribas SA
reporting a better-than-expected third-quarter net profit. The
Stoxx Europe 600 Banks subindex was down 0.4%.
In the U.S., oil giants Exxon Mobil Corp. and Chevron Corp. are
among the firms due to release results later Friday. Shares in
Amazon.com Inc. fell in after-hours trading Thursday after the
online retail giant posted its lowest quarterly profit in a
year.
Japan was the one notable bright spot in Asian markets, with the
Nikkei Stock Average rising 0.6% as a weaker yen and recent gains
in global bond yields lifted financial and export firms.
In currency markets, the dollar was roughly flat. The WSJ Dollar
Index, which measures the U.S. currency against a basket of others,
was holding at around its highest level since early March.
Write to Christopher Whittall at
christopher.whittall@wsj.com
(END) Dow Jones Newswires
October 28, 2016 04:45 ET (08:45 GMT)
Copyright (c) 2016 Dow Jones & Company, Inc.
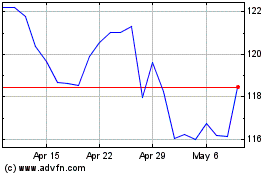
Exxon Mobil (NYSE:XOM)
Historical Stock Chart
From Mar 2024 to Apr 2024

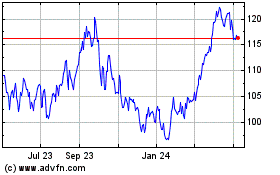
Exxon Mobil (NYSE:XOM)
Historical Stock Chart
From Apr 2023 to Apr 2024
