By Ellie Ismailidou and Victor Reklaitis, MarketWatch
But weak data on retail sales, wholesale prices weigh on the
benchmarks
U.S. stocks pared early losses on Friday led by gains in energy
stocks as oil prices rose, but all three main benchmarks were still
below the record levels they set a day earlier. Investors grappled
with weaker-than-expected retail sales data and an unexpected drop
in wholesale prices.
The main indexes were on track to finish the week with small
gains, while the Nasdaq is looking at its seventh straight up
week.
The S&P 500 index was down 2 points at 2,184, weighed by a
0.6% drop in materials shares, followed by a 0.3% loss in the
health-care sector. Three of the index's 10 sectors were in
positive territory, with energy leading the gains, up 0.7%.
The Dow Jones Industrial Average slipped 33 points, or 0.2%, to
18,580, pulled down by a 1.1% drop in Microsoft Corp.(MSFT) but
buoyed by a 1.1% gain in Exxon Mobil Corp.(XOM)
Meanwhile the Nasdaq Composite Index was off 4 point, or less
than 0.1%, at 5,225.
U.S. retail sales stalled in July after three straight monthly
gains, according to government data released Friday.
(http://www.marketwatch.com/story/retail-sales-stall-in-july-2016-08-12)Retail
sales, which have increased 2.3% over the past 12 months, are an
important part of consumer spending, which is the backbone of the
U.S. economy.
Meanwhile, U.S. wholesale prices fell 0.4% in July, the biggest
drop since September 2015, according to a government report
released Friday
(http://www.marketwatch.com/story/us-wholesale-prices-fall-sharply-in-july-2016-08-12).
(http://www.marketwatch.com/story/us-wholesale-prices-fall-sharply-in-july-2016-08-12)
June business inventories
(http://www.marketwatch.com/story/us-june-business-inventories-rise-02-2016-08-12-10103229)
came in as expected, rising 0.2%, and the Producer Price Index was
down 0.4% after jumping 0.5% in June, while over the past year
overall producer prices are down 0.2% in unadjusted terms.
On the bright side, consumer sentiment ticked up
(http://www.marketwatch.com/story/consumer-sentiment-ticks-up-in-august-despite-higher-expenses-lower-wage-gains-2016-08-12)
in early August as better views of the economy offset declines in
views about personal finances.
While stocks turned negative after the release, gold gained, the
dollar slumped and Treasury yields plunged to their second-lowest
level in history. The weak data are likely to firm the view for
some market participants that the economy isn't strong enough to
tolerate a rate increase in September, or later in 2016.
"Based on the PPI and retail-sales figures, all indications now
look like a [Federal Reserve] rate increase in 2016 is clearly off
the table," said Tom di Galoma managing director at Seaport Global
Holdings, in an email shortly after the release.
Sector performance also reflected the market's expectation of
interest rates being "lower for longer," said Diane Jaffee, senior
portfolio manager at TCW. Investors betting the Fed will remain on
hold, pile into bond-like equities, most notably utility stocks,
Jaffee said.
But at the same time, the strong gains in energy shares tells a
different story, one of a potentially stronger risk appetite and
further gains for the broader market, she said.
Among individual retailers, J.C. Penney Co. Inc.'s (JCP) shares
gained 3.5% after the retailer reported narrower-than-expected
second-quarter losses, though sales were just below estimates
(http://www.marketwatch.com/story/jc-penney-shares-fall-despite-smaller-second-quarter-losses-2016-08-12).
Meanwhile, Nordstrom Inc.(JWN) shares jumped 8.3% after posting
better-than-expected sales and raised profit projections for the
year
(http://www.marketwatch.com/story/nordstrom-profit-tops-view-as-revenue-declines-2016-08-11).
Friday's moves came after on Thursday retailers like Macy's
Inc.(M) and Kohl's Corp.(KSS) all posted better-than-expected
quarterly earnings,
(http://www.marketwatch.com/story/nordstroms-stock-soars-amid-hopes-for-upbeat-results-for-a-change-2016-08-11)
(http://www.marketwatch.com/story/nordstroms-stock-soars-amid-hopes-for-upbeat-results-for-a-change-2016-08-11)helping
the broader market jump to all-time highs. Macy's was down 0.5% on
Friday, after closing 17% higher on Thursday, while Kohl's on
Friday added 1.8% to Thursday's 16% gain.
See:3 reasons this U.S. stock-market rally won't stop
(http://www.marketwatch.com/story/this-time-its-different-3-reasons-the-us-stock-rally-wont-stop-2016-08-12)
Other markets: Oil futures moved decidedly higher following
choppy action earlier, as Saudi Arabia sparked fresh hopes for a
collective production freeze
(http://www.marketwatch.com/story/oil-prices-extend-gains-after-saudi-hints-over-freeze-pact-2016-08-12).
Crude is on track for a weekly gain of over 6%.
Asian markets closed higher, with some credit going to the
upbeat U.S. action on Thursday. But European stocks were roughly
flat
(http://www.marketwatch.com/story/european-stocks-battle-for-the-black-and-another-win-2016-08-12),
though still on track for sizeable weekly gains.
Economic news: Oil prices and energy stocks could move at 1 p.m.
Eastern, when an update on North America's oil-rig count is
expected.
Other individual movers: Beyond the retailers, Nvidia Corp.
shares (NVDA) rose 4.2% after the maker of graphics chips late
Thursday posted better-than-expected earnings
(http://www.marketwatch.com/story/nvidia-rises-to-record-highs-before-and-after-earnings-report-2016-08-11).
Silicon Graphics International Corp.(SGI) jumped 29% following
news late Thursday that Hewlett Packard Enterprise Co.(HPE) plans
to pay $275 million
(http://www.marketwatch.com/story/hewlett-packard-enterprise-buying-silicon-graphics-for-275-million-2016-08-11)
for the maker of server, storage and software products.
(END) Dow Jones Newswires
August 12, 2016 11:48 ET (15:48 GMT)
Copyright (c) 2016 Dow Jones & Company, Inc.
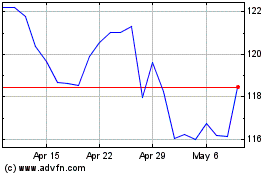
Exxon Mobil (NYSE:XOM)
Historical Stock Chart
From Mar 2024 to Apr 2024

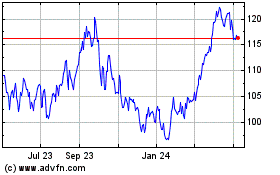
Exxon Mobil (NYSE:XOM)
Historical Stock Chart
From Apr 2023 to Apr 2024
