By Riva Gold and Dan Strumpf
Losses in global stocks accelerated Monday, while investors
plowed into government bonds and oil prices resumed their
slide.
The Dow Jones Industrial Average fell 317 points, or 2%, to
15885 while the S&P 500 dropped 2% to 1842.
Energy and technology stocks fell sharply, with the
technology-laden Nasdaq Composite off 2.5% to 4256.
Shares of natural-gas producer Chesapeake Energy tumbled 36%,
while gas pipeline company Williams Cos. fell 32%. The companies
posted the steepest losses in the S&P 500.
As investors sought safety, they rushed into bonds, boosting
prices and pressuring yields. U.S. 10-year Treasury yields fell to
1.757% as prices rose, while 10-year German government bond yields
fell to 0.245% and Southern European bonds sold off sharply.
U.S. stocks have fallen sharply this year on the back of
tumbling oil prices and worries over decelerating global economic
growth. Investors have bid up government bonds as a haven, pushing
yields around the world sharply lower.
"The big picture thing is there's a lot more pain to go around,"
said Bill Costello, an energy analyst at investment manager
Westwood Holdings Group Inc., referring to the sharp declines in
energy producer shares. "The longer oil prices stay down, the
harder the slog these companies will go through."
In Europe, the Stoxx Europe 600 fell 2.9%, reversing an early
bounce. After five consecutive sessions of losses, the pan-European
index now sits at lows not seen since 2014.
Losses in the oil market accelerated, with U.S.-traded crude
futures down 3.2% to $29.88 a barrel.
Junk bond prices fell. A proxy for junk, the $13.7 billion
iShares iBoxx USD High Yield Corporate Bond exchange-traded fund,
lost 1.2%.
Other forces were weighing down stocks worldwide, traders said.
Data over the weekend on China's foreign-exchange reserves raised
concerns about the country's ability to continue its intervention
in the currency markets.
The data showed that China's currency reserves fell to their
lowest level in more than three years, though many analysts had
expected an even larger drop.
Investors also continued to digest recent U.S. economic data.
Following Friday's U.S. jobs report, "there's a lot of uncertainty
weighing on markets," said Philippe Gijsels, chief strategist at
BNP Paribas Fortis. "People are starting to worry that the lower
oil price and situation in China are starting to impact the U.S.
and European economies," he added.
"It's not necessarily right, but people see lower oil [prices]
as an indication the world economy is weak," Mr. Gijsels added.
While falling oil prices benefit consumers, a rise or
stabilization in oil prices "would alleviate strains from the
global financial system," said Mark Heppenstall, chief investment
officer at Penn Mutual Asset Management, which manages $20 billion
in assets.
"A lot of emerging market economies have revenues dependent on
oil and commodities and debt denominated in U.S. dollars--that mix
has proven pretty toxic," he added.
Monday's moves followed a rocky session on Wall Street Friday,
when a dive in technology shares and the mixed jobs report sent
U.S.-listed stocks lower across the board.
Job creation slowed in January after three consecutive months of
gains, data showed, but a slight fall in unemployment and a modest
uptick in wages left the prospect of further U.S. interest rate
increases this year on the table.
In Asian trade, Japan's Nikkei Stock Average gained 1.1% as the
yen fell against the dollar, while Australia's S&P ASX 200
ended flat.
Other markets in Asia were closed for the Lunar New Year
Holiday.
In currencies, the dollar fell 0.9% against the yen, while the
euro lost 0.2% against the dollar.
In other commodities, gold rose 2.6% to $1186.10 per ounce.
Three-month copper futures on the London Metal Exchange were
down 0.5% at $4592.50 a ton.
--Corrie Driebusch contributed to this article.
Write to Riva Gold at riva.gold@wsj.com and Dan Strumpf at
daniel.strumpf@wsj.com
(END) Dow Jones Newswires
February 08, 2016 11:00 ET (16:00 GMT)
Copyright (c) 2016 Dow Jones & Company, Inc.
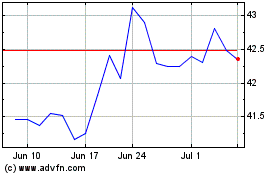
Williams Companies (NYSE:WMB)
Historical Stock Chart
From Mar 2024 to Apr 2024

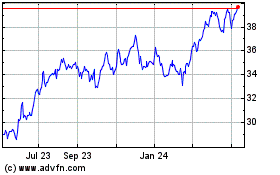
Williams Companies (NYSE:WMB)
Historical Stock Chart
From Apr 2023 to Apr 2024
