Fed Approves Wells Fargo's Capital Plan
June 29 2016 - 4:59PM
Dow Jones News
By Emily Glazer
The Federal Reserve approved Wells Fargo & Co.'s capital
plan in the regulator's annual stress test released Wednesday.
Wells Fargo's plan was approved after the Fed found that the
largest U.S. bank by market value could keep lending in a severe
economic downturn. The approval clears the way for the San
Francisco-based firm to reward investors by returning capital --
either through dividend payouts or buying back stock, or both.
The bank, along with several others, is expected to unveil plans
on its quarterly dividend and share repurchase activity later in
the day.
At the low point of a hypothetical recession, Wells Fargo's
common equity Tier 1 ratio--which measures high-quality capital as
a share of risk-weighted assets--would be 6.1%, above the 4.5%
level the Fed views as a minimum. The new ratio, unlike the one
reported last week by the Fed in a related test, takes into account
the bank's proposed capital plan.
Wells Fargo's Tier 1 leverage ratio would have reached as low as
5.8% in a hypothetical recession, above the 4% Fed minimum.
The latest stress-test result incorporates quantitative factors
assessed in data released by the Fed last week. These included a
simulation of how the bank's capital buffers would hold up under a
worldwide recession. The Fed's "severely adverse" scenario of
financial stress this year included a 10% U.S. unemployment rate,
significant losses in corporate and commercial real-estate lending
portfolios, and negative rates on short-term U.S. Treasury
securities.
This second-part of the test also included a qualitative
assessment by the Fed of a bank's capital-planning process and
internal controls. The Fed has the ability to object to a bank's
capital plan on either quantitative or qualitative grounds.
The Fed's Wednesday results are arguably the more important part
of the stress-test process since it dictates how much capital will
be returned to shareholders. Increased dividends and buybacks can
help to bolster a bank's share price.
Wells Fargo also passed last year but certain capital and
leverage results were down more than 0.5 percentage points from its
year-earlier results.
Write to Emily Glazer at emily.glazer@wsj.com
(END) Dow Jones Newswires
June 29, 2016 16:44 ET (20:44 GMT)
Copyright (c) 2016 Dow Jones & Company, Inc.
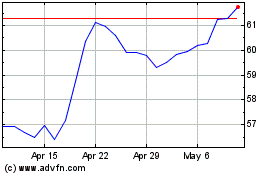
Wells Fargo (NYSE:WFC)
Historical Stock Chart
From Mar 2024 to Apr 2024

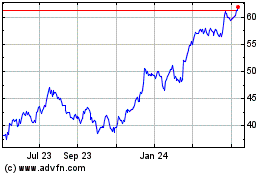
Wells Fargo (NYSE:WFC)
Historical Stock Chart
From Apr 2023 to Apr 2024
