Report of Foreign Issuer (6-k)
December 01 2015 - 8:47AM
Edgar (US Regulatory)
Table of Contents
United States
Securities and Exchange Commission
Washington, D.C. 20549
FORM 6-K
Report of Foreign Private Issuer
Pursuant to Rule 13a-16 or 15d-16
of the
Securities Exchange Act of 1934
For the month of
December 2015
Vale S.A.
Avenida Graça Aranha, No. 26
20030-900 Rio de Janeiro, RJ, Brazil
(Address of principal executive office)
(Indicate by check mark whether the registrant files or will file annual reports under cover of Form 20-F or Form 40-F.)
(Check One) Form 20-F x Form 40-F o
(Indicate by check mark if the registrant is submitting the Form 6-K in paper as permitted by Regulation S-T Rule 101(b)(1))
(Check One) Yes o No x
(Indicate by check mark if the registrant is submitting the Form 6-K in paper as permitted by Regulation S-T Rule 101(b)(7))
(Check One) Yes o No x
(Indicate by check mark whether the registrant by furnishing the information contained in this Form is also thereby furnishing information to the Commission pursuant to Rule 12g3-2(b) under the Securities Exchange Act of 1934.)
(Check One) Yes o No x
(If “Yes” is marked, indicate below the file number assigned to the registrant in connection with Rule 12g3-2(b). 82- .)
[LOGO]

“This presentation may include statements that present Vale's expectations about future events or results. All statements, when based upon expectations about the future and not on historical facts, involve various risks and uncertainties. Vale cannot guarantee that such statements will prove correct. These risks and uncertainties include factors related to the following: (a) the countries where we operate, especially Brazil and Canada; (b) the global economy; (c) the capital markets; (d) the mining and metals prices and their dependence on global industrial production, which is cyclical by nature; and (e) global competition in the markets in which Vale operates. To obtain further information on factors that may lead to results different from those forecast by Vale, please consult the reports Vale files with the U.S. Securities and Exchange Commission (SEC), the Brazilian Comissão de Valores Mobiliários (CVM), the French Autorité des Marchés Financiers (AMF) and The Stock Exchange of Hong Kong Limited, and in particular the factors discussed under “Forward-Looking Statements” and “Risk Factors” in Vale’s annual report on Form 20-F.” “Cautionary Note to U.S. Investors - The SEC permits mining companies, in their filings with the SEC, to disclose only those mineral deposits that a company can economically and legally extract or produce. We present certain information in this presentation, including ‘measured resources,’ ‘indicated resources,’ ‘inferred resources,’ ‘geologic resources’, which would not be permitted in an SEC filing. These materials are not proven or probable reserves, as defined by the SEC, and we cannot assure you that these materials will be converted into proven or probable reserves, as defined by the SEC. U.S. Investors should consider closely the disclosure in our Annual Report on Form 20-K, which may be obtained from us, from our website or at http://http://us.sec.gov/edgar.shtml.”

Murilo Ferreira President & CEO
We overcame the challenges in 2015 but are fully aware of the work ahead in 2016 2015 was a year of significant progress as a result of our ongoing restructuring initiatives 2015 2016 and we are prepared to meet the challenges created by continued demand uncertainty and volatility in commodity prices in 2016 2017 to 2018 and beyond and we expect positive FCF by 2017 with a gradual reduction in leverage and an increase in dividend distribution

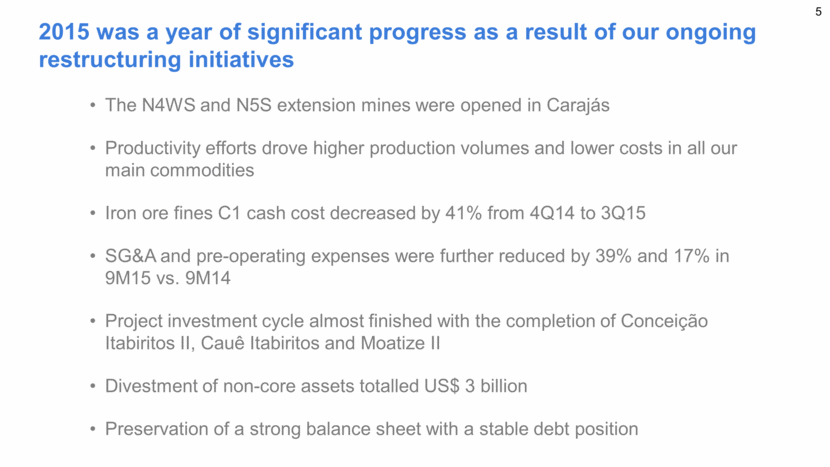
2015 was a year of significant progress as a result of our ongoing restructuring initiatives The N4WS and N5S extension mines were opened in Carajás Productivity efforts drove higher production volumes and lower costs in all our main commodities Iron ore fines C1 cash cost decreased by 41% from 4Q14 to 3Q15 SG&A and pre-operating expenses were further reduced by 39% and 17% in 9M15 vs. 9M14 Project investment cycle almost finished with the completion of Conceição Itabiritos II, Cauê Itabiritos and Moatize II Divestment of non-core assets totalled US$ 3 billion Preservation of a strong balance sheet with a stable debt position
We are prepared to meet the 2016 challenges created by demand uncertainty and volatility in commodity prices 2016 will be another challenging year with still unfavorable demand & supply outlook and volatile commodity prices We will maintain our operational discipline and preserve our balance sheet as we: Further simplify our corporate structure, increase productivity, cut costs and optimize capex Reduce iron ore cash cost and improve product quality Reduce capex to around US$ 6 bi Complete divestments and partnerships

and we expect positive FCF by 2017 with a gradual reduction in leverage and an increase in dividend distribution Capex will reduce and reach around US$ 4-5 billion with the completion of our investment cycle by 2018 Volumes will increase by about 30% in iron ore, 10% in nickel and copper and also up to 18% in fertilizer products The iron ore business cash costs and expenses landed in China, adjusted for the sale of pellets, will come in below US$ 25/dmt in 2018 The base metals business will continue to increase its cash flow The coal business will benefit from Moatize’s ramp-up, which will reduce costs, leading to a substantial improvement in coal margins The fertilizers business will make a bigger contribution through the execution of its commercial strategy, productivity / cost-cutting efforts and the delivery of replacement projects Free cash flow and dividends will reach higher levels and debt will reduce gradually

Peter Poppinga Executive director, Ferrous Minerals
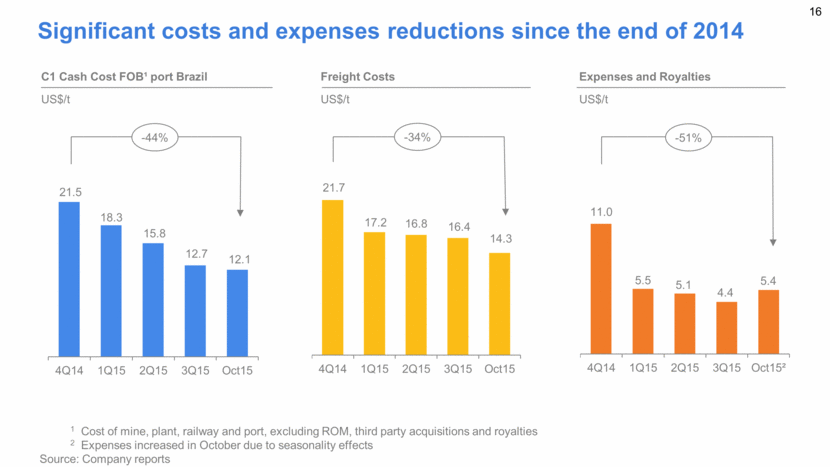
Supply Chain Optimization Berthing of fully loaded Valemaxes in China Ramp up of the Malaysia Distribution Center, producing the “Brazilian Blend” Fines with excellent acceptance by the market Main accomplishments Cost and Expenses Reduction Significant cost and expenses reductions since the end of 20141 C1 cash costs reduced by 44% Freight costs reduced by 34% Expenses2 reduced by 51% 1 Cost and expenses reductions until October 2015 Delivery of another two projects on time and under budget Conceição Itabiritos II is expected to be completed 7% below budget Cauê Itabiritos will start up in 4Q15 as planned Consistent progress at S11D (on schedule and below budget) Project Implementation Progress 2 Including royalties

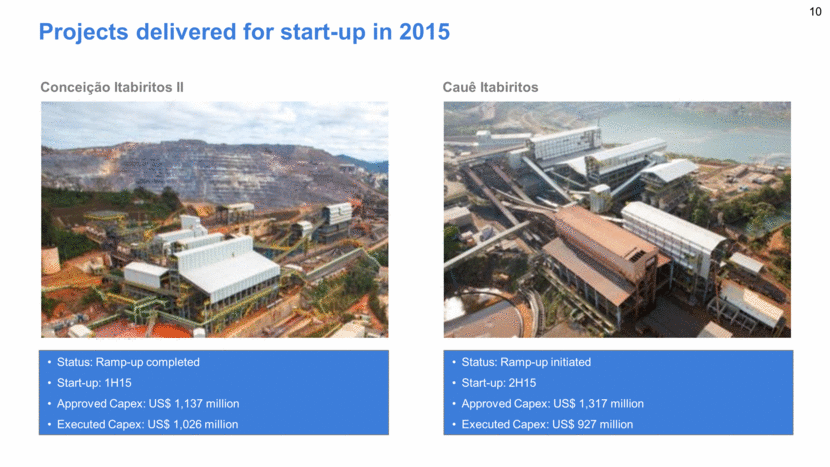
Projects delivered for start-up in 2015 Cauê Itabiritos Conceição Itabiritos II Status: Ramp-up completed Start-up: 1H15 Approved Capex: US$ 1,137 million Executed Capex: US$ 1,026 million Status: Ramp-up initiated Start-up: 2H15 Approved Capex: US$ 1,317 million Executed Capex: US$ 927 million
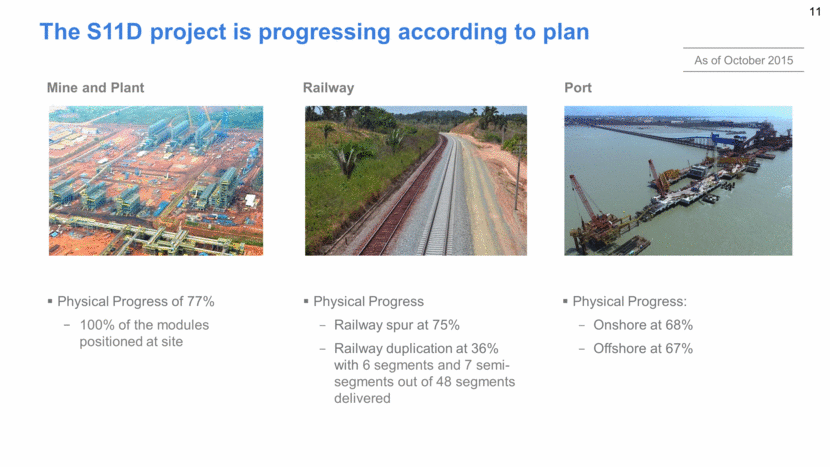
Mine and Plant Railway Port Physical Progress of 77% 100% of the modules positioned at site Physical Progress Railway spur at 75% Railway duplication at 36% with 6 segments and 7 semi-segments out of 48 segments delivered Physical Progress: Onshore at 68% Offshore at 67% The S11D project is progressing according to plan As of October 2015
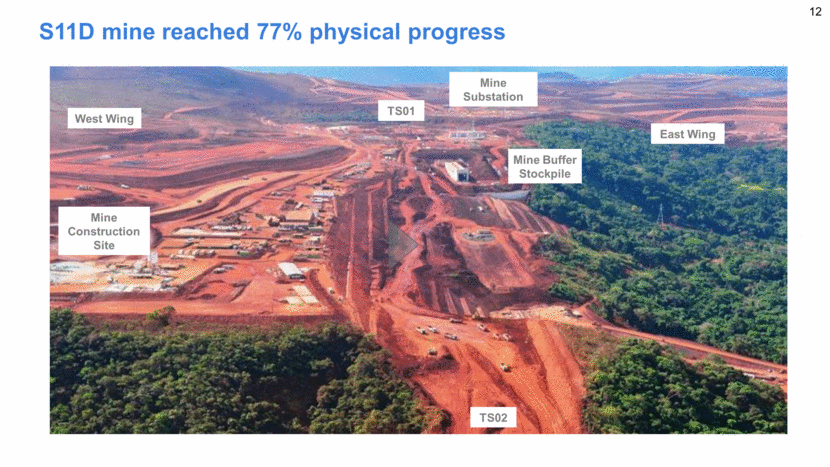
S11D mine reached 77% physical progress Mine Construction Site East Wing West Wing Mine Buffer Stockpile TS01 Mine Substation TS02
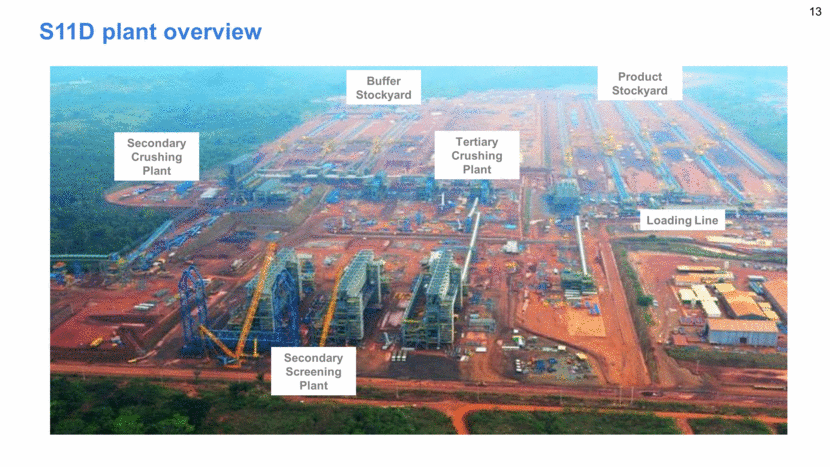
S11D plant overview Secondary Screening Plant Secondary Crushing Plant Buffer Stockyard Tertiary Crushing Plant Product Stockyard Loading Line
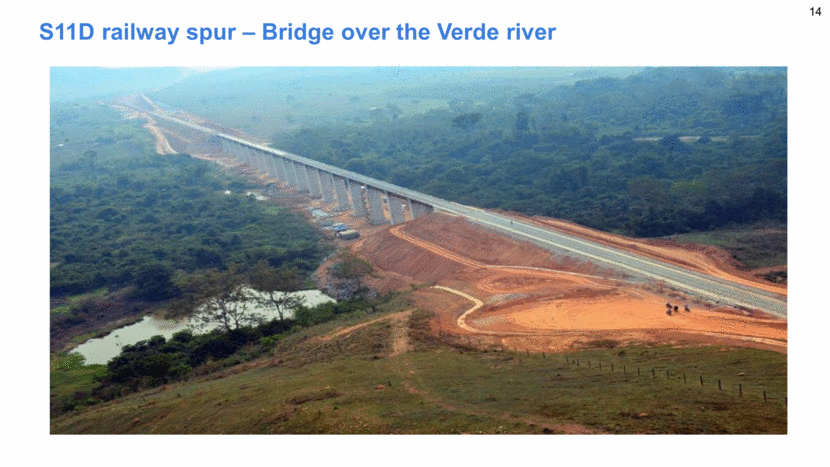
S11D railway spur – Bridge over the Verde river
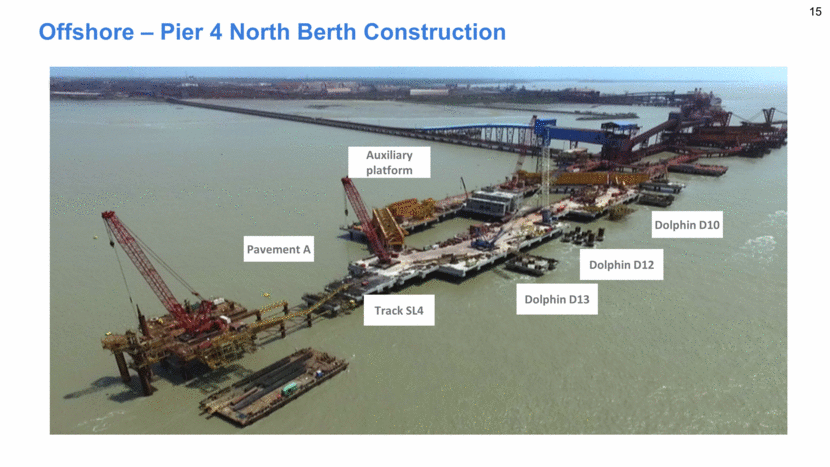
Auxiliary platform Track SL4 Pavement A Dolphin D10 Dolphin D12 Dolphin D13 Offshore – Pier 4 North Berth Construction
Significant costs and expenses reductions since the end of 2014 C1 Cash Cost FOB¹ port Brazil US$/t Freight Costs US$/t -44% 1 Cost of mine, plant, railway and port, excluding ROM, third party acquisitions and royalties 2 Expenses increased in October due to seasonality effects Source: Company reports Expenses and Royalties US$/t -34% -51% 21.5 18.3 15.8 12.7 12.1 4Q14 1Q15 2Q15 3Q15 Oct15 21.7 17.2 16.8 16.4 14.3 4Q14 1Q15 2Q15 3Q15 Oct15 11.0 5.5 5.1 4.4 5.4 4Q14 1Q15 2Q15 3Q15 Oct15²
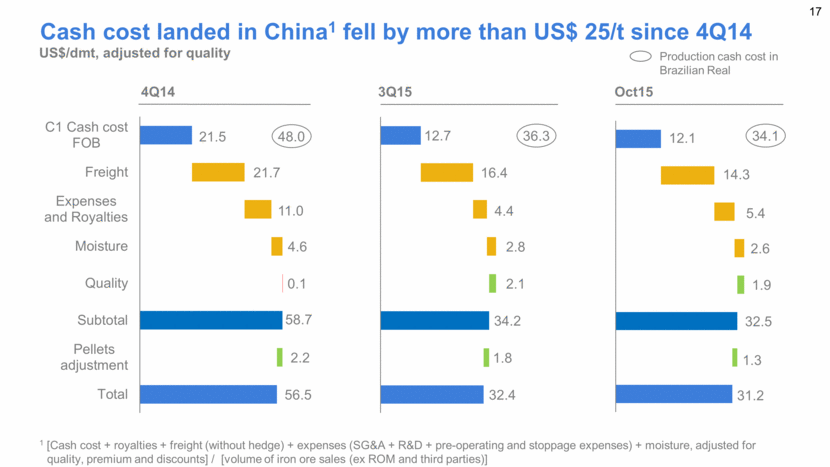
4Q14 3Q15 Cash cost landed in China1 fell by more than US$ 25/t since 4Q14 US$/dmt, adjusted for quality Oct15 1 [Cash cost + royalties + freight (without hedge) + expenses (SG&A + R&D + pre-operating and stoppage expenses) + moisture, adjusted for quality, premium and discounts] / [volume of iron ore sales (ex ROM and third parties)] Production cash cost in Brazilian Real 34.1 36.3 48.0 12.7 16.4 4.4 2.8 2.1 34.2 1.8 32.4 12.1 14.3 5.4 2.6 1.9 32.5 1.3 31.2 21.5 21.7 11.0 4.6 0.1 58.7 2.2 56.5 C1 Cash cost FOB Freight Expenses and Royalties Moisture Quality Subtotal Pellets adjustment Total
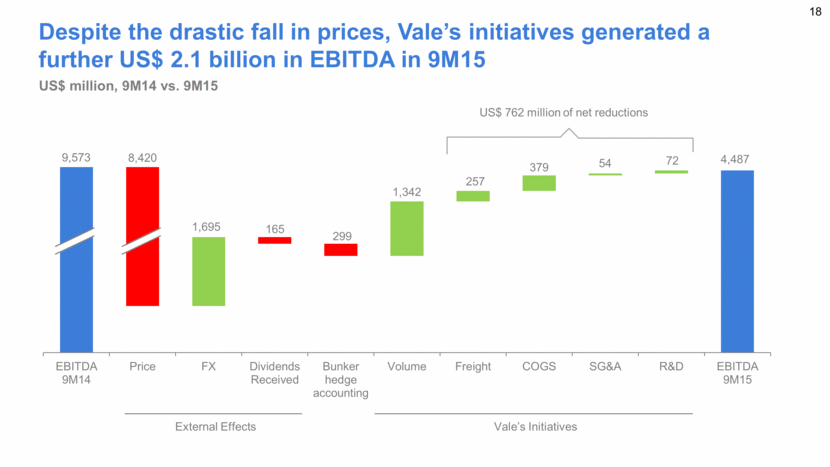
Despite the drastic fall in prices, Vale’s initiatives generated a further US$ 2.1 billion in EBITDA in 9M15 US$ million, 9M14 vs. 9M15 External Effects Vale’s Initiatives US$ 762 million of net reductions 9,573 8,420 1,695 165 299 1,342 257 379 54 72 4,487 EBITDA 9M14 Price FX Dividends Received Bunker hedge accounting Volume Freight COGS SG&A R&D EBITDA 9M15
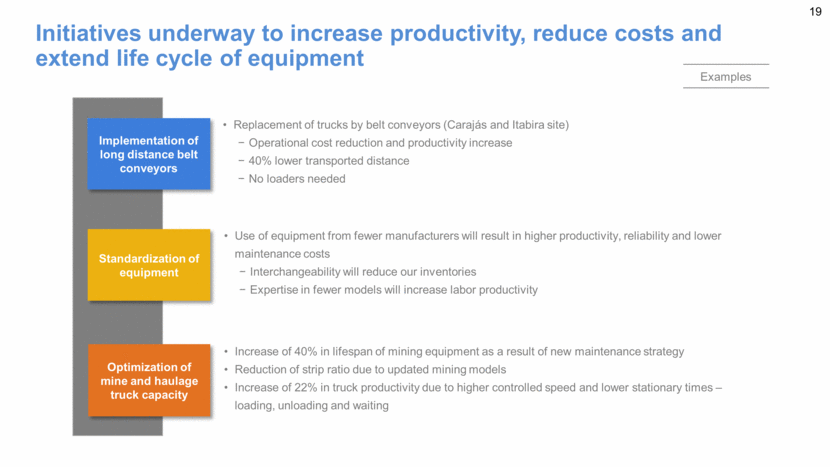
Initiatives underway to increase productivity, reduce costs and extend life cycle of equipment Replacement of trucks by belt conveyors (Carajás and Itabira site) Operational cost reduction and productivity increase 40% lower transported distance No loaders needed Use of equipment from fewer manufacturers will result in higher productivity, reliability and lower maintenance costs Interchangeability will reduce our inventories Expertise in fewer models will increase labor productivity Increase of 40% in lifespan of mining equipment as a result of new maintenance strategy Reduction of strip ratio due to updated mining models Increase of 22% in truck productivity due to higher controlled speed and lower stationary times – loading, unloading and waiting Implementation of long distance belt conveyors Standardization of equipment Optimization of mine and haulage truck capacity Examples
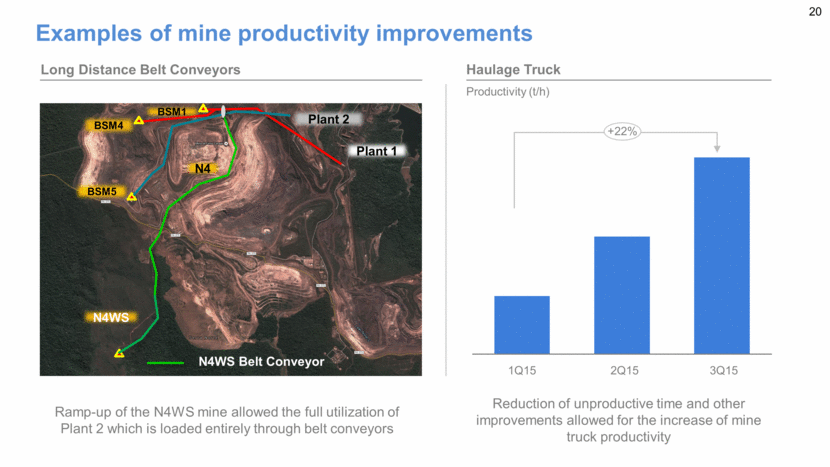
Examples of mine productivity improvements Long Distance Belt Conveyors Haulage Truck Productivity (t/h) 3Q15 2Q15 1Q15 +22% N4 N4WS BSM1 BSM4 BSM5 Plant 2 Plant 1 N4WS Belt Conveyor Ramp-up of the N4WS mine allowed the full utilization of Plant 2 which is loaded entirely through belt conveyors Reduction of unproductive time and other improvements allowed for the increase of mine truck productivity
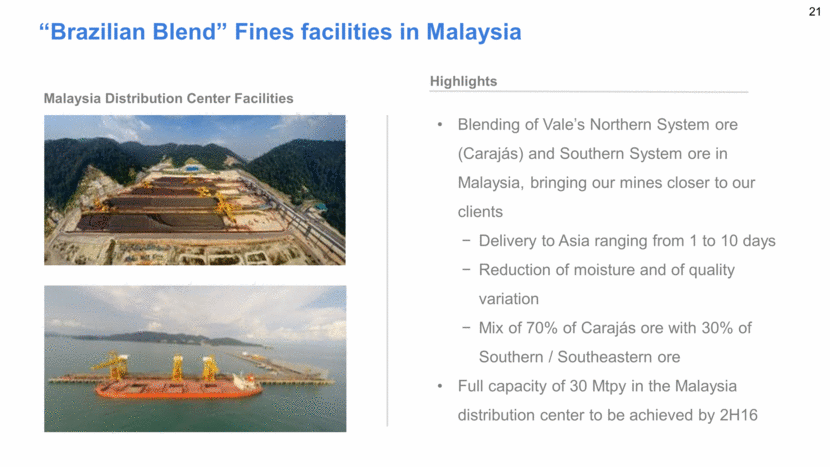
“Brazilian Blend” Fines facilities in Malaysia Highlights Blending of Vale’s Northern System ore (Carajás) and Southern System ore in Malaysia, bringing our mines closer to our clients Delivery to Asia ranging from 1 to 10 days Reduction of moisture and of quality variation Mix of 70% of Carajás ore with 30% of Southern / Southeastern ore Full capacity of 30 Mtpy in the Malaysia distribution center to be achieved by 2H16 Malaysia Distribution Center Facilities
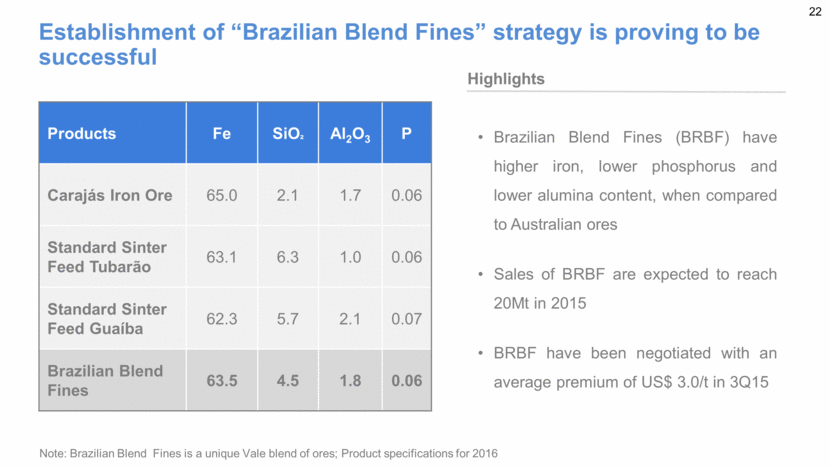
Establishment of “Brazilian Blend Fines” strategy is proving to be successful Products Fe SiO² Al2O3 P Carajás Iron Ore 65.0 2.1 1.7 0.06 Standard Sinter Feed Tubarão 63.1 6.3 1.0 0.06 Standard Sinter Feed Guaíba 62.3 5.7 2.1 0.07 Brazilian Blend Fines 63.5 4.5 1.8 0.06 Brazilian Blend Fines (BRBF) have higher iron, lower phosphorus and lower alumina content, when compared to Australian ores Sales of BRBF are expected to reach 20Mt in 2015 BRBF have been negotiated with an average premium of US$ 3.0/t in 3Q15 Highlights Note: Brazilian Blend Fines is a unique Vale blend of ores; Product specifications for 2016
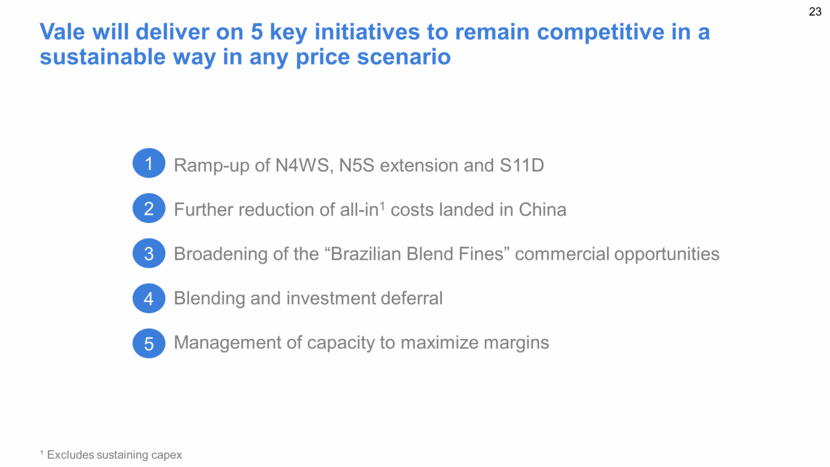
Vale will deliver on 5 key initiatives to remain competitive in a sustainable way in any price scenario Ramp-up of N4WS, N5S extension and S11D Further reduction of all-in1 costs landed in China Broadening of the “Brazilian Blend Fines” commercial opportunities Blending and investment deferral Management of capacity to maximize margins 1 2 3 4 5 ¹ Excludes sustaining capex
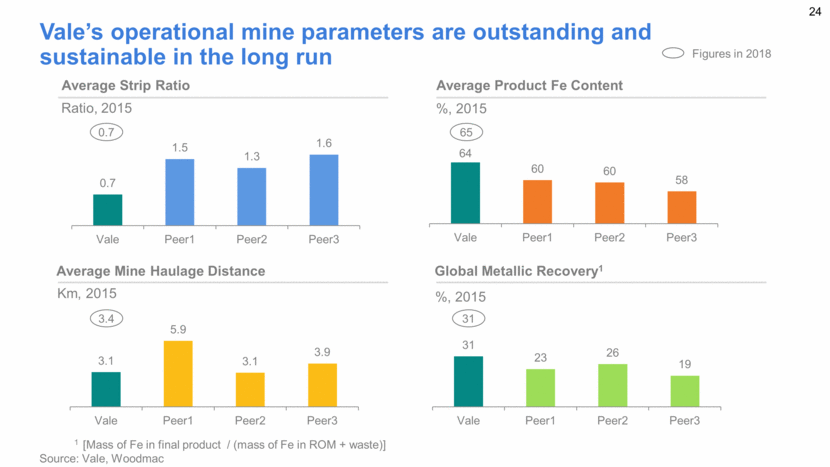
Vale’s operational mine parameters are outstanding and sustainable in the long run Average Strip Ratio Average Mine Haulage Distance Km, 2015 Ratio, 2015 Average Product Fe Content Global Metallic Recovery1 %, 2015 %, 2015 1 [Mass of Fe in final product / (mass of Fe in ROM + waste)] Source: Vale, Woodmac Figures in 2018 0.7 65 3.4 31 0.7 1.5 1.3 1.6 Vale Peer1 Peer2 Peer3 3.1 5.9 3.1 3.9 Vale Peer1 Peer2 Peer3 64 60 60 58 Vale Peer1 Peer2 Peer3 31 23 26 19 Vale Peer1 Peer2 Peer3
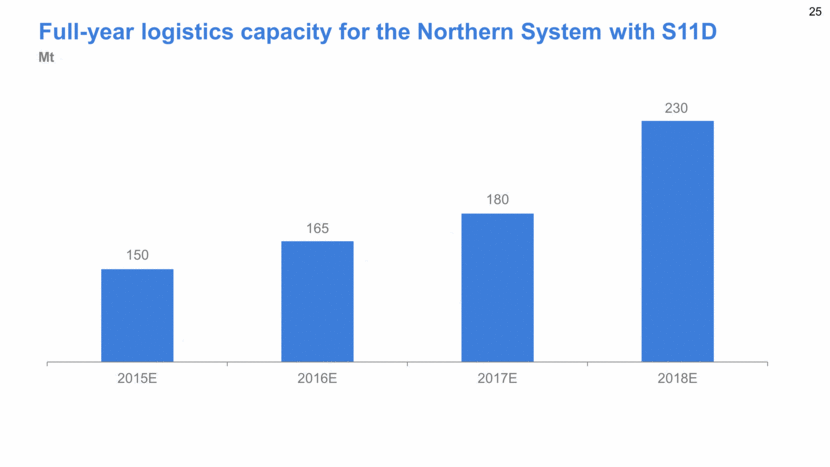
Full-year logistics capacity for the Northern System with S11D Mt 150 165 180 230 2015E 2016E 2017E 2018E
Vale’s iron ore and pellets production plan ¹ Includes pellet feed; excludes 9Mt of fines and 8Mt of ROM related to Samarco incident ² Note: About 11-12% of iron ore fines production go to pellets production Iron ore¹ Pellets² Mt Production range Non additive production 340 340 - 350 380 - 400 420 - 440 420 - 450 420 - 450 2015E 2016E 2017E 2018E 2019E 2020E 49 49 50 50 55 56 2015E 2016E 2017E 2018E 2019E 2020E

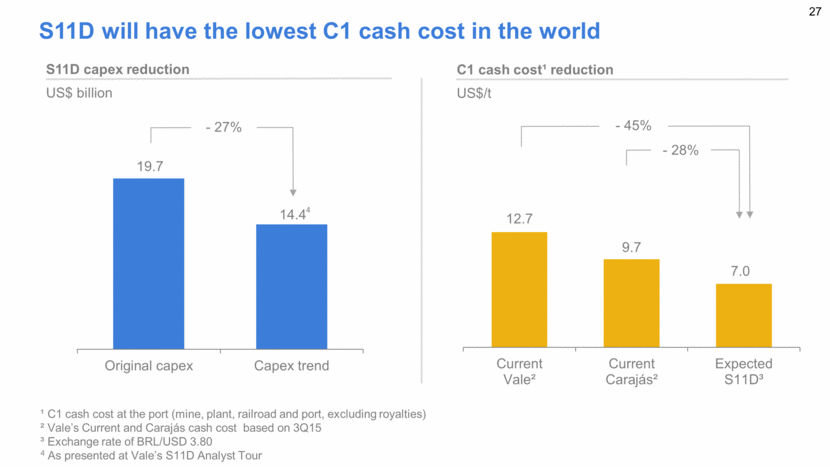
C1 cash cost¹ reduction US$/t S11D capex reduction US$ billion S11D will have the lowest C1 cash cost in the world ¹ C1 cash cost at the port (mine, plant, railroad and port, excluding royalties) ² Vale’s Current and Carajás cash cost based on 3Q15 ³ Exchange rate of BRL/USD 3.80 4 As presented at Vale’s S11D Analyst Tour - 28% - 45% - 27% 12.7 9.7 7.0 Current Vale² Current Carajás² Expected S11D³ 19.7 14.4 Original capex Capex trend 4
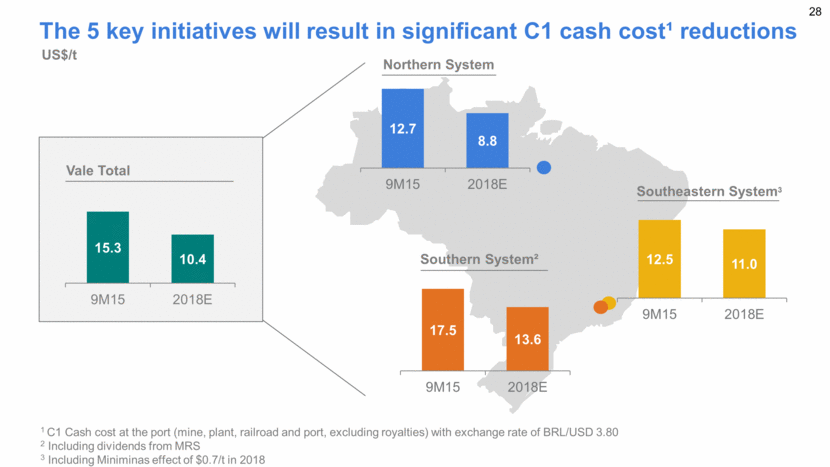
The 5 key initiatives will result in significant C1 cash cost¹ reductions Northern System Southeastern System3 Southern System² 1 C1 Cash cost at the port (mine, plant, railroad and port, excluding royalties) with exchange rate of BRL/USD 3.80 2 Including dividends from MRS 3 Including Miniminas effect of $0.7/t in 2018 US$/t Vale Total 15.3 10.4 9M15 2018E 12.7 8.8 9M15 2018E 17.5 13.6 9M15 2018E 12.5 11.0 9M15 2018E
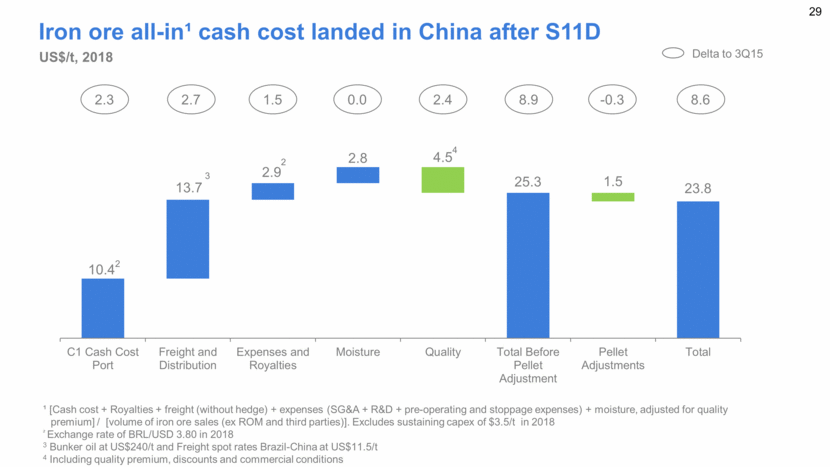
Iron ore all-in¹ cash cost landed in China after S11D Delta to 3Q15 2.3 2.7 1.5 2.4 8.6 0.0 2 2 ¹ [Cash cost + Royalties + freight (without hedge) + expenses (SG&A + R&D + pre-operating and stoppage expenses) + moisture, adjusted for quality premium] / [volume of iron ore sales (ex ROM and third parties)]. Excludes sustaining capex of $3.5/t in 2018 ² Exchange rate of BRL/USD 3.80 in 2018 3 Bunker oil at US$240/t and Freight spot rates Brazil-China at US$11.5/t 4 Including quality premium, discounts and commercial conditions US$/t, 2018 8.9 -0.3 4 3 10.4 13.7 2.9 2.8 4.5 25.3 1.5 23.8 C1 Cash Cost Port Freight and Distribution Expenses and Royalties Moisture Quality Total Before Pellet Adjustment Pellet Adjustments Total
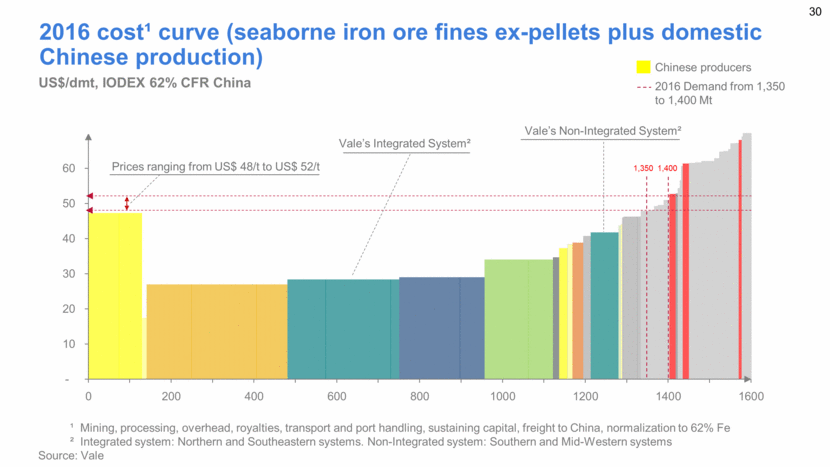
2016 cost¹ curve (seaborne iron ore fines ex-pellets plus domestic Chinese production) US$/dmt, IODEX 62% CFR China Chinese producers 2016 Demand from 1,350 to 1,400 Mt ¹ Mining, processing, overhead, royalties, transport and port handling, sustaining capital, freight to China, normalization to 62% Fe ² Integrated system: Northern and Southeastern systems. Non-Integrated system: Southern and Mid-Western systems Source: Vale Vale’s Integrated System² Vale’s Non-Integrated System² Prices ranging from US$ 48/t to US$ 52/t 1,350 1,400 - 10 20 30 40 50 60 70 0 200 400 600 800 1000 1200 1400 1600
Jennifer Maki Executive director, Base Metals
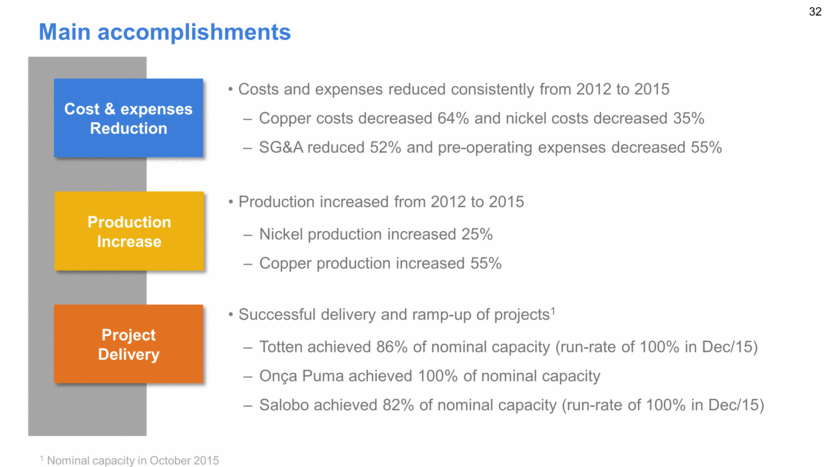
Main accomplishments 1 Nominal capacity in October 2015 Project Delivery Production Increase Cost & expenses Reduction Production increased from 2012 to 2015 Nickel production increased 25% Copper production increased 55% Costs and expenses reduced consistently from 2012 to 2015 Copper costs decreased 64% and nickel costs decreased 35% SG&A reduced 52% and pre-operating expenses decreased 55% Successful delivery and ramp-up of projects1 Totten achieved 86% of nominal capacity (run-rate of 100% in Dec/15) Onça Puma achieved 100% of nominal capacity Salobo achieved 82% of nominal capacity (run-rate of 100% in Dec/15)
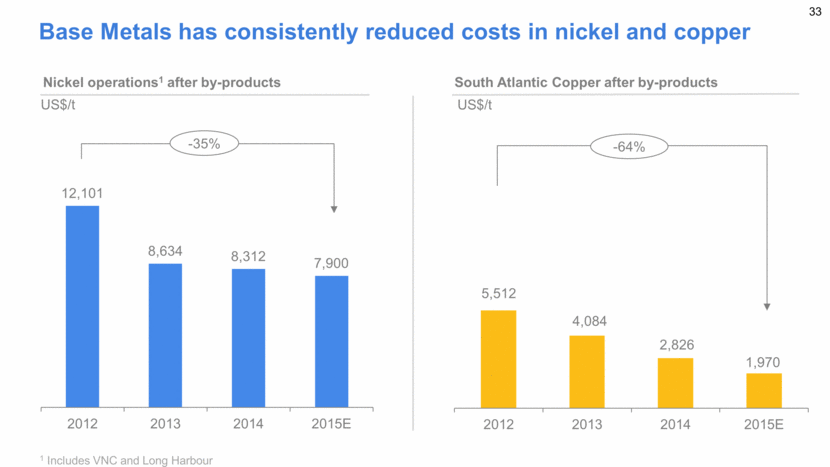
Base Metals has consistently reduced costs in nickel and copper -35% US$/t Nickel operations1 after by-products South Atlantic Copper after by-products US$/t -64% 1 Includes VNC and Long Harbour 5,512 4,084 2,826 1,970 2012 2013 2014 2015E 12,101 8,634 8,312 7,900 2012 2013 2014 2015E
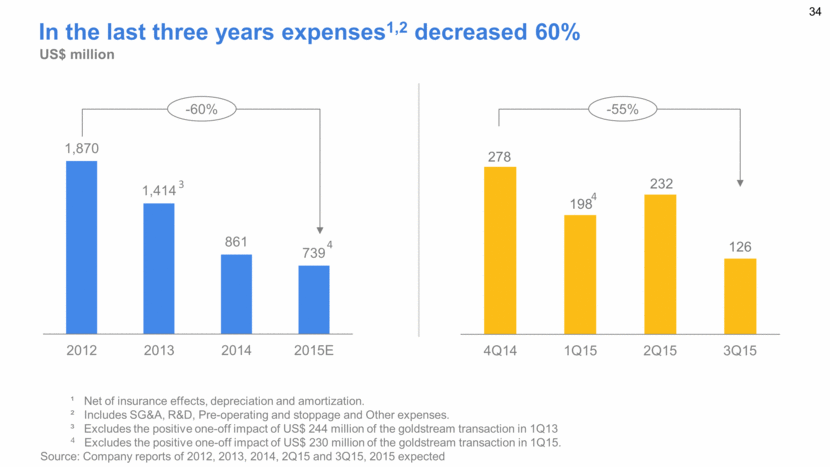
In the last three years expenses1,2 decreased 60% ¹ Net of insurance effects, depreciation and amortization. ² Includes SG&A, R&D, Pre-operating and stoppage and Other expenses. ³ Excludes the positive one-off impact of US$ 244 million of the goldstream transaction in 1Q13 4 Excludes the positive one-off impact of US$ 230 million of the goldstream transaction in 1Q15. Source: Company reports of 2012, 2013, 2014, 2Q15 and 3Q15, 2015 expected US$ million -60% 3 -55% 4 4 1,870 1,414 861 739 2012 2013 2014 2015E 278 198 232 126 4Q14 1Q15 2Q15 3Q15
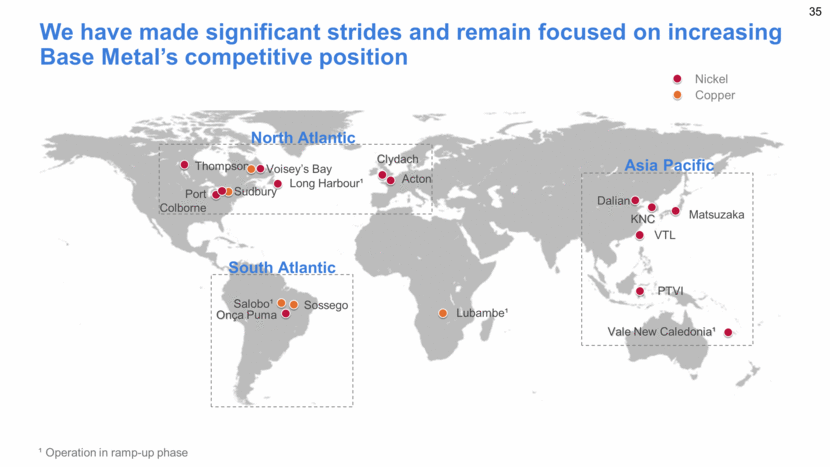
Salobo¹ Clydach Vale New Caledonia¹ Thompson Voisey’s Bay Sudbury Sossego Onça Puma Acton PTVI Matsuzaka VTL Dalian Copper Nickel South Atlantic Asia Pacific Port Colborne Long Harbour¹ KNC Lubambe¹ We have made significant strides and remain focused on increasing Base Metal’s competitive position North Atlantic ¹ Operation in ramp-up phase
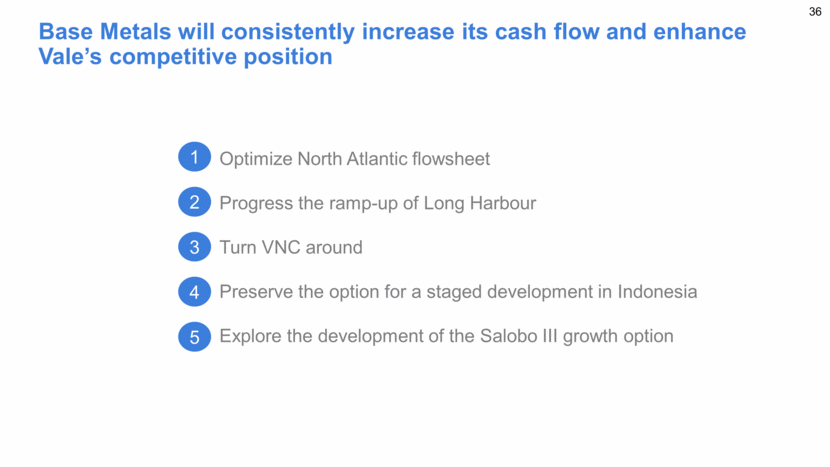
Base Metals will consistently increase its cash flow and enhance Vale’s competitive position Optimize North Atlantic flowsheet Progress the ramp-up of Long Harbour Turn VNC around Preserve the option for a staged development in Indonesia Explore the development of the Salobo III growth option 1 2 3 4 5
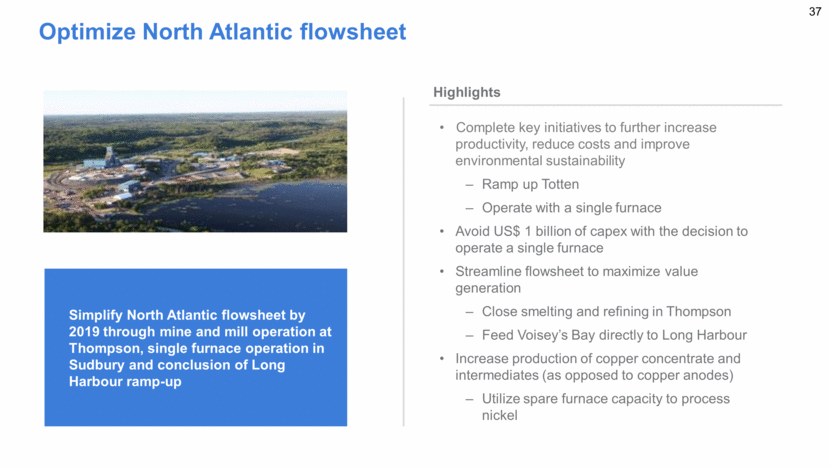
Optimize North Atlantic flowsheet Complete key initiatives to further increase productivity, reduce costs and improve environmental sustainability Ramp up Totten Operate with a single furnace Avoid US$ 1 billion of capex with the decision to operate a single furnace Streamline flowsheet to maximize value generation Close smelting and refining in Thompson Feed Voisey’s Bay directly to Long Harbour Increase production of copper concentrate and intermediates (as opposed to copper anodes) Utilize spare furnace capacity to process nickel Simplify North Atlantic flowsheet by 2019 through: mine and mill operation at Thompson, single furnace operation in Sudbury and conclusion of Long Harbour ramp-up Vision Simplify North Atlantic flowsheet by 2019 through mine and mill operation at Thompson, single furnace operation in Sudbury and conclusion of Long Harbour ramp-up Highlights
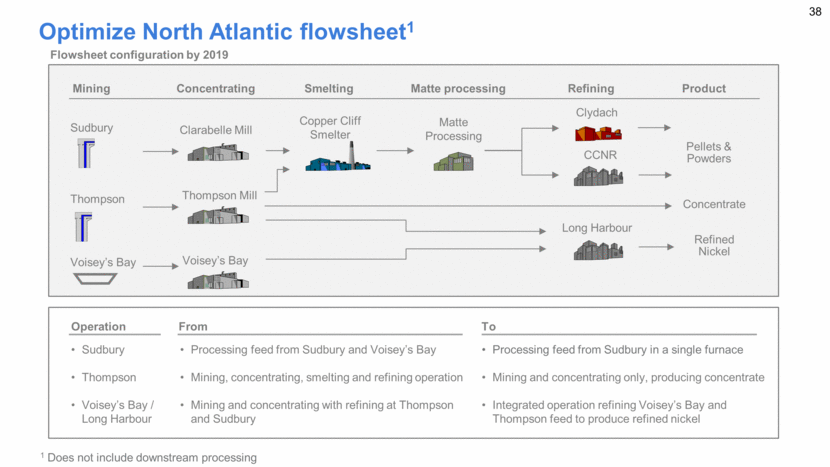
Optimize North Atlantic flowsheet1 From Processing feed from Sudbury and Voisey’s Bay Mining, concentrating, smelting and refining operation Mining and concentrating with refining at Thompson and Sudbury To Processing feed from Sudbury in a single furnace Mining and concentrating only, producing concentrate Integrated operation refining Voisey’s Bay and Thompson feed to produce refined nickel Operation Sudbury Thompson Voisey’s Bay / Long Harbour Mining Concentrating Smelting Matte processing Refining Product Clarabelle Mill Thompson Mill Pellets & Powders CCNR Concentrate Voisey’s Bay Long Harbour Refined Nickel Sudbury Voisey’s Bay Thompson Clydach Matte Processing Copper Cliff Smelter Flowsheet configuration by 2019 1 Does not include downstream processing
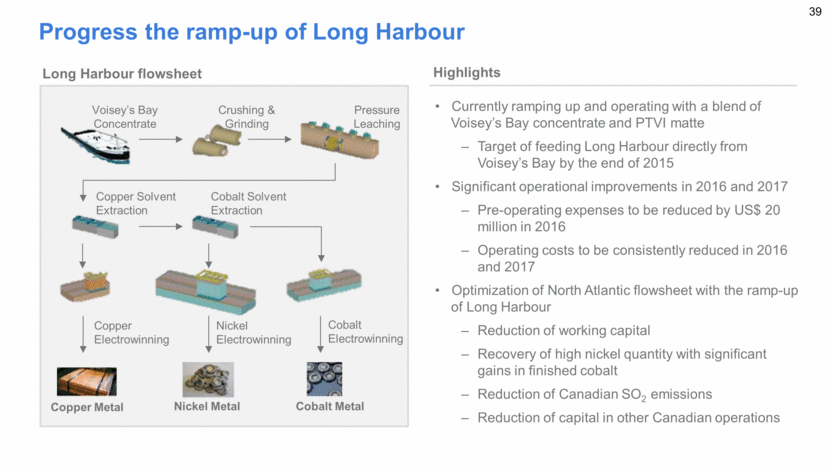
Currently ramping up and operating with a blend of Voisey’s Bay concentrate and PTVI matte Target of feeding Long Harbour directly from Voisey’s Bay by the end of 2015 Significant operational improvements in 2016 and 2017 Pre-operating expenses to be reduced by US$ 20 million in 2016 Operating costs to be consistently reduced in 2016 and 2017 Optimization of North Atlantic flowsheet with the ramp-up of Long Harbour Reduction of working capital Recovery of high nickel quantity with significant gains in finished cobalt Reduction of Canadian SO2 emissions Reduction of capital in other Canadian operations Progress the ramp-up of Long Harbour Highlights Cobalt Electrowinning Crushing & Grinding Voisey’s Bay Concentrate Nickel Electrowinning Copper Electrowinning Pressure Leaching Cobalt Solvent Extraction Copper Solvent Extraction Copper Metal Nickel Metal Cobalt Metal Long Harbour flowsheet
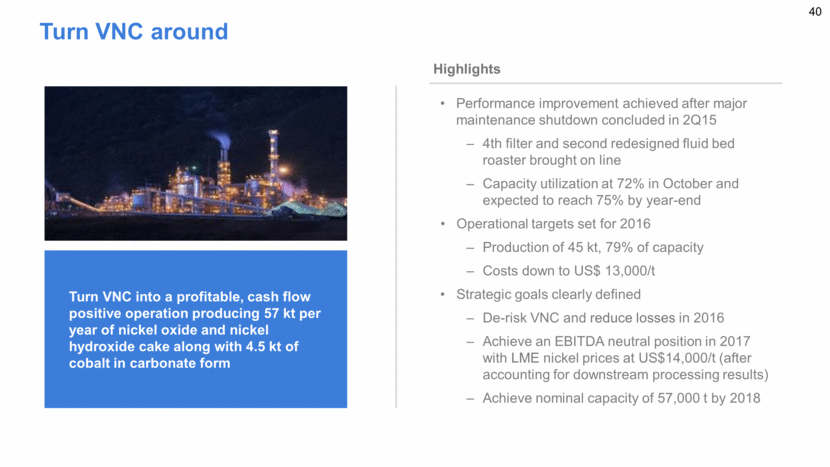
Performance improvement achieved after major maintenance shutdown concluded in 2Q15 4th filter and second redesigned fluid bed roaster brought on line Capacity utilization at 72% in October and expected to reach 75% by year-end Operational targets set for 2016 Production of 45 kt, 79% of capacity Costs down to US$ 13,000/t Strategic goals clearly defined De-risk VNC and reduce losses in 2016 Achieve an EBITDA neutral position in 2017 with LME nickel prices at US$14,000/t (after accounting for downstream processing results) Achieve nominal capacity of 57,000 t by 2018 Turn VNC around Turn VNC into a profitable, cash flow positive operation producing 57 kt per year of nickel oxide and nickel hydroxide cake along with 4.5 kt of cobalt in carbonate form Highlights
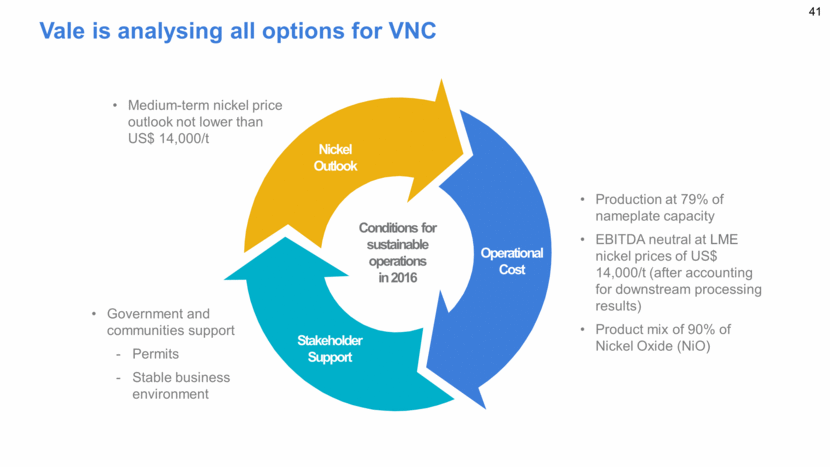
Vale is analysing all options for VNC Operational Cost Stakeholder Support Nickel Outlook Government and communities support Permits Stable business environment Production at 79% of nameplate capacity EBITDA neutral at LME nickel prices of US$ 14,000/t (after accounting for downstream processing results) Product mix of 90% of Nickel Oxide (NiO) Medium-term nickel price outlook not lower than US$ 14,000/t Conditions for sustainable operations in 2016
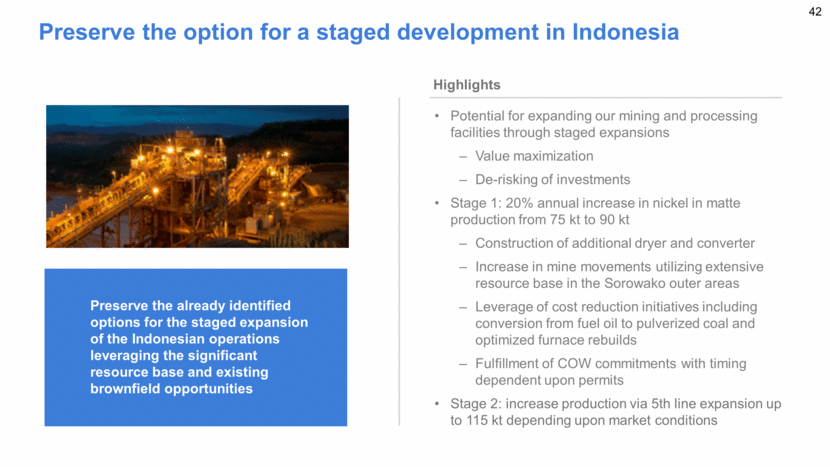
Preserve the option for a staged development in Indonesia Potential for expanding our mining and processing facilities through staged expansions Value maximization De-risking of investments Stage 1: 20% annual increase in nickel in matte production from 75 kt to 90 kt Construction of additional dryer and converter Increase in mine movements utilizing extensive resource base in the Sorowako outer areas Leverage of cost reduction initiatives including conversion from fuel oil to pulverized coal and optimized furnace rebuilds Fulfillment of COW commitments with timing dependent upon permits Stage 2: increase production via 5th line expansion up to 115 kt depending upon market conditions Concentration plant with 12 Mtpy processing capacity to reclaim previously stockpiled ore – processing at lower cost – along with substantial gold by-product volumes Vision Highlights Preserve the already identified options for the staged expansion of the Indonesian operations leveraging the significant resource base and existing brownfield opportunities
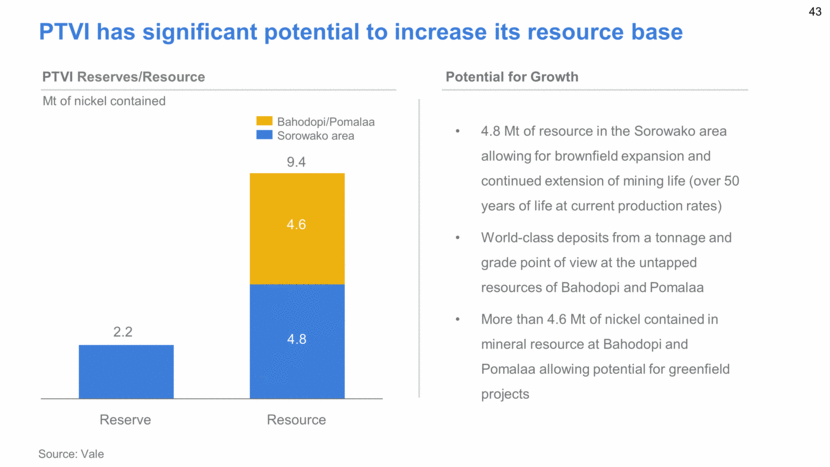
PTVI has significant potential to increase its resource base PTVI Reserves/Resource Mt of nickel contained 4.8 Mt of resource in the Sorowako area allowing for brownfield expansion and continued extension of mining life (over 50 years of life at current production rates) World-class deposits from a tonnage and grade point of view at the untapped resources of Bahodopi and Pomalaa More than 4.6 Mt of nickel contained in mineral resource at Bahodopi and Pomalaa allowing potential for greenfield projects Reserve 4.6 4.8 9.4 Resource 2.2 Bahodopi/Pomalaa Sorowako area Source: Vale Potential for Growth
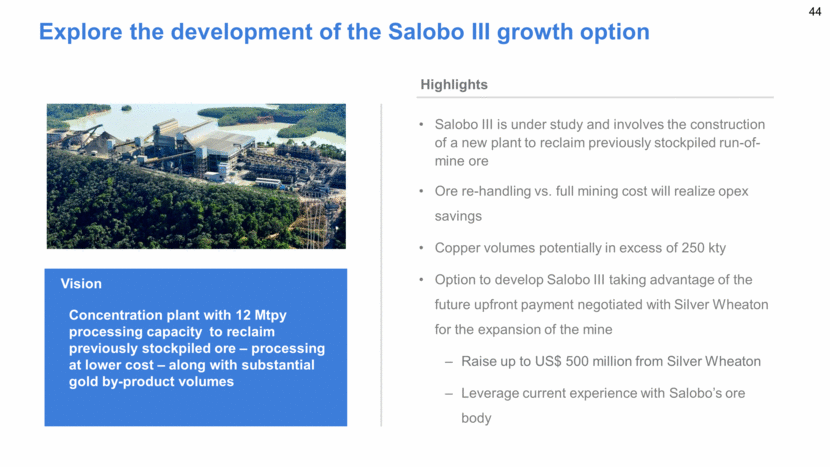
Explore the development of the Salobo III growth option Concentration plant with 12 Mtpy processing capacity to reclaim previously stockpiled ore – processing at lower cost – along with substantial gold by-product volumes Salobo III is under study and involves the construction of a new plant to reclaim previously stockpiled run-of-mine ore Ore re-handling vs. full mining cost will realize opex savings Copper volumes potentially in excess of 250 kty Option to develop Salobo III taking advantage of the future upfront payment negotiated with Silver Wheaton for the expansion of the mine Raise up to US$ 500 million from Silver Wheaton Leverage current experience with Salobo’s ore body Vision Concentration plant with 12 Mtpy processing capacity to reclaim previously stockpiled ore – processing at lower cost – along with substantial gold by-product volumes Vision Highlights
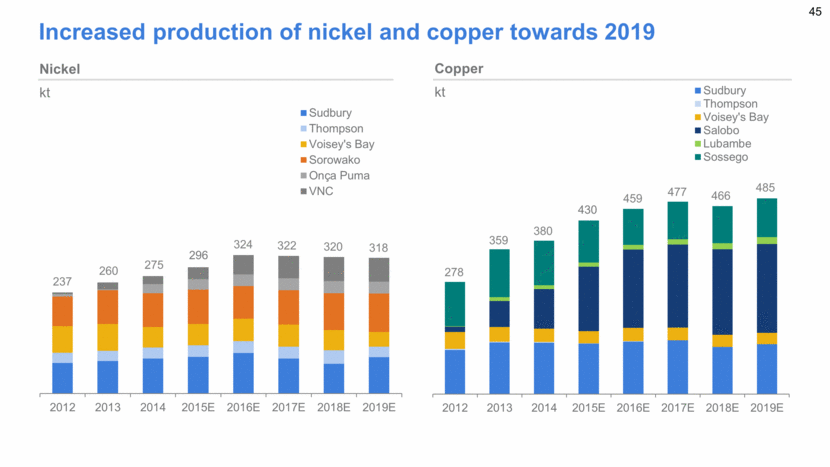
Increased production of nickel and copper towards 2019 Nickel kt Copper kt 237 260 275 296 324 322 320 318 278 359 380 430 459 477 466 485 2012 2013 2014 2015E 2016E 2017E 2018E 2019E Sudbury Thompson Voisey's Bay Sorowako Onça Puma VNC 2012 2013 2014 2015E 2016E 2017E 2018E 2019E Sudbury Thompson Voisey's Bay Salobo Lubambe Sossego
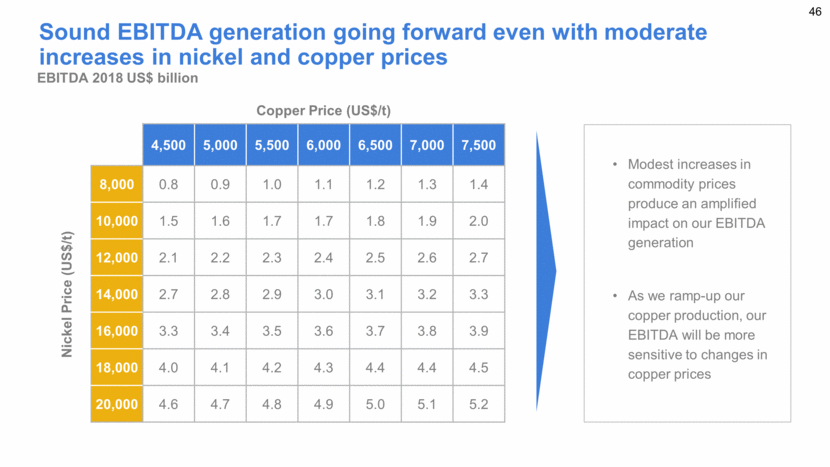
Sound EBITDA generation going forward even with moderate increases in nickel and copper prices EBITDA 2018 US$ billion Modest increases in commodity prices produce an amplified impact on our EBITDA generation As we ramp-up our copper production, our EBITDA will be more sensitive to changes in copper prices Copper Price (US$/t) 4,500 5,000 5,500 6,000 6,500 7,000 7,500 Nickel Price (US$/t) 8,000 0.8 0.9 1.0 1.1 1.2 1.3 1.4 10,000 1.5 1.6 1.7 1.7 1.8 1.9 2.0 12,000 2.1 2.2 2.3 2.4 2.5 2.6 2.7 14,000 2.7 2.8 2.9 3.0 3.1 3.2 3.3 16,000 3.3 3.4 3.5 3.6 3.7 3.8 3.9 18,000 4.0 4.1 4.2 4.3 4.4 4.4 4.5 20,000 4.6 4.7 4.8 4.9 5.0 5.1 5.2
Roger Downey Executive director, Fertilizers
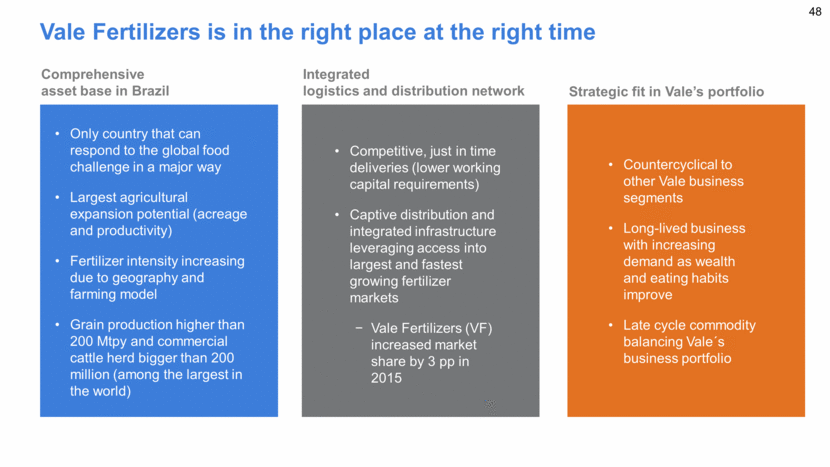
Only country that can respond to the global food challenge in a major way Largest agricultural expansion potential (acreage and productivity) Fertilizer intensity increasing due to geography and farming model Grain production higher than 200 Mtpy and commercial cattle herd bigger than 200 million (among the largest in the world) Countercyclical to other Vale business segments Long-lived business with increasing demand as wealth and eating habits improve Late cycle commodity balancing Vale´s business portfolio Vale Fertilizers is in the right place at the right time Competitive, just in time deliveries (lower working capital requirements) Captive distribution and integrated infrastructure leveraging access into largest and fastest growing fertilizer markets Vale Fertilizers (VF) increased market share by 3 pp in 2015 Comprehensive asset base in Brazil Integrated logistics and distribution network Strategic fit in Vale’s portfolio
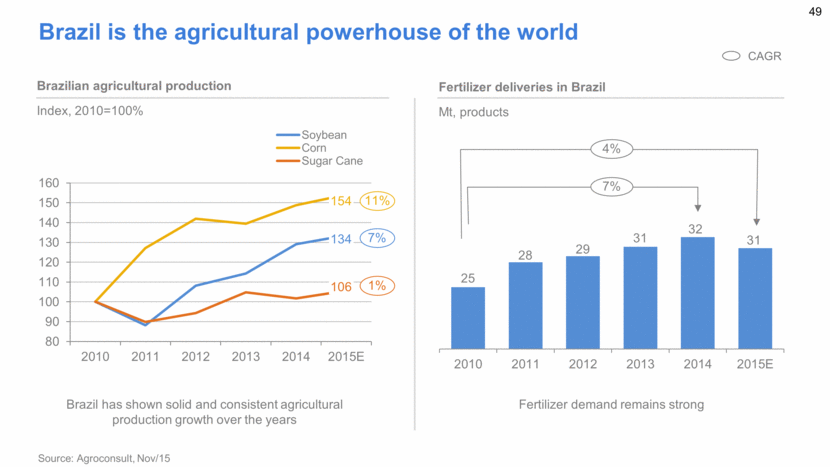
Brazil is the agricultural powerhouse of the world Brazilian agricultural production Index, 2010=100% Fertilizer deliveries in Brazil Mt, products 154 134 106 CAGR 11% 7% 1% 4% 7% Brazil has shown solid and consistent agricultural production growth over the years Fertilizer demand remains strong Source: Agroconsult, Nov/15 25 28 29 31 32 31 2010 2011 2012 2013 2014 2015E 80 90 100 110 120 130 140 150 160 2010 2011 2012 2013 2014 2015E Soybean Corn Sugar Cane
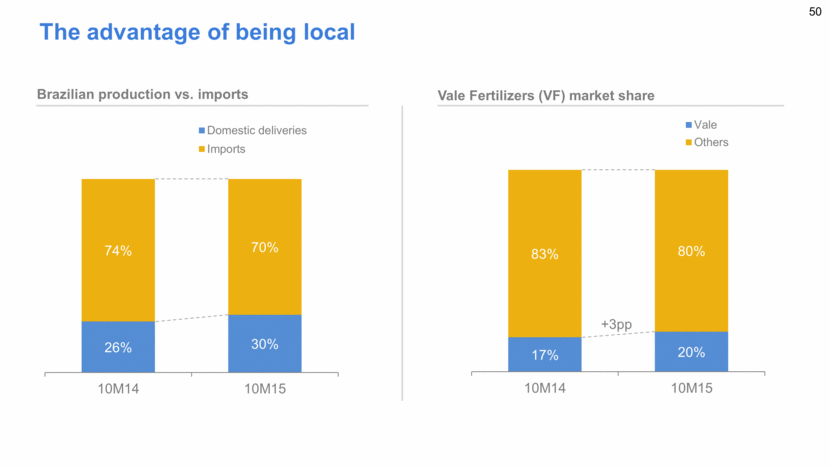
Vale Fertilizers (VF) market share The advantage of being local Brazilian production vs. imports +3pp 26% 30% 74% 70% 10M14 10M15 Domestic deliveries Imports 17% 20% 83% 80% 10M14 10M15 Vale Others
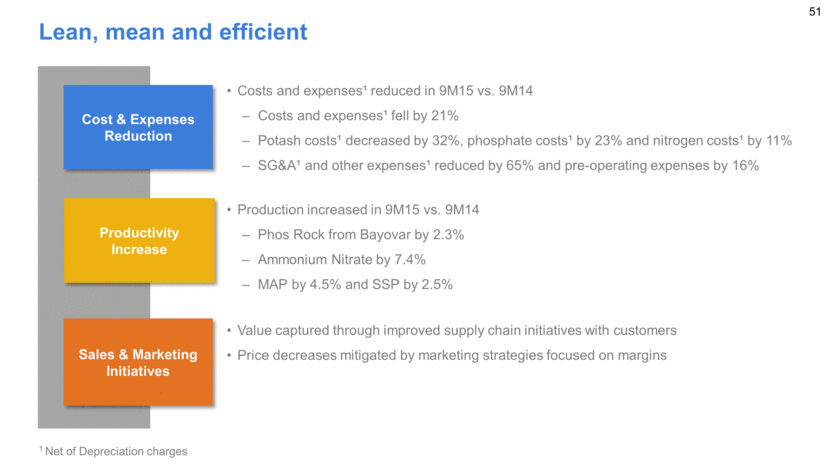
Costs and expenses¹ reduced in 9M15 vs. 9M14 Costs and expenses¹ fell by 21% Potash costs¹ decreased by 32%, phosphate costs¹ by 23% and nitrogen costs¹ by 11% SG&A¹ and other expenses¹ reduced by 65% and pre-operating expenses by 16% Cost & Expenses Reduction Productivity Increase Sales & Marketing Initiatives Value captured through improved supply chain initiatives with customers Price decreases mitigated by marketing strategies focused on margins Production increased in 9M15 vs. 9M14 Phos Rock from Bayovar by 2.3% Ammonium Nitrate by 7.4% MAP by 4.5% and SSP by 2.5% Lean, mean and efficient 1 Net of Depreciation charges
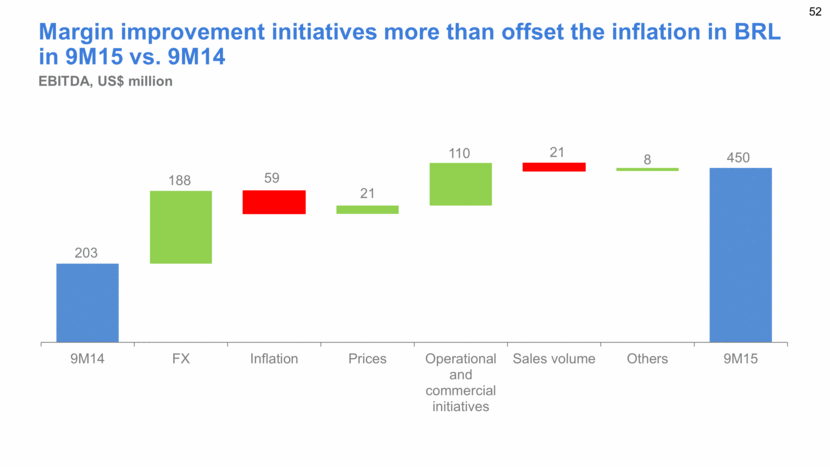
Margin improvement initiatives more than offset the inflation in BRL in 9M15 vs. 9M14 EBITDA, US$ million 188 21 110 8 59 21 203 450 9M14 FX Inflation Prices Operational and commercial initiatives Sales volume Others 9M15
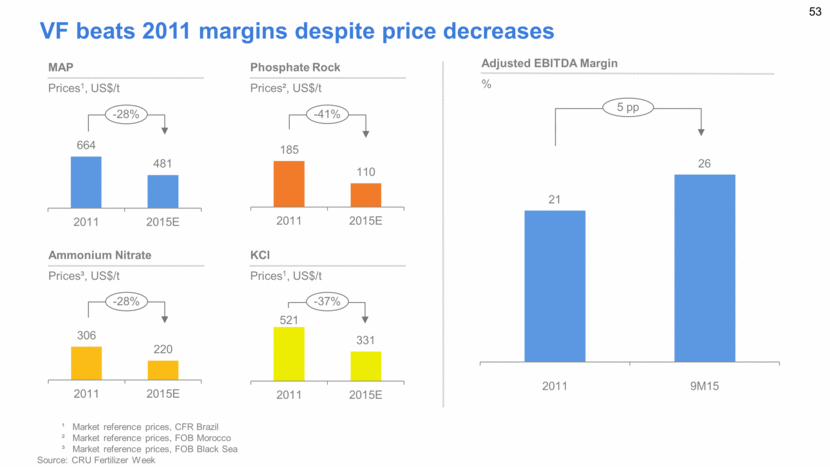
VF beats 2011 margins despite price decreases -28% MAP Prices1, US$/t -41% Phosphate Rock Prices², US$/t -28% Ammonium Nitrate Prices³, US$/t KCl Prices1, US$/t 5 pp Adjusted EBITDA Margin % ¹ Market reference prices, CFR Brazil ² Market reference prices, FOB Morocco ³ Market reference prices, FOB Black Sea Source: CRU Fertilizer Week -37% 664 481 2011 2015E 185 110 2011 2015E 306 220 2011 2015E 521 331 2011 2015E 21 26 2011 9M15
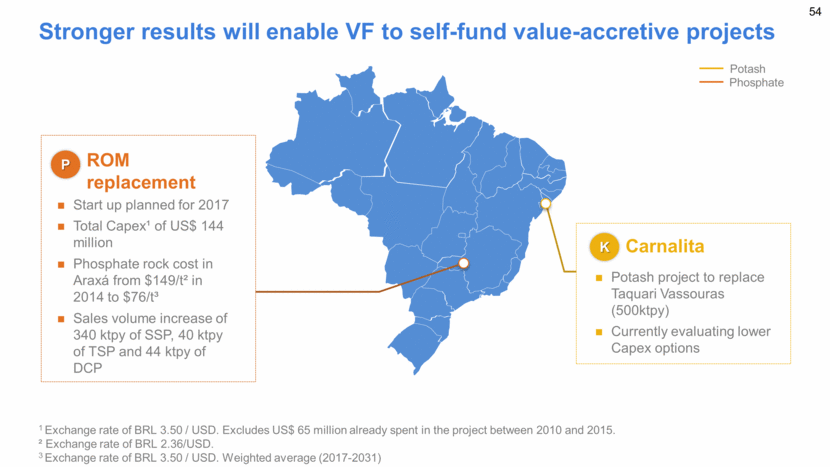
Stronger results will enable VF to self-fund value-accretive projects Start up planned for 2017 Total Capex¹ of US$ 144 million Phosphate rock cost in Araxá from $149/t² in 2014 to $76/t³ Sales volume increase of 340 ktpy of SSP, 40 ktpy of TSP and 44 ktpy of DCP P ROM replacement K Carnalita Potash project to replace Taquari Vassouras (500ktpy) Currently evaluating lower Capex options Potash Phosphate 1 Exchange rate of BRL 3.50 / USD. Excludes US$ 65 million already spent in the project between 2010 and 2015. ² Exchange rate of BRL 2.36/USD. 3 Exchange rate of BRL 3.50 / USD. Weighted average (2017-2031)
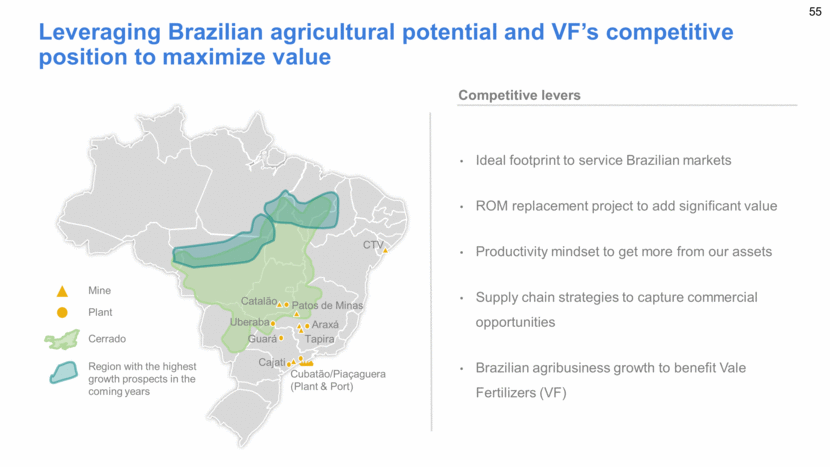
Leveraging Brazilian agricultural potential and VF’s competitive position to maximize value Ideal footprint to service Brazilian markets ROM replacement project to add significant value Productivity mindset to get more from our assets Supply chain strategies to capture commercial opportunities Brazilian agribusiness growth to benefit Vale Fertilizers (VF) Competitive levers CTV Catalão Uberaba Guará Patos de Minas Araxá Tapira Cubatão/Piaçaguera (Plant & Port) Cajati Mine Plant Cerrado Region with the highest growth prospects in the coming years
Roger Downey Executive director, Coal

Market conditions demand severe measures 1 Constant currency, US$ 2015 Source: CRU, Woodmac Metallurgical coal prices¹, US$/t Supply surplus World financial crisis Queensland floods China becomes relevant to the seaborne market 0 50 100 150 200 250 300 350 400 2005 2006 2007 2008 2009 2010 2011 2012 2013 2014 2015

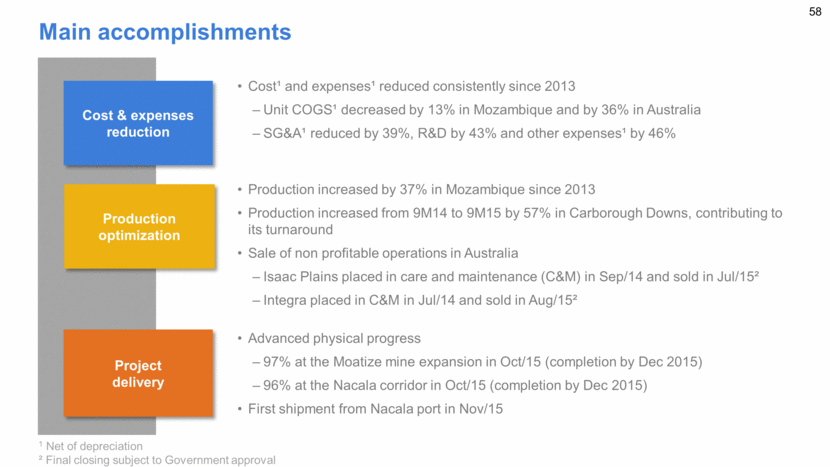
Cost¹ and expenses¹ reduced consistently since 2013 Unit COGS¹ decreased by 13% in Mozambique and by 36% in Australia SG&A¹ reduced by 39%, R&D by 43% and other expenses¹ by 46% Cost & expenses reduction Production optimization Project delivery Advanced physical progress 97% at the Moatize mine expansion in Oct/15 (completion by Dec 2015) 96% at the Nacala corridor in Oct/15 (completion by Dec 2015) First shipment from Nacala port in Nov/15 Production increased by 37% in Mozambique since 2013 Production increased from 9M14 to 9M15 by 57% in Carborough Downs, contributing to its turnaround Sale of non profitable operations in Australia Isaac Plains placed in care and maintenance (C&M) in Sep/14 and sold in Jul/15² Integra placed in C&M in Jul/14 and sold in Aug/15² Main accomplishments 1 Net of depreciation ² Final closing subject to Government approval
20% Yield CHPP 10% Truck Productivity Operational improvements in Mozambique are paving the way for a turnaround in our coal business Index, 2013 = 100 tph 100 110 120 2013 2014 10M15 420 448 461 2013 2014 10M15

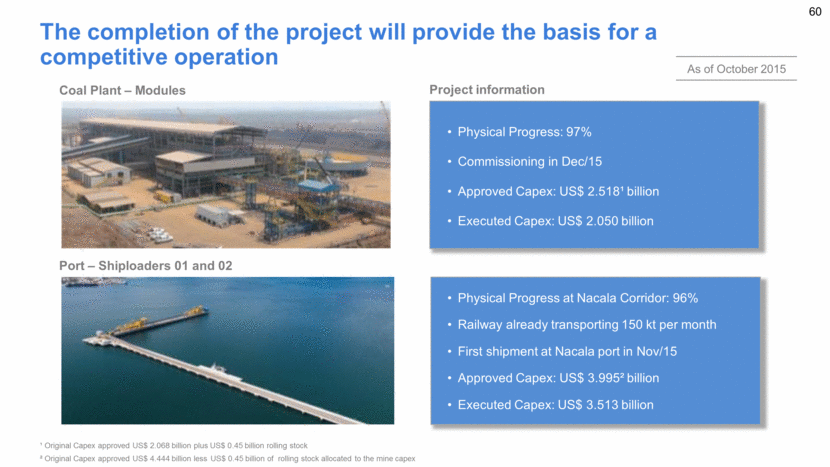
The completion of the project will provide the basis for a competitive operation Project information Coal Plant – Modules ¹ Original Capex approved US$ 2.068 billion plus US$ 0.45 billion rolling stock ² Original Capex approved US$ 4.444 billion less US$ 0.45 billion of rolling stock allocated to the mine capex Physical Progress: 97% Commissioning in Dec/15 Approved Capex: US$ 2.518¹ billion Executed Capex: US$ 2.050 billion Port – Shiploaders 01 and 02 Physical Progress at Nacala Corridor: 96% Railway already transporting 150 kt per month First shipment at Nacala port in Nov/15 Approved Capex: US$ 3.995² billion Executed Capex: US$ 3.513 billion As of October 2015
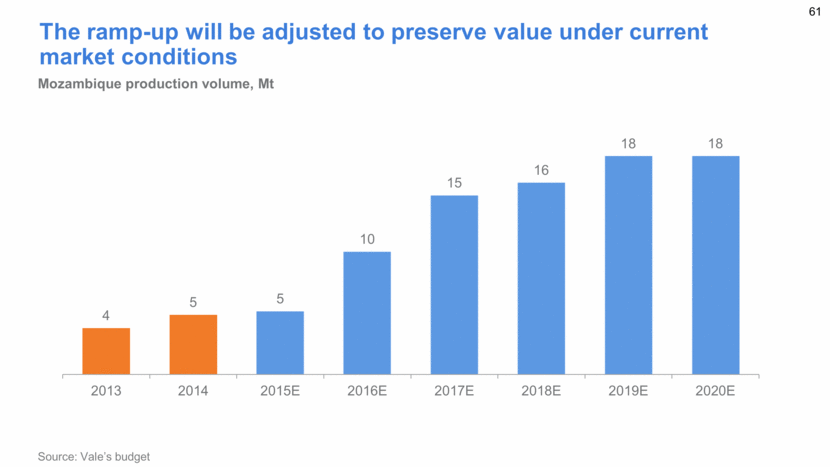
The ramp-up will be adjusted to preserve value under current market conditions Mozambique production volume, Mt Source: Vale’s budget 4 5 5 10 15 16 18 18 2013 2014 2015E 2016E 2017E 2018E 2019E 2020E
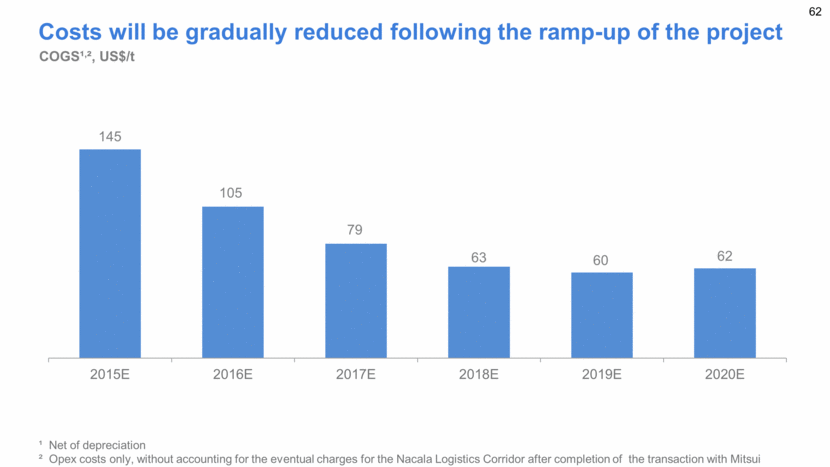
Costs will be gradually reduced following the ramp-up of the project COGS¹,², US$/t ¹ Net of depreciation ² Opex costs only, without accounting for the eventual charges for the Nacala Logistics Corridor after completion of the transaction with Mitsui 145 105 79 63 60 62 2015E 2016E 2017E 2018E 2019E 2020E
Luciano Siani Pires Chief Financial Officer
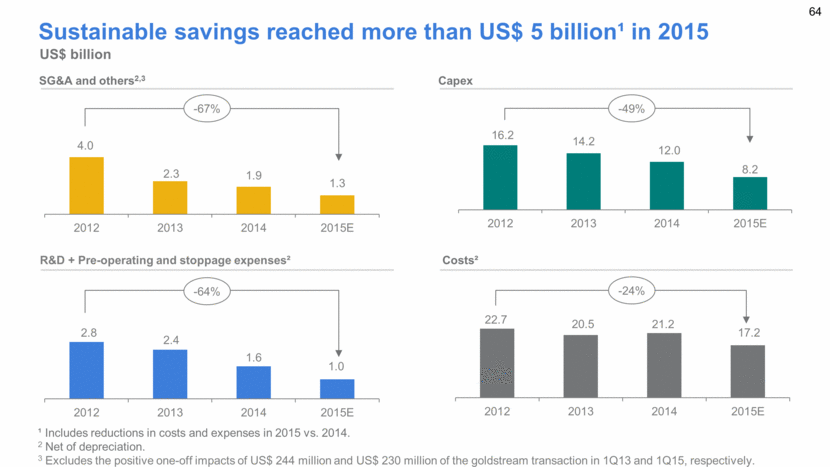
Sustainable savings reached more than US$ 5 billion¹ in 2015 US$ billion SG&A and others2,3 Capex R&D + Pre-operating and stoppage expenses² Costs² ¹ Includes reductions in costs and expenses in 2015 vs. 2014. 2 Net of depreciation. 3 Excludes the positive one-off impacts of US$ 244 million and US$ 230 million of the goldstream transaction in 1Q13 and 1Q15, respectively. -67% -49% -24% -64% 4.0 2.3 1.9 1.3 2012 2013 2014 2015E 16.2 14.2 12.0 8.2 2012 2013 2014 2015E 2.8 2.4 1.6 1.0 2012 2013 2014 2015E 22.7 20.5 21.2 17.2 2012 2013 2014 2015E
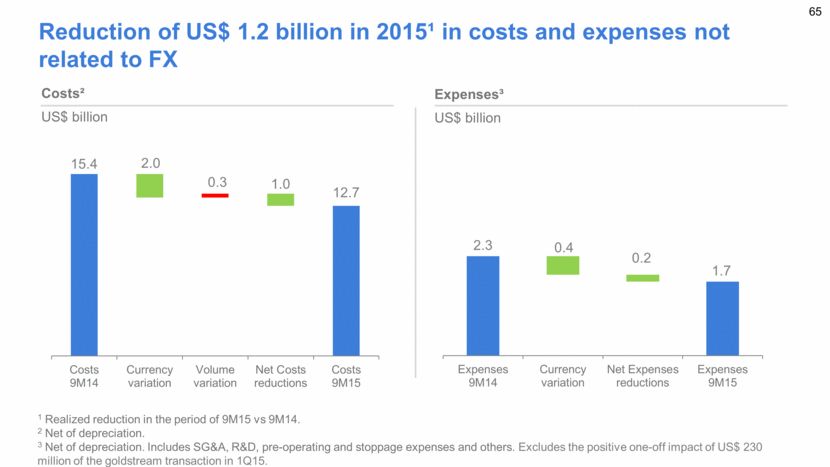
Reduction of US$ 1.2 billion in 2015¹ in costs and expenses not related to FX Costs² US$ billion 1 Realized reduction in the period of 9M15 vs 9M14. 2 Net of depreciation. 3 Net of depreciation. Includes SG&A, R&D, pre-operating and stoppage expenses and others. Excludes the positive one-off impact of US$ 230 million of the goldstream transaction in 1Q15. Expenses³ US$ billion 2.3 0.4 0.2 1.7 Expenses 9M14 Currency variation Net Expenses reductions Expenses 9M15 15.4 2.0 0.3 1.0 12.7 Costs 9M14 Currency variation Volume variation Net Costs reductions Costs 9M15
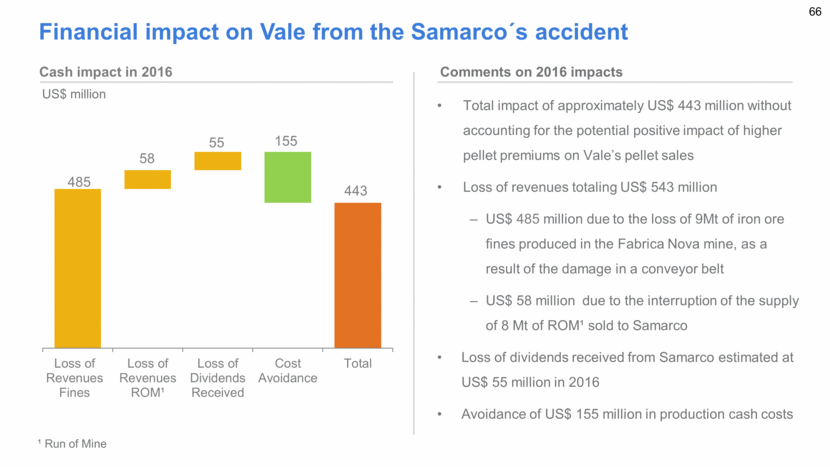
Financial impact on Vale from the Samarco´s accident Comments on 2016 impacts Cash impact in 2016 US$ million Total impact of approximately US$ 443 million without accounting for the potential positive impact of higher pellet premiums on Vale’s pellet sales Loss of revenues totaling US$ 543 million US$ 485 million due to the loss of 9Mt of iron ore fines produced in the Fabrica Nova mine, as a result of the damage in a conveyor belt US$ 58 million due to the interruption of the supply of 8 Mt of ROM¹ sold to Samarco Loss of dividends received from Samarco estimated at US$ 55 million in 2016 Avoidance of US$ 155 million in production cash costs ¹ Run of Mine 485 58 55 155 443 Loss of Revenues Fines Loss of Revenues ROM¹ Loss of Dividends Received Cost Avoidance Total
Vale’s growth investment cycle is almost over Main capital projects 2015E 2016E 2017E Iron ore S11D 2.8 2.3 1.5 Itabiritos Projects¹ 0.5 0.1 - CSP - 0.2 0.1 Coal Moatize II / Nacala 1.3 0.3 - Main replacement projects Phosphate ROM replacement - 0.1 - Voisey’s Bay - 0.1 0.3 Copper Cliff - - 0.2 Total 4.6 3.1 2.1 ¹ Includes Cauê Itabiritos, Vargem Grande Itabiritos and Conceição Itabiritos II By 2017, the only significant ongoing investment will be the logistics sections of S11D US$ billion, @ 3.80 BRL/USD

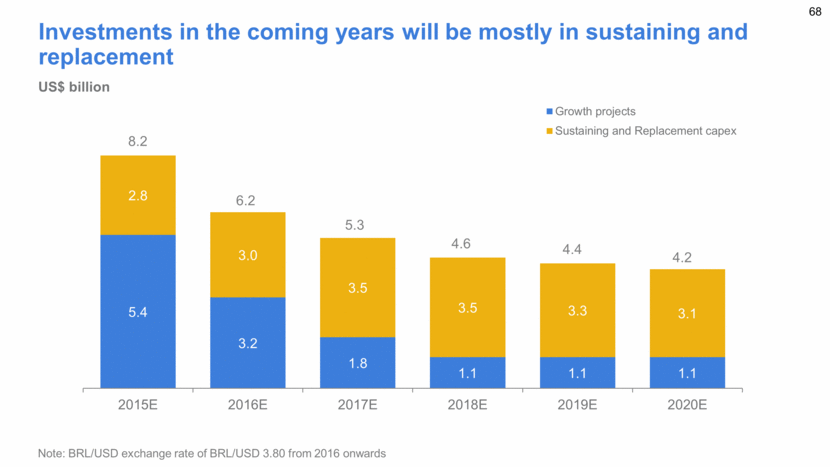
Investments in the coming years will be mostly in sustaining and replacement US$ billion Note: BRL/USD exchange rate of BRL/USD 3.80 from 2016 onwards 5.4 3.2 1.8 1.1 1.1 1.1 2.8 3.0 3.5 3.5 3.3 3.1 8.2 6.2 5.3 4.6 4.4 4.2 2015E 2016E 2017E 2018E 2019E 2020E Growth projects Sustaining and Replacement capex
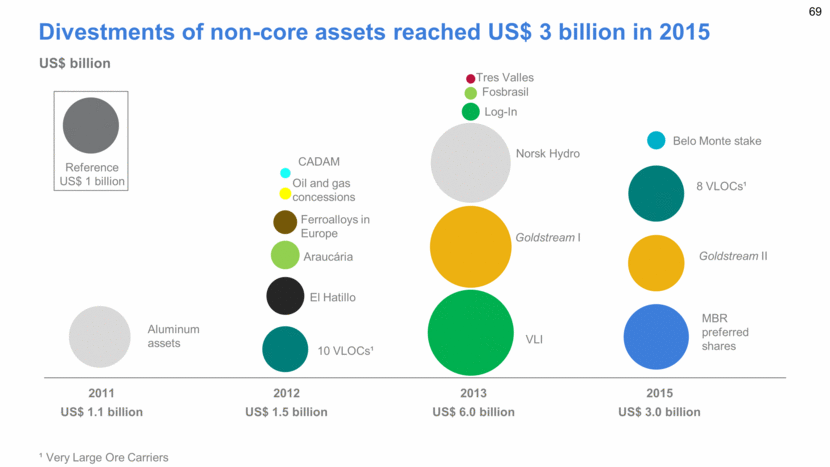
US$ billion Divestments of non-core assets reached US$ 3 billion in 2015 2011 US$ 1.1 billion 10 VLOCs¹ El Hatillo Araucária Ferroalloys in Europe Oil and gas concessions CADAM Goldstream I Goldstream II VLI Log-In Fosbrasil Tres Valles Belo Monte stake Aluminum assets Norsk Hydro 2012 US$ 1.5 billion 2013 US$ 6.0 billion 2015 US$ 3.0 billion 8 VLOCs¹ MBR preferred shares ¹ Very Large Ore Carriers Reference US$ 1 billion
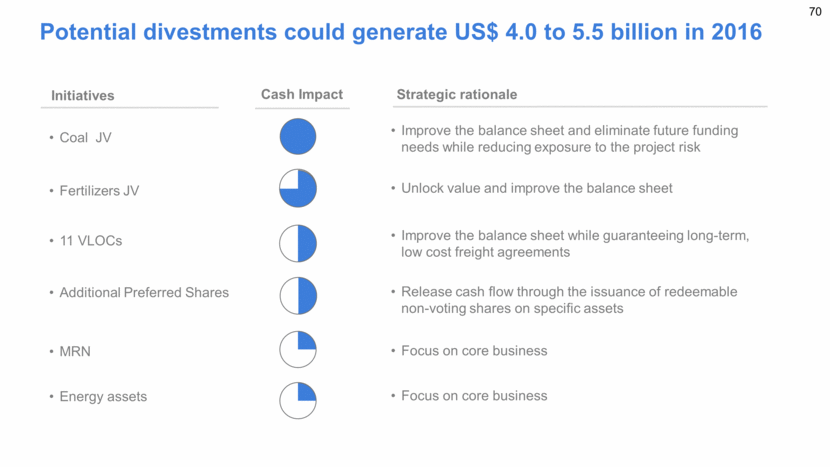
Cash Impact Potential divestments could generate US$ 4.0 to 5.5 billion in 2016 Strategic rationale Initiatives 11 VLOCs MRN Improve the balance sheet while guaranteeing long-term, low cost freight agreements Focus on core business Fertilizers JV Unlock value and improve the balance sheet Additional Preferred Shares Release cash flow through the issuance of redeemable non-voting shares on specific assets Coal JV Improve the balance sheet and eliminate future funding needs while reducing exposure to the project risk Energy assets Focus on core business
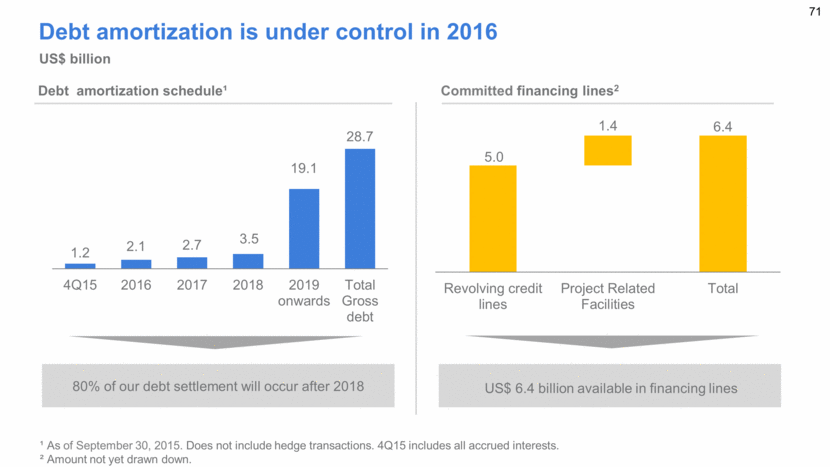
Committed financing lines2 US$ 6.4 billion available in financing lines Debt amortization schedule¹ 80% of our debt settlement will occur after 2018 Debt amortization is under control in 2016 ¹ As of September 30, 2015. Does not include hedge transactions. 4Q15 includes all accrued interests. ² Amount not yet drawn down. US$ billion 5.0 1.4 6.4 Revolving credit lines Project Related Facilities Total 1.2 2.1 2.7 3.5 19.1 28.7 4Q15 2016 2017 2018 2019 onwards Total Gross debt
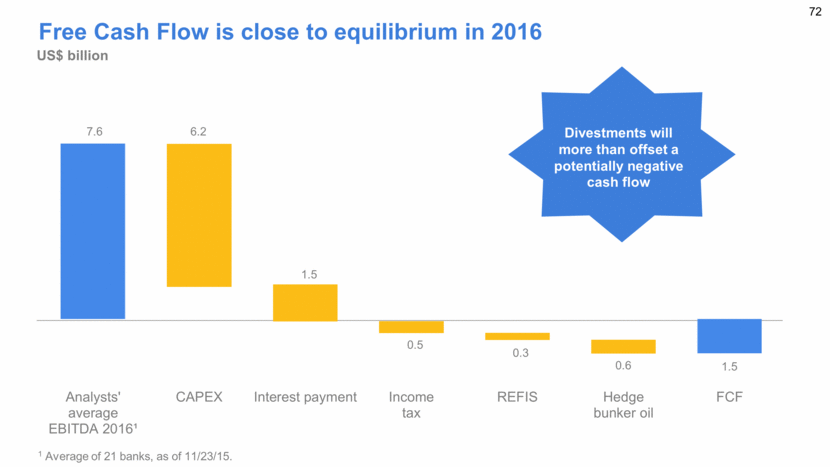
Free Cash Flow is close to equilibrium in 2016 US$ billion 1 Average of 21 banks, as of 11/23/15. Divestments will more than offset a potentially negative cash flow 7.6 6.2 1.5 0.5 0.3 0.6 1.5 Analysts' average EBITDA 2016¹ CAPEX Interest payment Income tax REFIS Hedge bunker oil FCF
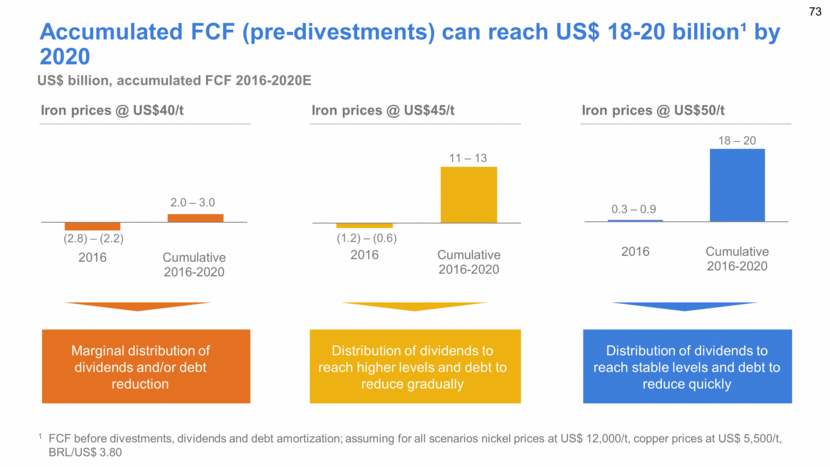
US$ billion, accumulated FCF 2016-2020E Accumulated FCF (pre-divestments) can reach US$ 18-20 billion¹ by 2020 1 FCF before divestments, dividends and debt amortization; assuming for all scenarios nickel prices at US$ 12,000/t, copper prices at US$ 5,500/t, BRL/US$ 3.80 Marginal distribution of dividends and/or debt reduction Distribution of dividends to reach higher levels and debt to reduce gradually Distribution of dividends to reach stable levels and debt to reduce quickly Iron prices @ US$40/t Iron prices @ US$45/t Iron prices @ US$50/t 2016 Cumulative 2016-2020 ( 2.8) – (2.2) 2.0 – 3.0 2016 Cumulative 2016-2020 (1.2) – (0.6) 11 – 13 2016 Cumulative 2016-2020 0.3 – 0.9 18 – 20
[LOGO]

Table of Contents
Signatures
Pursuant to the requirements of the Securities Exchange Act of 1934, the registrant has duly caused this report to be signed on its behalf by the undersigned, thereunto duly authorized.
|
|
Vale S.A. |
|
|
(Registrant) |
|
|
|
|
|
By: |
/s/ Rogerio T. Nogueira |
|
Date: December 1, 2015 |
|
Rogerio T. Nogueira |
|
|
|
Director of Investor Relations |
Vale (NYSE:VALE)
Historical Stock Chart
From Mar 2024 to Apr 2024

Vale (NYSE:VALE)
Historical Stock Chart
From Apr 2023 to Apr 2024
