Kansas City Southern Profit Rises 6.9%
April 19 2016 - 9:20AM
Dow Jones News
Kansas City Southern said its first-quarter earnings rose 6.9%
in the latest quarter as lower costs offset continued weakness in
freight volume for certain commodities and the effect of a weaker
peso.
Shares rose 4.9% to $96 in recent premarket trading as per-share
earnings, excluding certain one-time items, beat expectations.
The Kansas City, Mo., company operates railroads in the Midwest
and Mexico that run north to south, in contrast to the majority of
other railroads, which run east to west.
Chief Executive David L. Starling said in prepared remarks that
Kansas City Southern delivered solid earnings and operating results
in the latest quarter despite flooding that shut down key portions
of its U.S. rail network for more than three weeks.
In the latest quarter, carload volume fell 5%. Among the
commodity group with the biggest declines, energy segment carload
volume fell by a third, including a 22% decline in coal volume and
a 42% drop in frac sand shipments.
Over all, Kansas City Southern reported a profit of $107.8
million, or 99 cents a share, up from $100.8 million, or 91 cents a
share, a year earlier. Excluding items such as foreign exchange
rate fluctuations and 2015 lease termination costs, per-share
adjusted earnings were unchanged at $1.03. Revenue decreased 6.7%
to $562.7 million. Excluding currency fluctuations and U.S. fuel
price effects, revenue declined 1%.
Analysts polled by Thomson Reuters expected per-share profit of
97 cents and revenue of $566 million.
Operating expenses fell 12% to $375 million.
CSX Corp. last week reported its first-quarter revenue fell 14%
as the volume of coal shipments fell 31%. Union Pacific Corp. and
Norfolk Southern Corp. are set to report their earnings on
Thursday.
Write to Tess Stynes at tess.stynes@wsj.com
(END) Dow Jones Newswires
April 19, 2016 09:05 ET (13:05 GMT)
Copyright (c) 2016 Dow Jones & Company, Inc.
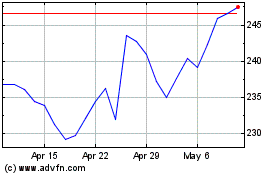
Union Pacific (NYSE:UNP)
Historical Stock Chart
From Mar 2024 to Apr 2024

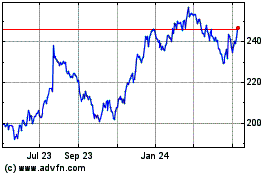
Union Pacific (NYSE:UNP)
Historical Stock Chart
From Apr 2023 to Apr 2024
