SECURITIES AND EXCHANGE COMMISSION
Washington, D.C. 20549
FORM 6-K
Report of Foreign Private Issuer
Pursuant to Rule 13a-16 or 15d-16 of the
Securities Exchange Act of 1934
For the month of February, 2016
Commission File Number 001-14491
TIM PARTICIPAÇÕES S.A.
(Exact name of registrant as specified in its charter)
TIM PARTICIPAÇÕES S.A.
(Translation of Registrant's name into English)
Av. das Américas, 3434, Bloco 1, 7º andar – Parte
22640-102 Rio de Janeiro, RJ, Brazil
(Address of principal executive office)
Indicate by check mark whether the registrant files or will file annual reports under cover Form 20-F or Form 40-F.
Form 20-F ___X___ Form 40-F _______
Indicate by check mark whether the registrant by furnishing the information contained in this Form is also thereby furnishing the information to the Commission pursuant to Rule 12g3-2(b) under the Securities Exchange Act of 1934.
Yes _______ No ___X____
![[tsurelease4q15001.jpg]](http://www.sec.gov/Archives/edgar/data/1066116/000129618216000069/tsurelease4q15001.jpg)
TIM PARTICIPAÇÕES S.A. Announces its Consolidated Results for the Fourth Quarter and Full Year of 2015
·
Confirming #1 position in 4G coverage: 411 cities, up from 45 in 2014
·
Network FAST evolution: 59% of urban population already covered with 4G. Fiber network reached more than 70,000 km with high capacity backhaul transporting 70% of total data traffic
·
4G users reached over 7 million lines, or near 11% of total subscribers
·
Smartphones penetration in our base reached 68%, well above the 49% in 2014
·
Data Services now represent 38% of mobile serv. net revenues (+7pp from 2014)
·
Business Generated Revenues (excluding incoming), stood flat in 2015 at R$13Bln
·
Fixed net revenues grew 14% in 2015
·
Efficiency plan supported EBITDA margin expansion to 31% in 2015 (vs. 28% in 2014)
·
Investments (Capex) totaled R$4.7Bln in 2015

Conference Call in English:
Conference Call in Portuguese:
Feb 5th, 2016, at:
Feb 5th, 2016, at:
11:00 AM Brasília time
09:00 Brasília time
08:00 AM US EST
06:00 AM US EST
Tel.: +1 888 700-0802 (USA)
Tel.: +55 11 3193-1001 or +55 11 2820-4001 (Brazil)
+55 11 3193-1001 or +55 11 2820-4001 (Brazil)
Code: TIM
+1 786 924-6977 (other countries)
Code: TIM
Message from CEO
Dear Shareholders, Analysts and Stakeholders,
The year of 2015 was marked by significant challenges, both for the country, with a progressively deteriorating macroeconomic environment throughout the year and impacts to growth, FX rate and inflation, and for the sector and company, which saw the total mobile user base decline for the first time after years of continued growth, with the acceleration of the substitution of voice by data usage and messaging applications, leading to the beginning of a strong decline in the use of multiple SIM cards and the reduction of the so called “community effect” on prepaid users.
Facing this “perfect storm” scenario, we maintained our focus on the execution of our strategic plan and its mid/long-term goals, in particular with an intense infrastructure investment, but also acted rapidly to reposition our portfolio in face of the sector’s structural changes, and at the same time intensified further our efficiency actions, which helped protect our financial results and expand our operating margin even in a year of reduction in revenues and, slightly less so, in EBITDA.
The Year of Infrastructure
In spite of the short-term challenges, we maintained our vision about the strategic importance of developing a robust infrastructure for data growth, centered in particular on the 4G technology, which allows for better quality of service and more efficient network costs. And with this vision we got to the mark of R$4.7 billion invested during last year, not only achieving, but surpassing our infrastructure growth objectives during 2015, even amidst a scenario of significant FX depreciation of the local currency. These investments allowed us to reach, by year-end, the milestone of 411 cities covered with 4G, or 59% of the country’s urban population, achieving the undisputed leadership in 4G coverage in Brazil, both by number of cities served and % of population covered. In addition to this, we have added yet another 500 cities to our 3G coverage, and reached the mark of over 70.000 km of own optical fiber, which will continue to allow the fast growth of our high capacity data infrastructure – key for a successful competitive positioning now and in the future.
Agile Repositioning of Portfolio and Offers
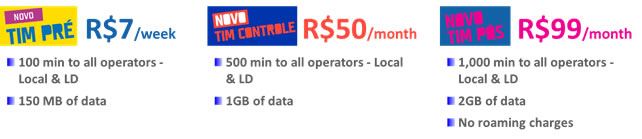
With the rapid change in the profile of telecom services consumption by Brazilian users, TIM maintained its tradition as the most innovative operator in the country, and was the first to reposition its complete portfolio for all customer segments – Prepaid, Control and Postpaid, effectively eliminating the different rates for calls to users in our own network and to users of other operators in all of our new plans, increasing the convenience of our voice and data bundles in all segments. We thus established first mover advantage at the beginning of a new industry cycle, represented by the reduction of the multiple SIM cards per user and corresponding concentration of spending in a single preferred SIM card. This bold movement will help us protect and increase the value of our prepaid customer base, where we remain leaders, as well as keep growing our base of postpaid customers, who start to have at TIM more complete voice and data offers for fair prices, providing an incentive to usage growth with its understanding and adoption.
Although still preliminary, the first results of our new offers are very encouraging from the standpoint of attractiveness to new clients and generation of new gross additions, average ARPU increase and consistency with the planned margin profiles, and helped turn the results of Mobile Number Portability balances against all other operators to become positive starting from the launch month of the new portfolio, in all customer segments.
Intensity of Efficiency Actions Compensating the Short-Term Challenges in Financial Results
Throughout 2015, the short-term pressures coming from the voice, SMS and interconnection revenue reduction made total service revenues to decline 5.8% YoY. Nevertheless, excluding the interconnection revenues (which continued on a regulatory reduction path with a new MTR reduction in 2015), we could maintain the so called customer generated or “outgoing” revenues stable, based on the significant growth of data revenues, which had an YoY growth of around 40%, with positive results both in terms of data ARPU and data user base. It is also worth highlighting the larger reduction in total net revenues was a result of the direct impact of our change in handset strategy, reducing their overall sales volumes (without any significant impact to operating margin) to focus on value customers.
Notwithstanding the reduction on mobile service revenues, the intensification of our efficiency actions announced by the second quarter last year allowed for a limited impact to the EBITDA generated by the company, which declined by 2.6% YoY even with a much larger revenue decline. Based on our efficiency plan, very good results were achieved in the containment of operating expenses in virtually all areas of the company, elevating our operating EBITDA margin to 31.5% in 2015, an all-time high annual result thus far and a sector benchmark in Brazil. It is important to emphasize the continued solidity of our balance sheet, which presents a Net Debt / EBITDA ratio of only 0,3x, one of the lowest in the industry, allowing for significant financial flexibility. Also worth mentioning that the 2015 reported results, when augmented by the proceeds of our tower sale process, present numbers that are significantly more positive than the organic results highlighted above.
Conclusion and Perspectives
In conclusion, despite all of the challenges faced during 2015, the company was able to demonstrate its commitment with a mid/long-term positioning and structural actions, while at the same time reacting very rapidly to the main market transition challenges and subsequent need to protect its financial results in a scenario of short-term pressures to its revenues.
For 2016, we will emphasize the focus on three main pillars, with the maintenance of infrastructure investments and 4G leadership, development and positive results of our new portfolio and offers announced late 2015 and continuation of the intensity of efficiency actions that allow us to keep expanding our operating margin. We expect those three pillars, when combined with the growing usage of data services and the evolution of our positioning in quality/offers/user experience, will allow us to finish 2016 in an upward trajectory of continuous result improvements.
Very shortly, we will announce our 2016-2018 industrial plan details and I am confident that, once again, TIM’s outstanding team of professionals will keep making a difference in face of all of the upcoming challenges.
Rodrigo Abreu
CEO
FINANCIAL PERFORMANCE
OPERATING REVENUES

The 2015 year brought notable impacts on all business fronts after major changes in usage patterns (voice to data shift), tough macroeconomic conditions and still the impact of mobile-termination rate cuts.
Gross revenues breakdown and other highlights are presented as follows:
Usage and monthly fee gross revenues ended 2015 down 11% YoY, impacted by a continuing migration from voice towards data usage. Minutes of Use (MOU) came at 119 minutes in 2015 (-12% YoY). However, on a sequential basis in 4Q15, MOU showed a slight rebound to 120 versus 119 in 3Q15, thanks to the new offer launch and its off-net allowance. This recovery wasn’t sufficient to revert the negative trend in revenues for the fourth quarter (-13.1% YoY in Usage and Monthly fee revenues).
+17%
VAS Revenues (YoY)
Value Added Services (VAS) gross revenues rose 17% YoY in 2015 as innovative revenues increased its relevance in the business. Although short-message (SMS) business reduced again and continues to impact total Value-Added-Service line, Innovative Revenues rose 35% YoY. Altogether, VAS revenues came to 38% of mobile net service revenues and represented a positive impact for the company's margin. In 4Q15 Innovative Revenues grew 22% as the comparative base becomes more challenging.

Long Distance gross revenues were strongly exposed to the switch from voice to data usage in 2015. Such process is speeding up the commoditization of LD and impacted its performance during the year. The new offers launched in November, which included off-net calls within Brazil at the same price of on-net calls, may reduce the pace of this process.
Interconnection gross revenues dropped by 40% YoY in 2015 due to a combination of the sharp cut on MTR price and the change in the dynamic of overall voice traffic. SMS messaging reduction was also an impact in this line. In all, interconnection revenues declined by over R$1Bi in 2015, being one of the main causes for mobile service revenues to reduce in the period.
Other Mobile Revenues increased by 12.5% YoY in 2015, mainly driven by the growth of revenues related to infrastructure sharing, and partially offset by the decline in tower leasing revenues as a consequence of the sale-leaseback transaction. In the fourth quarter, we saw a reversion on the trend due to full impact of tower deal closings.
Fixed business gross revenues had a solid rebound in 2015 and rose more than 11% YoY, after consecutive losses in past years. The segment had its better quarter of the year in 4Q15, proving how attractive the ultra-broadband business is and the rewards of a successful restructuring phase of TIM’s corporate portfolio.

A tougher macroeconomic environment affected the whole retail segment in Brazil and together with the FX appreciation were the major barriers to handset sales in 2015. Product revenues were down by 41% in the period. In 4Q15, we saw a further decline as the Company is also making adjustments to its handset strategy as smartphone penetration reaches ~70%.
In all, product unit sale has reduced by 61% YoY, in 2015, to 4.7 million units while average price has increased by 50% YoY in the same period.
Total Net Revenues were down by 12.1% in 2015 while Net Services Revenues were down by 5.8%. In Net Revenues is important to highlight that "Business Generated" stood flat in 2015, even with the faster transition from voice to data and the macroeconomic headwinds. This indicator, that best represents the fundamentals and the core business of TIM, was mostly supported by data revenues growth. In 4Q15 top line and service revenues deteriorated further driven by handset performance and interconnection revenues, respectively.
+35%
Innovative Revenues
(YoY)
Innovative Mobile Net Revenues (VAS revenues excluding SMS revenues) rose 35% in 2015 driven by the Company’s strategy to switch clients to 4G technology and the increase of smartphone penetration, stimulating data usage. BOU (bytes of use) rose ~30% in comparison to 2014 while smartphone penetration reached 67.6% of the customer base versus 49.5% in 4Q14.
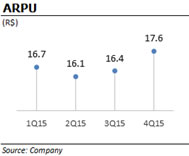
ARPU (average revenue per user) reached R$17 in 2015, down 5.6% YoY, largely impacted by MTR cut and the reduction in voice usage. As for 4Q15, ARPU came at R$18 (-1.8% YoY) showing an early sign of recovery. As for ARPU from VAS, it posted a significant increase of ~18% YoY in 4Q and full year 2015. It was responsible for sustaining innovative revenues growth during the year.
As a consequence of consecutive MTR cuts combined with migration from voice to data, the MTR incidence on net service revenues has been decreasing significantly every quarter, reaching its lowest level in 4Q15 at 8.0%.
OPERATING COSTS AND EXPENSES

Recurring operating expenses analysis for 2015 and 4Q15 are presented as follows:
Personnel expenses rose 8.4% YoY in 2015, as result of the stabilization of our headcount, which has been increasing over the last years due to network expansion and insourcing program together with owned stores increase. In 2015, our workforce increased by 1.6% YoY reaching 13,062 people.
Selling & Marketing expenses decreased by 6.1% YoY in 2015 due to (i) significant decrease in advertising, despite the launch of a new portfolio in November; (ii) robust reduction in commissioning expenses and; (iii) important decrease in FISTEL taxes (-17%YoY) as a result of strong disconnection in low ARPU prepaid users. In the 4Q15, FISTEL savings accelerated further as the Company became even stricter in the disconnections.
-15%
Leased lines costs (YoY)
Network & Interconnection costs were down 11.4% YoY in 2015, heavily impacted by reductions in (i) MTR prices, (ii) voice/SMS off-net traffic and (iii) leased lines costs, but partially compensated by higher electricity costs (+44% YoY) and sites land rental expenses as a consequence of network coverage acceleration. In the fourth quarter, the highlight was, once more, the robust performance in leased lines costs (-15% YoY), helping the line to show savings of R$131 million in the period.
General & Administrative expenses (G&A) anual decrease of 8.8% was mainly driven by the Efficiency Plan started in the 2Q15. In 4Q15, however, G&A was up by 7.9% YoY due to an increase in third party advisory services expenses.
Cost of Goods Sold sharply decreased by 44.4% versus the same period of 2014, due to a reduction of 61% in the number of handsets sold. A tougher macroeconomic environment which affected the whole retail segment and a strong Real depreciation were the main drivers for this performance. In 4Q15, this trend accelerated even further causing Cost of Goods Sold to decrease by 85.2% YoY.
Bad Debt expenses decreased by 7.3% YoY in 2015, due to a better performance in the fixed segment, following this business turnaround. In 4Q15, the sharp increase of 37.1% YoY in bad debt is among other factors due to higher provisions related to disputes on MTR reconciliation among other telcos. As a percentage of gross revenues, Bad Debt reached 0.89% in 2015, virtually stable when compared to 2014 (0.86%) despite an even more challenging macroeconomic environment.
Other operational expenses remained stable in 2015 when compared to last year, while in 4Q15 it was up by 4.0% YoY mainly due to higher costs on contingencies.
Subscriber Acquisition Costs (where SAC = subsidy + commissioning + total advertising expenses) came at R$30.5 per gross add in 2015, an increase of 11.3% YoY due to a greater focus on high value customers acquisition.
SAC/ARPU ratio (indicating the payback per customer) reached 1.9x in 2015, flat when compared to 2014, despite the 8.6% YoY increase in postpaid customers.
FROM EBITDA TO NET INCOME

EBITDA
Recurring EBITDA (ex-towers sale) dropped 2.6% in 2015 and -4.5% in 4Q15 YoY, mainly due to: (i) a tougher macroeconomic environment, (ii) MTR cut impact and (iii) voice services migration to data.
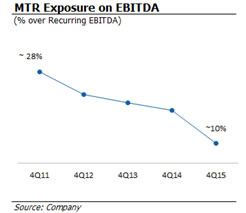
Following a similar trajectory as revenues exposure, MTR incidence on recurring EBITDA has been falling significantly during the years, reaching its lowest level at ~10% in 4Q15.
Reported EBITDA yearly increase is mainly due to the three tranches of towers sale occurred in 2nd, 3rd and 4th quarters with a total net effect of R$1,211 million (please refer to dedicated section below for further details). In 4Q15, the 3rd tranche did not offset the declining trend mentioned above.
D&A / EBIT
In 2015 and in 4Q15, Depreciation and Amortization increased due to higher network equipment acquisition following our Capex deployment intensification. In 4Q15, TIM achieved leadership in 4G coverage both in terms of urban population (59% vs. 36% in 2014) as well as in cities covered (411 vs. 45 in 2014). Also, total kilometers of fiber has surpassed the 70,000 mark.
As a consequence, EBIT declined in 2015 and also in the 4th quarter, following the increase in depreciation and amortization explained above.
NET FINANCIAL RESULT
In 2015, Net financial result improved versus 2014 mainly due to a better financial income performance, with higher investment yield that more than offset the financial cost increase. Lease back after the towers sale also impacted the financial expenses in the period.
As for the 4Q15, net financial result was mainly driven by a positive impact of mark-to-market spot, (reverting part of last quarter negative effect), on top of the above mentioned better cash yield performance.
INCOME AND SOCIAL CONTRIBUTION TAXES
In 2015, Recurring Income and Social Contribution decreased when compared to 2014, mainly due to a reduction in the tax base. Effective tax rate reached 30.3% in 2015, a small increase compared to 29.5% in 2014.
In 4Q15, recurring income and social contribution also decreased but in a smaller amount due to a higher tax base compared to 4Q14, while effective tax rate fell to 28.4% in 4Q15 from 28.7% in 4Q14.
NET INCOME
In 2015, Recurring Net Income decreased by 20% compared to 2014. EPS (Earnings per Share) reached R$0.51 in 2015 (vs. R$0.64 in 2014), driven by EBIT performance. In 4Q15, Recurring Net Income reduced the pace of decline in the yearly comparison (-0.8%) mainly due to a better Net Financial Results, while EPS stood flat at R$0.19 when compared to 4Q14.
Reported Net Income in 2015 and 4Q15 increases were largely impacted by the towers sale, thus Reported EPS (Earnings per Share) reached R$0.86 in 2015 compared to R$0.64 in 2014.
CAPEX
R$4.7
Bln Invested
In 2015, Recurring1 Capex amounted to R$4,658 million, an increase of 18.6% when compared to Recurring Capex of 2014, following our Industrial Plan’s investment increase. This capex intensity, which stood near 27% of total net revenues, has been crucial for the Company to improve infrastructure and quality of services. In 2015, it is already possible to see encouraging results from the Capex cycle, with for example our leadership position in 4G coverage, fiber roll-out and spectrum refarming.
It’s worth highlighting that more than 92% of the total Capex was dedicated to infrastructure, mainly related to 3G and 4G technologies.

DEBT, CASH AND FREE CASH FLOW
Gross Debt reached R$8,432 million by the end of 2015, including the leasing recognition in a total value of R$1,245 million following the leaseback of the towers sold (3 tranches) and it compares to R$6,507 million in 2014. Excluding towers sales effect, gross debt would have increased by almost 10%.
Company's debt is concentrated in long-term contracts (78% of the total), composed mainly by financing from BNDES (Brazilian Economic and Social Development Bank) and EIB (European Investment Bank), as well as borrowings from other top local and international financial institutions.
Approximately 35% of total debt is denominated in foreign currency (USD), and it is 100% hedged in local currency. In 2015, average cost of debt was 11.73% compared to 9.70% in 2014, while in 4Q15 average cost of debt was 12.23% vs. 9.98% in 4Q14. Nevertheless, the increase in cost of debt was more than offset by a higher cash yield.
Cash position totaled R$6,700 million by the end of 2015, an increase vs. R$5,233 in 2014. Average cash yield reached 13.50% in 2015 compared to 10.88% in 2014 following an average cash yield of 14.33% in 4Q15 (vs. 11.25% in 4Q14).
The proceeds from the towers sale increased cash position in R$2,498 million and other movements that affect cash and cash equivalents in 2015 are demonstrated as follow:

The Company has an investment fund in foreign exchange of R$599.4 million in order to follow the variations of the US Dollar, basically formed by highly liquid public securities. The investment is intended to reduce foreign exchange risk on payments made to suppliers in foreign currency.
Net Debt/EBITDA ratio reached 0.3x in 2015 compared to 0.2x in 2014. Due to the above mentioned payments, net debt increased to R$1,733 million by the end of 2015, up from R$1,274 million in 2014.
Recurring Operating Free Cash Flow came at R$141 million in 2015, (vs. -R$45 million in 2014), despite being adversely impacted by an increase in Capex of about +R$730 million from 2014. Fourth quarter contributed to reverse OFCF into positive, reaching R$920 million, vs. -R$320 million in 4Q14.
Recurring Net Cash Flow in 2015 totaled -R$1,235 million compared to -R$1,695 million in the same period of last year. In the quarter, Recurring Net Cash Flow totaled R$829 million, vs. -R$483 million in 4Q14.
TOWERS SALE IMPACTS
In 4Q15, TIM concluded the third closing under the Tower Sale agreement signed in November 2014 with American Tower do Brasil (ATC) that comprised overall sale of 6,481 towers for ~R$3 billion cash.
·
First closing: On April 29, 2015, TIM transferred 4,176 towers to ATC and received ~R$1.9 billion.
·
Second closing: On September 30, 2015 TIM transferred 1,125 towers to ATC and received ~R$517 million.
·
Third closing: On December 16, 2015 TIM transferred 182 towers to ATC and received ~R$84 million.
The Master lease agreement (MLA) defines the leaseback of the transferred towers for a 20 years period. According to IAS17, this transaction should be registered as (1) sale and (2) leaseback and following its requirements, the leaseback registered as financial leasing.
Please find below the Financial Statements impacts conciliation and the related notes for further details concerning all three closings:

QUALITY AND NETWORK
QUALITY DEVELOPMENTS: Increasing CAPEX starts to pay off
Regarding Anatel’s network quality requirements, TIM kept its solid performance meeting all Agency’s targets. From April to October/15 (last data available), the Company has met all Anatel’s targets for both Voice and Data services (3G/4G) in every single state. This achievement is a result of strong commitment to quality and our goal to accelerate infrastructure development, especially to support data expansion and deliver a better usage experience. Network quality KPIs described below are based on the number of states that have met targets as disclosed by Anatel.

Instant Speed & Average Speed: Regarding Anatel’s metrics of instant speed (SMP10) and average speed (SMP11) it’s important to highlight the positive trend in both indicators in the last 12 months. In September/15, however TIM faced technical issues in relevant areas such as Rio de Janeiro and São Paulo which led to adjustments on underperforming network elements. Although this issue led to a punctual decrease in both SMP 10 and 11, latest available data confirms not only it has been completely solved, but proves the significant progress of the KPIs when compared to the 2014. Increasing CAPEX along with effective actions in target cities have been essential to achieve these results, improving customer experience in the whole country.

Another indication that planned CAPEX increase is helping to bring solid improvements in terms of quality is translated by a good set of results in Speed Tests (measured by Ookla2). Network investments along with the Mobile Broadband Project (MBB) has been enabling strong performances in Throughput and Latency metrics, with continuous improvement in downlink, while progress in uplink has allowed TIM to become #2 player in this metric. As for latency, despite being slightly above market average this quarter the downward trend remains positive.

NETWORK EVOLUTION: Additional 16 thousand km of Fiber and 4G coverage leadership with strong implementation during 2015
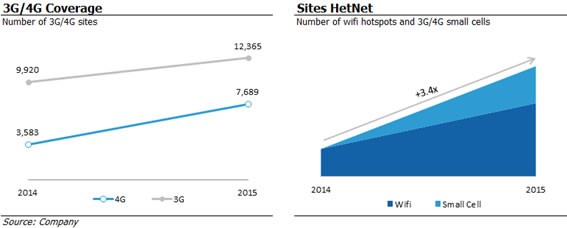
2015 was a year of strong evolution in terms of network implementation highlighting how coverage and capacity continue to be the infrastructure central point. To maintain the solid expansion path in 2015 TIM has been dedicating great financial and operational effort with more than 92% of total capex committed to infrastructure. In 2015, 16 thousand km of optical fiber were implemented (+30% YoY), along with other network projects roll out, such as sites densification, Wi-Fi and small cell expansion, backhaul development, cell-site fine tuning and others.
TIM Wi-Fi project accelerated in the forth quarter, with 103 new hotspots and totaling more than 1.9 thousand in the entire country. When compared to t2014, number of hotspots increased by 39% or 536 new hotspots.
In 2015, Mobile BroadBand Project (MBB) added 69 new cities to the project’s roll out. Besides the new cities, the Company also focused its efforts on coverage densification of 58 cities that were already included in 2014 and are the pillar of the mobile VAS revenue growth. In 4Q15, the MBB project reached 194 cities, covering approximately 70% of TIM’s entire data traffic.
The network quality results in 2015 prove that the average throughput gain for the cities that have completed the MBB is outstanding, showing the efficiency approach used by the project, tackling Access (LTE/HSPA+ with dual carrier), Transport (backhaul and backbone using FTTS and high capacity microwave links) and IP-Core (caching, peering and transit).
In 4G, TIM kept its leadership in terms of cities covered reaching 411 cities in the end of 2015 which represents 59% of urban population in the country. This remarkable result was accomplished through spectrum refarming. The project consists in coverage optimization and the amplification in the number of locations with 4G technology, using the 1,800MHz band and reorganizing the frequency usage according to the spectrum availability.
As for the 3G, TIM expanded its coverage to 503 new cities in 2015, reaching 1,839 cities or 82.0% of urban population. GSM coverage stood at almost 95% of urban population.
OPERATIONAL, MARKETING AND CARING PERFORMANCE
MOBILE MARKET
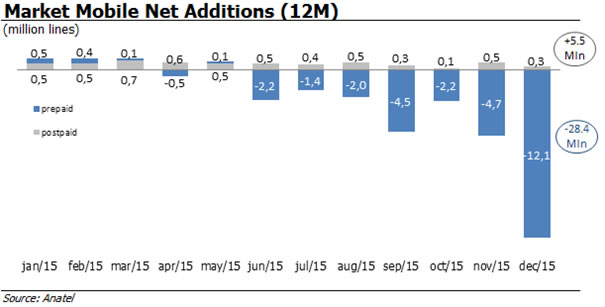
2015 was marked by a significant acceleration in the consolidation process of multiple SIM cards driven by macroeconomic pressures, high penetration of mobile service and fast substitution of voice by data usage, resulting in an important reduction in the community effect and an overall reduction in the number of total users due to the disconnections of the prepaid base. All players presented negative net adds in the prepaid segment. This movement was intensified in the fourth quarter, as perceived in Anatel’s numbers, leading to the first year with overall customer base reduction.
After the launch of new flat-rate plans in the fourth quarter of 2015, overall market Mobile Number Portability (MNP), an important indicator to start tracking, grew 12% compared to 3Q15, achieving 749 thousand in the quarter and 2.6 million in 2015 (according to Teleco web site).
TIM’s PERFORMANCE
TIM’s subscriber base reached 66.2 million lines in the end of 2015, down 12.5% when compared to 2014.
In 3G technology, total customer base reached 37.5 million users, flat against 2014, following an increasing penetration of 4G devices. 4G base reached 7.1 million users by the end of 2015, an increase of 40.8% over 3Q15, or +2.1 million new users in this quarter, a supporting evidence that the Company’s approach on 4G is paying off.
Overall smartphone penetration reached 68% of the customer base, an outstanding growth compared to 49% in the end of 2014, proving the success of the strategy of equipping its customers in order to stimulate data services penetration among its users. Unique data users reached 31.8 million lines or 48% of total base by the end of 2015.
48%
customer base already using data services
TIM’s net additions totaled -9.5 million lines in 2015 (vs. +2.3 million in 2014), as a result of lower gross additions (34 million lines and down 12.5% vs. 2014) and much higher disconnections (43.7 million lines in the period and up 18.6% YoY). Consequently churn rate in 2015 came at 59.1% and up from 49.6% in 2014.
In 4Q15, Net additions totaled -6.3 million lines (vs. 843 thousand in 4Q14), also as a result of lower gross additions (8.2 million, down 22.3% vs. 4Q14) and much higher disconnections (14.6 million lines and up 49.3% YoY). Churn rate in 4Q15 came at 20.3% and up from 13.0% in 2014. In the last two months of the year, the Company cleaned 5 million lines as a consequence of a more strict disconnection policy implemented.

Postpaid customer base reached 13.6 million users by the end of 2015, +8.6% yearly growth. During the year, TIM added 1.1 million users in the postpaid segment (vs. 223 thousand net adds in 2014). In 4Q15, TIM has disconnected 236 thousand postpaid lines, mostly in M2M, so TIM remained #2 in Postpaid lines ex-M2M in December.
In November, TIM introduced its new offer Portfolio, innovating once more and disrupting the market with a flat rate proposition, unlocking off-net usage to all segments and focusing in mobile bundles (voice+data) and recurring prepaid offers.
The new portfolio is already showing signs of success. Despite having just two months from its launch, the Company posted positive MNP figures in all segments, reverting years of negative performance. Also in postpaid, gross adds grew 46% versus the period prior to the launch, and these users have a single digit higher outgoing ARPU when compared to the overall postpaid base.

As for controle segment, after the launch, gross additions grew 43% versus the period before, while outgoing ARPU is double digit higher for these new clients versus the overall controle customer base.
The prepaid segment in 2015 ended with 52.7 million users, down 16.7% YoY, disconnecting 10.6 million lines in the year (compared to +2.1 million net adds in 2014) and 6.1 million in 4Q15 (versus 580 thousand in 4Q14).
After launching the new portfolio, recharging of prepaid users grew 2% and the outgoing ARPU of the new offer users is double digit higher when compared to the overall prepaid base.

New prepaid offer predicts a recurring payment instead of the previous “pay as you go” consumption. Starting this quarter the Company analyses its customer base following these concepts, as shown in the chart on the right.
FIXED BROADBAND MARKET
Brazilian broadband market ended 2015 with two important milestones that can point to new trends in the near future: in November the market as a whole posted net disconnections of 49 thousand customers (worst month since Dec/13) with the first contraction in market penetration since Anatel’s historical series began. This highlights the importance of ultra-broadband (speeds of more than 34Mbps) segment that grew more than 60% YoY with Live TIM standing out in Rio and São Paulo metro areas.
2015 was a remarkable year for Live TIM with a huge evolution in all business fronts: revenues, clients, market share and coverage. The company closed the year with more than 220 thousand clients (+78% YoY) and 2.1 million addressable households (+42% YoY). The strong performance was driven by the leadership in quality, recognized by numerous prizes and rankings (Anatel, Netflix, CVA Solutions, O Estado de S.Paulo newspaper). The top quality of service helped Live TIM to arrive in November as the leading operator in ultra-broadband net adds for 2015, with more than 38% share (91 thousand clients).

CORPORATE SOCIAL RESPONSIBILITY
Created to enhance resources for the democratization of science, technology and innovation in Brazil, TIM Institute continued in 2015 to expand the number of partners and beneficiaries through several initiatives, all guided by four principles: education, technology applications, inclusion and work.
In the year, TIM Institute’s 11 projects involved 240 cities, 25 states and the Federal District; three ministries, 43 departments of Education and more than 1,400 public schools; 6,300 teachers and 185,000 students. The partners network also has two agencies of the United Nations (UN), municipal and state departments, universities, federal institutions, development agencies and non-profit organizations.
One of the highlight initiatives of the year was the launch of the call for projects to support science and technology museums and centers, held in partnership with the National Council for Scientific and Technological Development (CNPq) – an agency linked to the Ministry of Science, Technology and Innovation. In total 201 projects were submitted from across the country to encourage learning about technology aimed at children aged between 4 and 10 years. TIM Institute will distribute R$2.5 million among the selected proposals.
Another strategic partnership worth noting was a technical cooperation agreement signed by TIM Institute with the Ministry of Culture to develop a solution to improve cultural initiatives management in states and municipalities across the whole country. TIM Institute then developed the Mapas Culturais which became the free software used by the Ministry of Culture to provide the database of the National System for Cultural Information and Indicators in several cities.
To know more of TIM Institute’s work go to http://en.institutotim.org.br/.
ENERGY CONSUMPTION
In line with its Environmental Policy principles, TIM considers energy consumption as one of its challenges, that evolves according to the table below.
| | | |
Energy consumption
| 2015e
| 2014
| % YoY
|
Electricity consumption in MWh
| 531,266,879(*)
| 483,933,525
| 10%
|
Fuels consumption in liters
(gasoline and diesel)
| 1,588,275(*)
| 1,670,934
| -5%
|
(*) Data subject to change - after external verification closing.
Energy efficiency is carried out through some actions such as Swap Project (replacing access equipment with more modern and efficient models) and the RAN Sharing agreement (sharing model of network infrastructure with other telecom operators). In environmental terms, the RAN Sharing agreement reduces electricity consumption and also has a positive urban impact as it implies in reducing the number of new RadioBase Stations (RBS), minimizing the inconvenience to population (EN5 indicator, GRI1 3.1).
With a significant reduction in visual impact, Biosites help harmonize with the environment and urban infrastructure. Its multifunctionality can add beyond telecommunications transmission, contributing for lighting and security through surveillance cameras. At the end of December, the project reached a total of 103 activated Biosites, a considerable increase compared with 23 activated Biosites in December 2014.
GRI Global Reporting Initiative, an international reporting standard on performance indicators, used by TIM on its Sustainability Report.
STOCK PERFORMANCE
TIMP3 ended 2015 at R$6.86, down by 41.8% in the last 12 months mostly due to the pressured macroeconomic scenario and M&A speculation, while the Bovespa Index (Ibovespa) was down 13.3% over the same period. The Company's ADRs closed 2015 at US$8.48, a decrease of 61.8% in the last 12 months (Brazilian Reais depreciated by 47% in relation to the American dollar in 2015 vs. 2014).

SUBSEQUENT EVENTS
Dividends
Management will propose to the Board of Directors the distribution of R$468.6 million of dividends, +27.6% versus R$367.3 million in 2014. The amount to be distributed is equivalent to R$0.1936 per common share and R$0.9681 per ADR (1 ON = 5 ADR). The proposal will be presented to the Board of Directors and has yet to be approved by the Company’s annual shareholders’ meeting to be held on April of 2016.
DISCLAIMER
The financial and operating consolidated information disclosed in this document, except where otherwise indicated, is presented according to IFRS (International Financial Reporting Standards) and in Brazilian Reais (R$), pursuant to Brazilian Corporate Law. All comparisons refer to the fourth quarter of 2014 (4Q14), twelve months of 2014 and third quarter of 2015 (3Q15), except when otherwise indicated.
This document may contain forward-looking statements. Such statements are not statements of historical fact and reflect the beliefs and expectations of the Company's management. The words "anticipates”, "believes”, "estimates”, "expects”, "forecasts”, "plans”, "predicts”, "projects”, "targets" and similar words are intended to identify these statements, which necessarily involve known and unknown risks and uncertainties foreseen, or not, by the Company. Therefore, the Company’s future operating results may differ from current expectations and readers of this release should not base their assumptions exclusively on the information given herein. Forward-looking statements only reflect opinions on the date on which they are made and the Company is not obliged to update them in light of new information or future developments.
INVESTOR RELATION CONTACTS
Telephones: (+55 21) 4109-3360 / 4109-4017 / 4109-3751 / 4109-3446
E-mail: ri@timbrasil.com.br
Investor Relations Website: www.tim.com.br/ir
For more information about TIM please click on this link.
Twitter: @TIM_RI
TIM IR App:

ATTACHMENTS
Attachment 1:
Balance Sheet
Attachment 2: Income Statements
Attachment 3:
Cash Flow Statements
Attachment 4:
Operational Indicators
The Complete Financial Statements, including Explanatory Notes, are available at the Company’s Investor Relations Website.
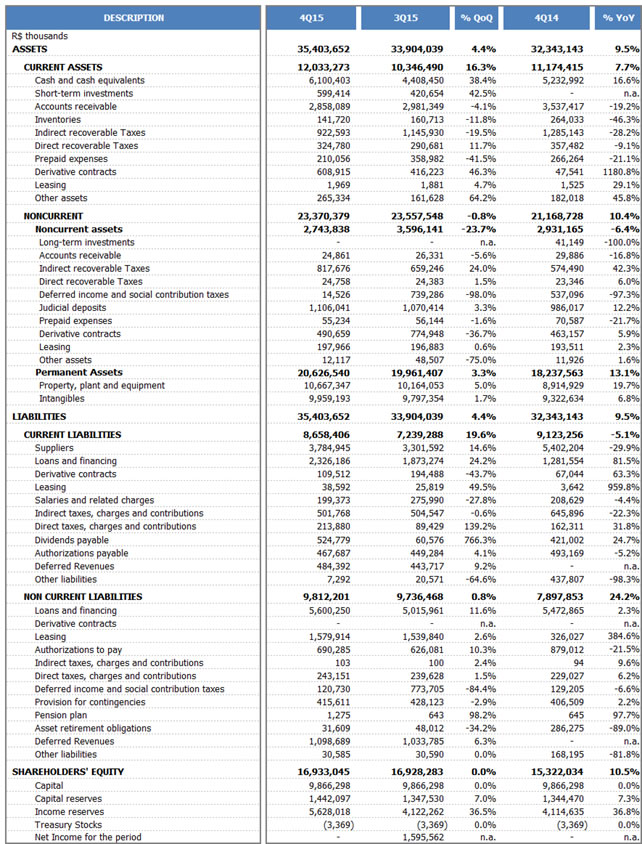
Attachment 1
TIM PARTICIPAÇÕES S.A.
Balance Sheet
(R$ Thousands)
Attachment 2
TIM PARTICIPAÇÕES S.A.
Income Statements
(R$ Thousands)

Attachment 3
TIM PARTICIPAÇÕES S.A.
Cash Flow Statements
(R$ Thousands)

Attachment 4
TIM PARTICIPAÇÕES S.A.
Operational Indicators

Footnotes
1 Reported Capex includes more 106 million Reais as consequence of monetary adjustments related to the 700 MHz frequency clean-up and from the debt generated after the dispute with Anatel in the 4G auction.
2 Generated from TIM’s analysis over Ookla Speedtest results. 4Q15 until November, last data available.
SIGNATURE
Pursuant to the requirements of the Securities Exchange Act of 1934, the registrant has duly caused this report to be signed on its behalf by the undersigned, thereunto duly authorized.
| |
TIM PARTICIPAÇÕES S.A. |
|
| |
|
|
|
| Date: February 4, 2016 |
By: |
/s/ Rogério Tostes |
|
|
|
|
|
| |
|
Name: Rogério Tostes |
|
| |
|
Title: IRO |
|
FORWARD-LOOKING STATEMENTS
This press release may contain forward-looking statements. These statements are statements that are not historical facts, and are based on management's current view and estimates offuture economic circumstances, industry conditions, company performance and financial results. The words "anticipates", "believes", "estimates", "expects", "plans" and similar expressions, as they relate to the company, are intended to identify forward-looking statements. Statements regarding the declaration or payment of dividends, the implementation of principal operating and financing strategies and capital expenditure plans, the direction of future operations and the factors or trends affecting financial condition, liquidity or results of operations are examples of forward-looking statements. Such statements reflect the current views of management and are subject to a number of risks and uncertainties. There is no guarantee that the expected events, trends or results will a ctually occur. The statements are based on many assumptions and factors, including general economic and market conditions, industry conditions, and operating factors. Any changes in such assumptions or factors could cause actual results to differ materially from current expectations.