UNITED STATES
SECURITIES AND EXCHANGE COMMISSION
Washington, D.C. 20549
_______________________________________
FORM 8-K
_______________________________________
CURRENT REPORT
Pursuant to Section 13 or 15(d) of the Securities Exchange Act of 1934
Date of Report (Date of earliest event reported) October 25, 2016
_______________________________________
SPRINT CORPORATION
(Exact name of Registrant as specified in its charter)
_______________________________________
|
| | | | |
| | | | |
Delaware | | 1-04721 | | 46-1170005 |
(State of Incorporation) | | (Commission File Number) | | (I.R.S. Employer Identification No.) |
|
| | |
| | |
6200 Sprint Parkway, Overland Park, Kansas | | 66251 |
(Address of principal executive offices) | | (Zip Code) |
Registrant’s telephone number, including area code (855) 848-3280
(Former name or former address, if changed since last report)
Check the appropriate box below if the Form 8-K filing is intended to simultaneously satisfy the filing obligation of the registrant under any of the following provisions:
|
| |
o | Written communications pursuant to Rule 425 under the Securities Act (17 CFR 230.425) |
|
| |
o | Soliciting material pursuant to Rule 14a-12 under the Exchange Act (17 CFR 240.14a-12) |
|
| |
o | Pre-commencement communications pursuant to Rule 14d-2(b) under the Exchange Act (17 CFR 240.14d-2(b)) |
|
| |
o | Pre-commencement communications pursuant to Rule 13e-4(c) under the Exchange Act (17 CFR 240.13e-4(c)) |
Item 2.02 Results of Operations and Financial Condition.
On October 25, 2016, Sprint Corporation announced its results for the second quarter ended September 30, 2016. The press release is furnished as Exhibit 99.1 and its Quarterly Investor Update is attached as Exhibit 99.2.
Item 9.01 Financial Statements and Exhibits.
(d) Exhibits
The following exhibits are furnished with this report:
|
| | | |
| | |
Exhibit No. | | Description |
99.1 |
| | Press Release Announcing Results for the Second Quarter Ended September 30, 2016 |
99.2 |
| | Quarterly Investor Update |
SIGNATURES
Pursuant to the requirements of the Securities Exchange Act of 1934, the registrant has duly caused this report to be signed on its behalf by the undersigned hereunto duly authorized.
|
| | | | | | | | |
| | | SPRINT CORPORATION |
| | | |
Date: October 25, 2016 | | | | | | /s/ Stefan K. Schnopp |
| | | | | | By: | | Stefan K. Schnopp |
| | | | | | | | Corporate Secretary |
EXHIBIT INDEX
|
| | | |
| | |
Number | | Exhibit |
99.1 |
| | Press Release Announcing Results for the Second Quarter Ended September 30, 2016 |
99.2 |
| | Quarterly Investor Update |
SPRINT REPORTS YEAR-OVER-YEAR GROWTH IN NET OPERATING REVENUES FOR THE FIRST TIME IN OVER TWO YEARS, A YEAR-OVER-YEAR INCREASE OF MORE THAN FIVE TIMES IN POSTPAID PHONE NET ADDITIONS, AND RECORD LOW POSTPAID PHONE CHURN WITH SECOND QUARTER OF FISCAL YEAR 2016 RESULTS
| |
• | Net operating revenues of $8.25 billion grew year-over-year for the first time in over two years |
| |
• | Net loss of $142 million, operating income of $622 million and Adjusted EBITDA* of $2.35 billion |
| |
◦ | More than $1.1 billion of year-to-date reductions in cost of service and selling, general, and administrative expenses |
| |
• | Net cash provided by operating activities of $1.71 billion; Adjusted free cash flow* of $707 million |
| |
◦ | Nearly $1.2 billion of Adjusted free cash flow* in the first half of fiscal year 2016 |
| |
• | Postpaid phone net additions of 347,000 doubled from the prior quarter and improved from 62,000 in the prior year - a year-over-year increase of more than five times |
| |
◦ | Postpaid phone churn of 1.37 percent is the best in company history and improved year-over-year for the seventh consecutive quarter |
| |
◦ | Postpaid phone gross additions increased nearly 20 percent year-over-year |
| |
◦ | Postpaid net port positive against all three national carriers for the second quarter in a row |
| |
• | Successful launch of Unlimited Freedom plan offering exceptional value and simplicity for customers |
| |
• | Increased liquidity and dramatically lowered cost of capital with spectrum-backed notes priced at 3.36 percent - less than half of Sprint’s current effective interest rate |
OVERLAND PARK, Kan. - Oct. 25, 2016 - Sprint Corporation (NYSE: S) today reported operating results for the second quarter of fiscal year 2016, including the first year-over-year increase in total net operating revenues in over two years, a year-over-year increase of more than five times in postpaid phone net additions, and record low postpaid phone churn. The company also reported a net loss of $142 million, operating income of $622 million, and Adjusted EBITDA* of $2.35 billion.
“We took another step forward in our plan toward sustainable profitability and cash generation with this quarter’s results,” said Sprint CEO Marcelo Claure. “The top line is now growing, we continue to take costs out of the business, and we are successfully raising money at materially lower rates to reduce our future cash interest expenses.”
Revenue Grows as Cost Structure Improves
Sprint reported year-over-year growth in total net operating revenues for the first time in over two years, another sign its plan to transform the company is progressing. Total net operating revenues of $8.25 billion grew 3 percent year-over-year and wireless net operating revenues of $7.85 billion grew nearly 5 percent year-over-year.
Sprint continues to improve the cost structure of the business, realizing more than $1.1 billion of year-to-date reductions in cost of services and selling, general and administrative (SG&A) expenses, with nearly $600 million of the reduction coming in the fiscal second quarter. The company remains on track to achieve its goal of a sustainable reduction of $2 billion or more of run-rate operating expenses exiting fiscal year 2016 and has plans for further reductions in fiscal year 2017 and beyond.
The company also reported the following financial results:
| |
• | Net loss of $142 million, or $0.04 per share, in the quarter compared to a net loss of $585 million, or $0.15 per share, in the year-ago period, an improvement of $443 million, or $0.11 per share. |
| |
• | Operating income of $622 million in the quarter compared to an operating loss of $2 million in the year-ago period, an improvement of $624 million. The current quarter included a non-cash pre-tax gain of $354 million related to spectrum swaps with other carriers that was partially offset by $103 million of litigation and other contingency expenses. |
| |
• | Adjusted EBITDA* of $2.35 billion in the quarter compared to $2.01 billion in the year-ago period, an increase of approximately $340 million or 17 percent. The improvement was primarily due to higher operating revenues and lower cost of services and SG&A expenses, partially offset by higher cost of products expenses. |
| |
• | Net cash provided by operating activities was $1.71 billion in the quarter compared to $1.67 billion in the year-ago period, an improvement of $39 million. |
| |
• | Adjusted free cash flow* was positive $707 million in the quarter compared to negative $100 million in the year-ago period, an improvement of $807 million. |
Spectrum-Backed Notes Improve Liquidity Position
Total liquidity was $11.3 billion at the end of the quarter, including $5.7 billion of cash, cash equivalents and short-term investments. Additionally, the company also has $1.1 billion of availability under vendor financing agreements that can be used toward the purchase of 2.5GHz network equipment.
Last week, the company priced $3.5 billion of spectrum-backed senior secured notes at 3.36 percent, which is less than half of the company’s current effective interest rate. This transaction represents the latest example of Sprint’s strategy to diversify its sources of financing, lower its cost of capital, and reduce future interest expenses by retiring upcoming maturities with higher coupon payments. In conjunction with closing of the spectrum-backed notes, which is expected on Oct. 27, the company’s $2.5 billion unsecured financing facility will terminate.
Postpaid Phone Customers Continue to Choose Sprint
Sprint’s focus on delivering the best value proposition in wireless resulted in its fifth consecutive quarter of positive postpaid phone net additions with 347,000 in the quarter, an improvement of 285,000 compared to the year-ago period. The year-over-year improvement was driven by both better acquisition and retention, as postpaid phone gross additions were up nearly 20 percent year-over-year and postpaid phone churn of 1.37 percent improved 12 basis points to reach the lowest level in company history. Postpaid phone churn has improved year-over-year for seven consecutive quarters.
Sprint enhanced its rate plan options for customers by launching Unlimited Freedom in August, an exceptional offer of value and simplicity. The popularity of this new plan has grown quickly and today about half of new customers are choosing the Unlimited Freedom plan when they join Sprint. This attractive new rate plan helped the company remain postpaid net port positive against all three national carriers for the second quarter in a row.
The company also reported the following Sprint platform results:
| |
• | Total net additions were 740,000 in the quarter, including postpaid net additions of 344,000, prepaid net losses of 427,000, and wholesale and affiliate net additions of 823,000. |
| |
• | Total postpaid churn of 1.52 percent in the quarter improved by two basis points year-over-year. |
Third Party Sources and Record Low Churn Reinforce Network Improvements
Sprint aims to unlock the value of the largest spectrum holdings in the U.S. by densifying and optimizing its network to provide customers the best experience. The company’s LTE Plus Network, which combines a rich tri-band spectrum portfolio with the LTE Advanced features of carrier aggregation and antenna beamforming, has been deployed across the country. Third party sources, along with record low postpaid phone churn, continue to validate the network improvements.
| |
• | Sprint ranked second for wireless network quality performance in five out of six geographic regions of the U.S. according to J.D. Power, a leader in independent industry benchmark studies, in its 2016 Wireless Network Quality Performance Study - Volume 2. |
| |
• | Sprint’s LTE Plus Network continued to outperform Verizon, AT&T, and T-Mobile by delivering the fastest LTE download speeds based on recent crowd-sourced data from Nielsen.1 Additionally, Sprint’s reliability beat T-Mobile and performed within 1 percent of AT&T and Verizon.2 |
| |
• | Independent mobile analytics firm RootMetrics® awarded Sprint 52 percent more first or shared first place RootScore® Awards (from 90 to 137) in the 70 markets measured in the second half of 2016 compared to the prior testing period.3 |
Sprint’s LTE Plus Network is now available in more than 250 markets and the company has started to deploy three-channel carrier aggregation in such markets as Chicago, San Francisco, Minneapolis, Dallas, Denver, Kansas City, Cleveland, and Columbus. These deployments will provide peak download speeds of more than 200Mbps on capable devices when available. The company currently has 10 three-channel carrier aggregation capable devices, including the recently launched iPhone 7 and Samsung Galaxy S7.
Fiscal Year 2016 Outlook
| |
• | The company is raising its guidance for operating income from its previous expectation of $1 billion to $1.5 billion to a range of $1.2 billion to $1.7 billion, partially due to the net benefit of special items in the quarter. |
| |
• | The company now expects cash capital expenditures, excluding devices leased through indirect channels, to be less than $3 billion, as the company has better visibility into the timing of payments associated with its network densification plan. |
| |
• | The company continues to expect Adjusted EBITDA* of $9.5 billion to $10 billion and Adjusted free cash flow* around break-even. |
Conference Call and Webcast
| |
• | Date/Time: 8:30 a.m. (ET) Tuesday, Oct. 25, 2016 |
| |
◦ | U.S./Canada: 866-360-1063 (ID: 84455839) |
| |
◦ | International: 443-961-0242 (ID: 84455839) |
| |
• | Webcast available at www.sprint.com/investors |
| |
• | Additional information about results is available on our Investor Relations website |
Contact Information
| |
• | Media contact: Dave Tovar, 913-315-1451, David.Tovar@sprint.com |
| |
• | Investor contact: Jud Henry, 800-259-3755, Investor.Relations@sprint.com |
__________________________
1 Sprint’s analysis of Nielsen NMP data for average LTE download speeds, based on a population weighted average of all 99 Sprint markets in the U.S.
2 Average network reliability (voice & data) based on Sprint’s analysis of Nielsen drive test data in the top 106 metro markets.
3 Rankings based on RootMetrics 70 Metro RootScore Reports (January-October 2016) for mobile performance as tested on best available plans and devices on 4 mobile networks across all available network types. Your experience may vary. The RootMetrics awards are not an endorsement of Sprint. Visit www.rootmetrics.com.
Wireless Operating Statistics (Unaudited) |
| | | | | | | | | | | | | | | | |
| Quarter To Date | | Year To Date |
| 9/30/16 | 6/30/16 | 9/30/15 | | 9/30/16 | 9/30/15 |
Sprint platform (1): | | | | | | |
Net additions (losses) (in thousands) | | | | | | |
Postpaid | 344 |
| 180 |
| 378 |
| | 524 |
| 688 |
|
Prepaid | (427 | ) | (331 | ) | (188 | ) | | (758 | ) | (554 | ) |
Wholesale and affiliate | 823 |
| 528 |
| 866 |
| | 1,351 |
| 1,597 |
|
Total Sprint platform wireless net additions | 740 |
| 377 |
| 1,056 |
| | 1,117 |
| 1,731 |
|
| | | | | | |
End of period connections (in thousands) | | | | | | |
Postpaid (d) | 31,289 |
| 30,945 |
| 30,394 |
| | 31,289 |
| 30,394 |
|
Prepaid (d) | 13,547 |
| 13,974 |
| 15,152 |
| | 13,547 |
| 15,152 |
|
Wholesale and affiliate (d) | 15,357 |
| 14,534 |
| 12,322 |
| | 15,357 |
| 12,322 |
|
Total Sprint platform end of period connections | 60,193 |
| 59,453 |
| 57,868 |
| | 60,193 |
| 57,868 |
|
| | | | | | |
Churn | | | | | | |
Postpaid | 1.52 | % | 1.56 | % | 1.54 | % | | 1.54 | % | 1.55 | % |
Prepaid | 5.63 | % | 5.55 | % | 5.06 | % | | 5.59 | % | 5.07 | % |
| | | | | | |
Supplemental data - connected devices | | | | | | |
End of period connections (in thousands) | | | | | | |
Retail postpaid | 1,874 |
| 1,822 |
| 1,576 |
| | 1,874 |
| 1,576 |
|
Wholesale and affiliate | 9,951 |
| 9,244 |
| 7,338 |
| | 9,951 |
| 7,338 |
|
Total | 11,825 |
| 11,066 |
| 8,914 |
| | 11,825 |
| 8,914 |
|
| | | | | | |
Supplemental data - total company | | | | | | |
End of period connections (in thousands) | | | | | | |
Sprint platform (1) (d) | 60,193 |
| 59,453 |
| 57,868 |
| | 60,193 |
| 57,868 |
|
Transactions (2) | — |
| — |
| 710 |
| | — |
| 710 |
|
Total | 60,193 |
| 59,453 |
| 58,578 |
| | 60,193 |
| 58,578 |
|
| | | | | | |
Sprint platform ARPU (1) (a) | | | | | | |
Postpaid | $ | 50.54 |
| $ | 51.54 |
| $ | 53.99 |
| | $ | 51.04 |
| $ | 54.73 |
|
Prepaid | $ | 27.31 |
| $ | 27.34 |
| $ | 27.66 |
| | $ | 27.32 |
| $ | 27.73 |
|
| | | | | | |
Sprint platform postpaid phone (1) | | | | | | |
Postpaid phone net additions | 347 |
| 173 |
| 62 |
| | 520 |
| 50 |
|
Postpaid phone end of period connections (d) | 25,669 |
| 25,322 |
| 24,928 |
| | 25,669 |
| 24,928 |
|
Postpaid phone churn | 1.37 | % | 1.39 | % | 1.49 | % | | 1.38 | % | 1.49 | % |
NON-GAAP RECONCILIATION - ABPA*, POSTPAID PHONE ARPU AND ABPU* (Unaudited)
(Millions, except accounts, connections, ABPA*, ARPU, and ABPU*) |
| | | | | | | | | | | | | | | | |
| Quarter to Date | | Year to Date |
| 9/30/16 | 6/30/16 | 9/30/15 | | 9/30/16 | 9/30/15 |
Sprint platform ABPA* (1) | | | | | | |
Postpaid service revenue | $ | 4,720 |
| $ | 4,778 |
| $ | 4,893 |
| | $ | 9,498 |
| $ | 9,857 |
|
Add: Installment plan billings | 274 |
| 264 |
| 305 |
| | 538 |
| 603 |
|
Add: Lease revenue | 811 |
| 755 |
| 389 |
| | 1,566 |
| 645 |
|
Total for Sprint platform postpaid connections | $ | 5,805 |
| $ | 5,797 |
| $ | 5,587 |
| | $ | 11,602 |
| $ | 11,105 |
|
| | | | | | |
Sprint platform postpaid accounts (in thousands) | 11,363 |
| 11,329 |
| 11,197 |
| | 11,346 |
| 11,186 |
|
Sprint platform postpaid ABPA* (b) | $ | 170.29 |
| $ | 170.56 |
| $ | 166.26 |
| | $ | 170.43 |
| $ | 165.45 |
|
| | | | | | |
| Quarter to Date | | Year to Date |
| 9/30/16 | 6/30/16 | 9/30/15 | | 9/30/16 | 9/30/15 |
Sprint platform postpaid phone ARPU and ABPU* (1) | | | | | | |
Postpaid phone service revenue | $ | 4,441 |
| $ | 4,489 |
| $ | 4,608 |
| | $ | 8,930 |
| $ | 9,290 |
|
Add: Installment plan billings | 248 |
| 243 |
| 286 |
| | 491 |
| 568 |
|
Add: Lease revenue | 797 |
| 741 |
| 379 |
| | 1,538 |
| 628 |
|
Total for Sprint platform postpaid phone connections | $ | 5,486 |
| $ | 5,473 |
| $ | 5,273 |
| | $ | 10,959 |
| $ | 10,486 |
|
| | | | | | |
Sprint platform postpaid average phone connections (in thousands) | 25,514 |
| 25,275 |
| 24,886 |
| | 25,394 |
| 24,871 |
|
Sprint platform postpaid phone ARPU (a) | $ | 58.03 |
| $ | 59.20 |
| $ | 61.71 |
| | $ | 58.61 |
| $ | 62.25 |
|
Sprint platform postpaid phone ABPU* (c) | $ | 71.69 |
| $ | 72.17 |
| $ | 70.62 |
| | $ | 71.93 |
| $ | 70.27 |
|
(a) ARPU is calculated by dividing service revenue by the sum of the monthly average number of connections in the applicable service category. Changes in average monthly service revenue reflect connections for either the postpaid or prepaid service category who change rate plans, the level of voice and data usage, the amount of service credits which are offered to connections, plus the net effect of average monthly revenue generated by new connections and deactivating connections. Sprint platform postpaid phone ARPU represents revenues related to our postpaid phone connections.
(b) Sprint platform postpaid ABPA* is calculated by dividing service revenue earned from connections plus installment plan billings and lease revenue by the sum of the monthly average number of accounts during the period.
(c) Sprint platform postpaid phone ABPU* is calculated by dividing postpaid phone service revenue earned from postpaid phone connections plus installment plan billings and lease revenue by the sum of the monthly average number of postpaid phone connections during the period.
(d) As part of the transaction involving Shenandoah Telecommunications Company (Shentel), 186,000 and 92,000 subscribers were transferred in May 2016 from postpaid and prepaid, respectively, to affiliates. An additional 270,000 nTelos' subscribers are now part of our affiliate relationship with Shentel and are being reported in wholesale and affiliate subscribers during the quarter ended June 30, 2016.
Wireless Device Financing Summary (Unaudited)
(Millions, except sales, connections, and sales and connections mix)
|
| | | | | | | | | | | | | | | | |
| Quarter To Date | | Year To Date |
| 9/30/16 | 6/30/16 | 9/30/15 | | 9/30/16 | 9/30/15 |
| | | | | | |
Postpaid sales (in thousands) | 3,747 |
| 3,268 |
| 4,117 |
| | 7,015 |
| 8,157 |
|
Postpaid sales mix | | | | | | |
Subsidy/other | 27 | % | 31 | % | 36 | % | | 29 | % | 36 | % |
Installment plans | 34 | % | 25 | % | 13 | % | | 30 | % | 13 | % |
Leasing | 39 | % | 44 | % | 51 | % | | 41 | % | 51 | % |
| | | | | | |
Installment plans | | | | | | |
Installment sales financed | $ | 745 |
| $ | 407 |
| $ | 242 |
| | $ | 1,152 |
| $ | 497 |
|
Installment billings | 274 |
| 264 |
| 305 |
| | 538 |
| 603 |
|
Installment receivables, net | — |
| — |
| 1,113 |
| | — |
| 1,113 |
|
| | | | | | |
Leasing | | | | | | |
Lease revenue | $ | 811 |
| $ | 755 |
| $ | 389 |
| | $ | 1,566 |
| $ | 645 |
|
Lease depreciation | 724 |
| 644 |
| 420 |
| | 1,368 |
| 696 |
|
| | | | | | |
Leased device additions: | | | | | | |
Cash paid for capital expenditures - leased devices | $ | 358 |
| $ | 405 |
| $ | 573 |
| | $ | 763 |
| $ | 1,117 |
|
Transfers from inventory - leased devices | 645 |
| 541 |
| 742 |
| | 1,186 |
| 1,550 |
|
| | | | | | |
Leased devices in property, plant and equipment, net | $ | 3,759 |
| $ | 3,766 |
| $ | 3,609 |
| | $ | 3,759 |
| $ | 3,609 |
|
| | | | | | |
Leased device net proceeds | | | | | | |
Proceeds from MLS sale | $ | — |
| $ | 1,055 |
| $ | — |
| | $ | 1,055 |
| $ | — |
|
Repayments to MLS | (161 | ) | (165 | ) | — |
| | (326 | ) | — |
|
Proceeds from lease securtization | — |
| — |
| — |
| | — |
| — |
|
Repayments of lease securtization | (23 | ) | (75 | ) | — |
| | (98 | ) | — |
|
Net (repayments) proceeds of device financings and sales of future lease receivables | $ | (184 | ) | $ | 815 |
| $ | — |
| | $ | 631 |
| $ | — |
|
CONDENSED CONSOLIDATED STATEMENTS OF OPERATIONS (Unaudited)
(Millions, except per share data)
|
| | | | | | | | | | | | | | | | |
| Quarter to Date | | Year to Date |
| 9/30/16 | 6/30/16 | 9/30/15 | | 9/30/16 | 9/30/15 |
| | | | | | |
Net operating revenues | | | | | | |
Service revenue | $ | 6,413 |
| $ | 6,516 |
| $ | 6,880 |
| | $ | 12,929 |
| $ | 13,917 |
|
Equipment revenue | 1,834 |
| 1,496 |
| 1,095 |
| | 3,330 |
| 2,085 |
|
Total net operating revenues | 8,247 |
| 8,012 |
| 7,975 |
| | 16,259 |
| 16,002 |
|
Net operating expenses | | | | | | |
Cost of services (exclusive of depreciation and amortization below) | 2,101 |
| 2,099 |
| 2,453 |
| | 4,200 |
| 4,846 |
|
Cost of products (exclusive of depreciation and amortization below) | 1,693 |
| 1,419 |
| 1,290 |
| | 3,112 |
| 2,655 |
|
Selling, general and administrative | 1,995 |
| 1,917 |
| 2,224 |
| | 3,912 |
| 4,411 |
|
Depreciation - network and other | 986 |
| 1,036 |
| 992 |
| | 2,022 |
| 1,957 |
|
Depreciation - leased devices | 724 |
| 644 |
| 420 |
| | 1,368 |
| 696 |
|
Amortization | 271 |
| 287 |
| 331 |
| | 558 |
| 678 |
|
Other, net | (145 | ) | 249 |
| 267 |
| | 104 |
| 260 |
|
Total net operating expenses | 7,625 |
| 7,651 |
| 7,977 |
| | 15,276 |
| 15,503 |
|
Operating income (loss) | 622 |
| 361 |
| (2 | ) | | 983 |
| 499 |
|
Interest expense | (630 | ) | (615 | ) | (542 | ) | | (1,245 | ) | (1,084 | ) |
Other (expense) income, net | (15 | ) | 8 |
| 5 |
| | (7 | ) | 9 |
|
Loss before income taxes | (23 | ) | (246 | ) | (539 | ) | | (269 | ) | (576 | ) |
Income tax expense | (119 | ) | (56 | ) | (46 | ) | | (175 | ) | (29 | ) |
Net loss | $ | (142 | ) | $ | (302 | ) | $ | (585 | ) | | $ | (444 | ) | $ | (605 | ) |
| | | | | | |
Basic and diluted net loss per common share | $ | (0.04 | ) | $ | (0.08 | ) | $ | (0.15 | ) | | $ | (0.11 | ) | $ | (0.15 | ) |
Weighted average common shares outstanding | 3,979 |
| 3,975 |
| 3,969 |
| | 3,977 |
| 3,968 |
|
Effective tax rate | -517.4 | % | -22.8 | % | -8.5 | % | | -65.1 | % | -5.0 | % |
NON-GAAP RECONCILIATION - NET LOSS TO ADJUSTED EBITDA* (Unaudited)
(Millions) |
| | | | | | | | | | | | | | | | |
| Quarter to Date | | Year to Date |
| 9/30/16 | 6/30/16 | 9/30/15 | | 9/30/16 | 9/30/15 |
| | | | | | |
Net loss | $ | (142 | ) | $ | (302 | ) | $ | (585 | ) | | $ | (444 | ) | $ | (605 | ) |
Income tax expense | 119 |
| 56 |
| 46 |
| | 175 |
| 29 |
|
Loss before income taxes | (23 | ) | (246 | ) | (539 | ) | | (269 | ) | (576 | ) |
Other expense (income), net | 15 |
| (8 | ) | (5 | ) | | 7 |
| (9 | ) |
Interest expense | 630 |
| 615 |
| 542 |
| | 1,245 |
| 1,084 |
|
Operating income (loss) | 622 |
| 361 |
| (2 | ) | | 983 |
| 499 |
|
Depreciation - network and other | 986 |
| 1,036 |
| 992 |
| | 2,022 |
| 1,957 |
|
Depreciation - leased devices | 724 |
| 644 |
| 420 |
| | 1,368 |
| 696 |
|
Amortization | 271 |
| 287 |
| 331 |
| | 558 |
| 678 |
|
EBITDA* (3) | 2,603 |
| 2,328 |
| 1,741 |
| | 4,931 |
| 3,830 |
|
(Gain) loss from asset dispositions and exchanges, net (4) | (354 | ) | — |
| 85 |
| | (354 | ) | 85 |
|
Severance and exit costs (5) | (5 | ) | 16 |
| 25 |
| | 11 |
| 38 |
|
Contract terminations (6) | — |
| 113 |
| — |
| | 113 |
| — |
|
Litigation and other contingencies (7) | 103 |
| — |
| 157 |
| | 103 |
| 157 |
|
Reduction in liability - U.S. Cellular asset acquisition (8) | — |
| — |
| — |
| | — |
| (20 | ) |
Adjusted EBITDA* (3) | $ | 2,347 |
| $ | 2,457 |
| $ | 2,008 |
| | $ | 4,804 |
| $ | 4,090 |
|
Adjusted EBITDA margin* | 36.6 | % | 37.7 | % | 29.2 | % | | 37.2 | % | 29.4 | % |
Selected items: | | | | | | |
Cash paid for capital expenditures - network and other | $ | 470 |
| $ | 473 |
| $ | 1,162 |
| | $ | 943 |
| $ | 2,964 |
|
Cash paid for capital expenditures - leased devices | $ | 358 |
| $ | 405 |
| $ | 573 |
| | $ | 763 |
| $ | 1,117 |
|
WIRELESS STATEMENTS OF OPERATIONS (Unaudited)
(Millions)
|
| | | | | | | | | | | | | | | | |
| Quarter to Date | | Year to Date |
| 9/30/16 | 6/30/16 | 9/30/15 | | 9/30/16 | 9/30/15 |
| | | | | | |
Net operating revenues | | | | | | |
Service revenue | | | | | | |
Sprint platform (1): | | | | | | |
Postpaid | $ | 4,720 |
| $ | 4,778 |
| $ | 4,893 |
| | $ | 9,498 |
| $ | 9,857 |
|
Prepaid | 1,129 |
| 1,165 |
| 1,259 |
| | 2,294 |
| 2,559 |
|
Wholesale, affiliate and other | 168 |
| 158 |
| 185 |
| | 326 |
| 366 |
|
Total Sprint platform | 6,017 |
| 6,101 |
| 6,337 |
| | 12,118 |
| 12,782 |
|
| | | | | | |
Total transactions (2) | — |
| — |
| 84 |
| | — |
| 189 |
|
Total service revenue | 6,017 |
| 6,101 |
| 6,421 |
| | 12,118 |
| 12,971 |
|
| | | | | | |
Equipment revenue | 1,834 |
| 1,496 |
| 1,095 |
| | 3,330 |
| 2,085 |
|
Total net operating revenues | 7,851 |
| 7,597 |
| 7,516 |
| | 15,448 |
| 15,056 |
|
| | | | | | |
Net operating expenses | | | | | | |
Cost of services (exclusive of depreciation and amortization below) | 1,793 |
| 1,784 |
| 2,111 |
| | 3,577 |
| 4,116 |
|
Cost of products (exclusive of depreciation and amortization below) | 1,693 |
| 1,419 |
| 1,290 |
| | 3,112 |
| 2,655 |
|
Selling, general and administrative | 1,931 |
| 1,834 |
| 2,136 |
| | 3,765 |
| 4,232 |
|
Depreciation - network and other | 936 |
| 985 |
| 943 |
| | 1,921 |
| 1,860 |
|
Depreciation - leased devices | 724 |
| 644 |
| 420 |
| | 1,368 |
| 696 |
|
Amortization | 271 |
| 287 |
| 331 |
| | 558 |
| 678 |
|
Other, net | (151 | ) | 249 |
| 266 |
| | 98 |
| 258 |
|
Total net operating expenses | 7,197 |
| 7,202 |
| 7,497 |
| | 14,399 |
| 14,495 |
|
Operating income | $ | 654 |
| $ | 395 |
| $ | 19 |
| | $ | 1,049 |
| $ | 561 |
|
| | | | | | |
WIRELESS NON-GAAP RECONCILIATION (Unaudited)
(Millions) |
| | | | | | | | | | | | | | | | |
| Quarter to Date | | Year to Date |
| 9/30/16 | 6/30/16 | 9/30/15 | | 9/30/16 | 9/30/15 |
| | | | | | |
Operating income | $ | 654 |
| $ | 395 |
| $ | 19 |
| | $ | 1,049 |
| $ | 561 |
|
(Gain) loss from asset dispositions and exchanges, net (4) | (354 | ) | — |
| 85 |
| | (354 | ) | 85 |
|
Severance and exit costs (5) | (11 | ) | 16 |
| 24 |
| | 5 |
| 36 |
|
Contract terminations (6) | — |
| 113 |
| — |
| | 113 |
| — |
|
Litigation and other contingencies (7) | 103 |
| — |
| 157 |
| | 103 |
| 157 |
|
Reduction in liability - U.S. Cellular asset acquisition (8) | — |
| — |
| — |
| | — |
| (20 | ) |
Depreciation - network and other | 936 |
| 985 |
| 943 |
| | 1,921 |
| 1,860 |
|
Depreciation - leased devices | 724 |
| 644 |
| 420 |
| | 1,368 |
| 696 |
|
Amortization | 271 |
| 287 |
| 331 |
| | 558 |
| 678 |
|
Adjusted EBITDA* (3) | $ | 2,323 |
| $ | 2,440 |
| $ | 1,979 |
| | $ | 4,763 |
| $ | 4,053 |
|
Adjusted EBITDA margin* | 38.6 | % | 40.0 | % | 30.8 | % | | 39.3 | % | 31.2 | % |
Selected items: | | | | | | |
Cash paid for capital expenditures - network and other | $ | 358 |
| $ | 376 |
| $ | 1,003 |
| | $ | 734 |
| $ | 2,643 |
|
Cash paid for capital expenditures - leased devices | $ | 358 |
| $ | 405 |
| $ | 573 |
| | $ | 763 |
| $ | 1,117 |
|
WIRELINE STATEMENTS OF OPERATIONS (Unaudited)
(Millions)
|
| | | | | | | | | | | | | | | | |
| Quarter to Date | | Year to Date |
| 9/30/16 | 6/30/16 | 9/30/15 | | 9/30/16 | 9/30/15 |
Net operating revenues | | | | | | |
Voice | $ | 172 |
| $ | 181 |
| $ | 212 |
| | $ | 353 |
| $ | 445 |
|
Data | 43 |
| 43 |
| 43 |
| | 86 |
| 92 |
|
Internet | 288 |
| 302 |
| 323 |
| | 590 |
| 651 |
|
Other | 18 |
| 19 |
| 31 |
| | 37 |
| 51 |
|
Total net operating revenues | 521 |
| 545 |
| 609 |
| | 1,066 |
| 1,239 |
|
| | | | | | |
Net operating expenses | | | | | | |
Cost of services (exclusive of depreciation and amortization below) | 436 |
| 448 |
| 495 |
| | 884 |
| 1,029 |
|
Selling, general and administrative | 62 |
| 78 |
| 85 |
| | 140 |
| 172 |
|
Depreciation and amortization | 48 |
| 49 |
| 48 |
| | 97 |
| 94 |
|
Other, net | 7 |
| — |
| 1 |
| | 7 |
| 2 |
|
Total net operating expenses | 553 |
| 575 |
| 629 |
| | 1,128 |
| 1,297 |
|
Operating loss | $ | (32 | ) | $ | (30 | ) | $ | (20 | ) | | $ | (62 | ) | $ | (58 | ) |
WIRELINE NON-GAAP RECONCILIATION (Unaudited)
(Millions)
|
| | | | | | | | | | | | | | | | |
| Quarter to Date | | Year to Date |
| 9/30/16 | 6/30/16 | 9/30/15 | | 9/30/16 | 9/30/15 |
| | | | | | |
Operating loss | $ | (32 | ) | $ | (30 | ) | $ | (20 | ) | | $ | (62 | ) | $ | (58 | ) |
Severance and exit costs (5) | 7 |
| — |
| 1 |
| | 7 |
| 2 |
|
Depreciation and amortization | 48 |
| 49 |
| 48 |
| | 97 |
| 94 |
|
Adjusted EBITDA* | $ | 23 |
| $ | 19 |
| $ | 29 |
| | $ | 42 |
| $ | 38 |
|
Adjusted EBITDA margin* | 4.4 | % | 3.5 | % | 4.8 | % | | 3.9 | % | 3.1 | % |
Selected items: | | | | | | |
Cash paid for capital expenditures - network and other | $ | 31 |
| $ | 20 |
| $ | 63 |
| | $ | 51 |
| $ | 131 |
|
CONDENSED CONSOLIDATED CASH FLOW INFORMATION (Unaudited)**
(Millions)
|
| | | | | | |
| Year to Date |
| 9/30/16 | 9/30/15 |
Operating activities | | |
Net loss | $ | (444 | ) | $ | (605 | ) |
Depreciation and amortization | 3,948 |
| 3,331 |
|
Provision for losses on accounts receivable | 232 |
| 278 |
|
Share-based and long-term incentive compensation expense | 29 |
| 40 |
|
Deferred income tax expense | 157 |
| 28 |
|
Gains from asset dispositions and exchanges | (354 | ) | — |
|
Amortization of long-term debt premiums, net | (159 | ) | (157 | ) |
Loss on disposal of property, plant and equipment | 231 |
| 85 |
|
Contract terminations | 96 |
| — |
|
Other changes in assets and liabilities: | |
|
|
Accounts and notes receivable | (126 | ) | (1,357 | ) |
Inventories and other current assets | (892 | ) | (1,025 | ) |
Deferred purchase price from sale of receivables | (400 | ) | 1,198 |
|
Accounts payable and other current liabilities | (195 | ) | (509 | ) |
Non-current assets and liabilities, net | (205 | ) | 125 |
|
Other, net | 332 |
| 365 |
|
Net cash provided by operating activities | 2,250 |
| 1,797 |
|
| | |
Investing activities | | |
Capital expenditures - network and other | (943 | ) | (2,964 | ) |
Capital expenditures - leased devices | (763 | ) | (1,117 | ) |
Expenditures relating to FCC licenses | (32 | ) | (45 | ) |
Change in short-term investments, net | (1,650 | ) | 63 |
|
Proceeds from sales of assets and FCC licenses | 66 |
| 4 |
|
Other, net | (36 | ) | (21 | ) |
Net cash used in investing activities | (3,358 | ) | (4,080 | ) |
| | |
Financing activities | | |
Proceeds from debt and financings | 3,278 |
| 434 |
|
Repayments of debt, financing and capital lease obligations | (667 | ) | (206 | ) |
Debt financing costs | (175 | ) | (1 | ) |
Other, net | 37 |
| 18 |
|
Net cash provided by financing activities | 2,473 |
| 245 |
|
| | |
Net increase (decrease) in cash and cash equivalents | 1,365 |
| (2,038 | ) |
| | |
Cash and cash equivalents, beginning of period | 2,641 |
| 4,010 |
|
Cash and cash equivalents, end of period | $ | 4,006 |
| $ | 1,972 |
|
RECONCILIATION TO CONSOLIDATED FREE CASH FLOW* (NON-GAAP) (Unaudited)
(Millions) |
| | | | | | | | | | | | | | | | |
| Quarter to Date | | Year to Date |
| 9/30/16 | 6/30/16 | 9/30/15 | | 9/30/16 | 9/30/15 |
| | | | | | |
Net cash provided by operating activities | $ | 1,708 |
| $ | 542 |
| $ | 1,669 |
| | $ | 2,250 |
| $ | 1,797 |
|
| | | | | | |
Capital expenditures - network and other | (470 | ) | (473 | ) | (1,162 | ) | | (943 | ) | (2,964 | ) |
Capital expenditures - leased devices | (358 | ) | (405 | ) | (573 | ) | | (763 | ) | (1,117 | ) |
Expenditures relating to FCC licenses, net | (17 | ) | (15 | ) | (19 | ) | | (32 | ) | (45 | ) |
Proceeds from sales of assets and FCC licenses | 39 |
| 27 |
| 3 |
| | 66 |
| 4 |
|
Other investing activities, net | (11 | ) | (25 | ) | (18 | ) | | (36 | ) | (21 | ) |
Free cash flow* | $ | 891 |
| $ | (349 | ) | $ | (100 | ) | | $ | 542 |
| $ | (2,346 | ) |
| | | | | | |
Net (repayments) proceeds of device financings and sales of future lease receivables | (184 | ) | 815 |
| — |
| | 631 |
| — |
|
Adjusted free cash flow* | $ | 707 |
| $ | 466 |
| $ | (100 | ) | | $ | 1,173 |
| $ | (2,346 | ) |
**Certain prior period amounts have been reclassified to conform to the current period presentation.
CONDENSED CONSOLIDATED BALANCE SHEETS (Unaudited)
(Millions)
|
| | | | | | |
| 9/30/16 | 3/31/16 |
ASSETS | | |
Current assets | | |
Cash and cash equivalents | $ | 4,006 |
| $ | 2,641 |
|
Short-term investments | 1,650 |
| — |
|
Accounts and notes receivable, net | 1,004 |
| 1,099 |
|
Device and accessory inventory | 981 |
| 1,173 |
|
Prepaid expenses and other current assets | 2,215 |
| 1,920 |
|
Total current assets | 9,856 |
| 6,833 |
|
| | |
Property, plant and equipment, net | 19,176 |
| 20,297 |
|
Goodwill | 6,575 |
| 6,575 |
|
FCC licenses and other | 40,541 |
| 40,073 |
|
Definite-lived intangible assets, net | 3,861 |
| 4,469 |
|
Other assets | 819 |
| 728 |
|
Total assets | $ | 80,828 |
| $ | 78,975 |
|
| | |
LIABILITIES AND STOCKHOLDERS' EQUITY | | |
Current liabilities | | |
Accounts payable | $ | 2,649 |
| $ | 2,899 |
|
Accrued expenses and other current liabilities | 4,285 |
| 4,374 |
|
Current portion of long-term debt, financing and capital lease obligations | 7,014 |
| 4,690 |
|
Total current liabilities | 13,948 |
| 11,963 |
|
| | |
Long-term debt, financing and capital lease obligations | 29,541 |
| 29,268 |
|
Deferred tax liabilities | 14,120 |
| 13,959 |
|
Other liabilities | 3,796 |
| 4,002 |
|
Total liabilities | 61,405 |
| 59,192 |
|
| | |
Stockholders' equity | | |
Common stock | 40 |
| 40 |
|
Treasury shares, at cost | — |
| (3 | ) |
Paid-in capital | 27,637 |
| 27,563 |
|
Accumulated deficit | (7,822 | ) | (7,378 | ) |
Accumulated other comprehensive loss | (432 | ) | (439 | ) |
Total stockholders' equity | 19,423 |
| 19,783 |
|
Total liabilities and stockholders' equity | $ | 80,828 |
| $ | 78,975 |
|
NET DEBT* (NON-GAAP) (Unaudited)
(Millions)
|
| | | | | | |
| 9/30/16 | 3/31/16 |
| | |
Total debt | $ | 36,555 |
| $ | 33,958 |
|
Less: Cash and cash equivalents | (4,006 | ) | (2,641 | ) |
Less: Short-term investments | (1,650 | ) | — |
|
Net debt* | $ | 30,899 |
| $ | 31,317 |
|
SCHEDULE OF DEBT (Unaudited)
(Millions)
|
| | | | |
| | 9/30/16 |
ISSUER | MATURITY | PRINCIPAL |
Sprint Corporation | | |
7.25% Senior notes due 2021 | 09/15/2021 | $ | 2,250 |
|
7.875% Senior notes due 2023 | 09/15/2023 | 4,250 |
|
7.125% Senior notes due 2024 | 06/15/2024 | 2,500 |
|
7.625% Senior notes due 2025 | 02/15/2025 | 1,500 |
|
Sprint Corporation | | 10,500 |
|
| | |
Sprint Communications, Inc. | | |
Export Development Canada Facility (Tranche 4) | 12/15/2017 | 250 |
|
Export Development Canada Facility (Tranche 3) | 12/17/2019 | 300 |
|
6% Senior notes due 2016 | 12/01/2016 | 2,000 |
|
9.125% Senior notes due 2017 | 03/01/2017 | 1,000 |
|
8.375% Senior notes due 2017 | 08/15/2017 | 1,300 |
|
9% Guaranteed notes due 2018 | 11/15/2018 | 3,000 |
|
7% Guaranteed notes due 2020 | 03/01/2020 | 1,000 |
|
7% Senior notes due 2020 | 08/15/2020 | 1,500 |
|
11.5% Senior notes due 2021 | 11/15/2021 | 1,000 |
|
9.25% Debentures due 2022 | 04/15/2022 | 200 |
|
6% Senior notes due 2022 | 11/15/2022 | 2,280 |
|
Sprint Communications, Inc. | | 13,830 |
|
| | |
Sprint Capital Corporation | | |
6.9% Senior notes due 2019 | 05/01/2019 | 1,729 |
|
6.875% Senior notes due 2028 | 11/15/2028 | 2,475 |
|
8.75% Senior notes due 2032 | 03/15/2032 | 2,000 |
|
Sprint Capital Corporation | | 6,204 |
|
| | |
Clearwire Communications LLC | | |
14.75% First-priority senior secured notes due 2016 | 12/01/2016 | 300 |
|
8.25% Exchangeable notes due 2040 | 12/01/2040 | 629 |
|
Clearwire Communications LLC | | 929 |
|
| | |
Secured equipment credit facilities | 2017 - 2021 | 618 |
|
| | |
Financing obligations | 2017 - 2021 | 3,670 |
|
| | |
Capital leases and other obligations | 2016 - 2023 | 471 |
|
Total principal | | 36,222 |
|
| | |
Net premiums and debt financing costs | | 333 |
|
Total debt | | $ | 36,555 |
|
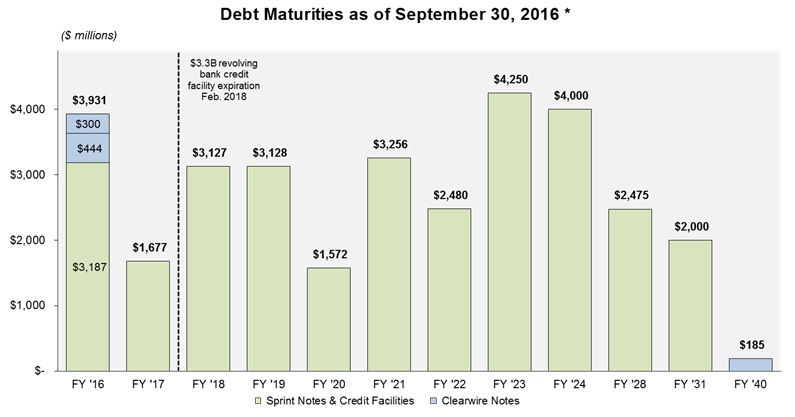
*This table excludes (i) our unsecured revolving credit facility, which will expire in 2018 and has no outstanding balance, (ii) $309M in letters of credit outstanding under the revolving credit facility, (iii) our $2.5 billion unsecured credit facility, which will expire in 2017 and has no outstanding balance, (iv) outstanding financing obligations of approximately $3.7 billion, (v) $471 million of capital leases and other obligations, and (vi) net premiums and debt financing costs.
NOTES TO THE FINANCIAL INFORMATION (Unaudited)
| |
(1) | Sprint platform refers to the Sprint network that supports the wireless service we provide through our multiple brands. |
| |
(2) | Postpaid and prepaid connections from transactions are defined as retail postpaid and prepaid connections acquired from Clearwire in July 2013 who had not deactivated or been recaptured on the Sprint platform. |
| |
(3) | As more of our customers elect to lease a device rather than purchasing one under our subsidized program, there is a significant positive impact to EBITDA* and Adjusted EBITDA* from direct channel sales primarily due to the fact the cost of the device is not recorded as cost of products but rather is depreciated over the customer lease term. Under our device leasing program for the direct channel, devices are transferred from inventory to property and equipment and the cost of the leased device is recognized as depreciation expense over the customer lease term to an estimated residual value. The customer payments are recognized as revenue over the term of the lease. Under our subsidized program, the cash received from the customer for the device is recognized as equipment revenue at the point of sale and the cost of the device is recognized as cost of products. During the three and six-month periods ended September 30, 2016, we leased devices through our Sprint direct channels totaling approximately $645 million and $1,186 million, respectively, which would have increased cost of products and reduced EBITDA* if they had been purchased under our subsidized program. Also, during the three and six-month periods ended September 30, 2016, the equipment revenue derived from customers electing to finance their devices through device leasing or installment billing programs in our direct channel was 68%. |
The impact to EBITDA* and Adjusted EBITDA* resulting from the sale of devices under our installment billing program is generally neutral except for the impact from the time value of money element related to the imputed interest on the installment receivable.
| |
(4) | During the second quarter of fiscal year 2016 the company recorded a pre-tax non-cash gain of $354 million related to spectrum swaps with other carriers. During the second quarter of fiscal year 2015, the company recorded losses on dispositions of assets primarily related to network development costs that are no longer relevant as a result of changes in the company's network plans. |
| |
(5) | Severance and exit costs consist of lease exit costs primarily associated with tower and cell sites, access exit costs related to payments that will continue to be made under the company's backhaul access contracts for which the company will no longer be receiving any economic benefit, and severance costs associated with reduction in its work force. |
| |
(6) | Contract terminations primarily relate to the termination of our pre-existing wholesale arrangement with Ntelos Holding Corp. |
| |
(7) | Litigation and other contingencies consist of unfavorable developments associated with legal as well as federal and state matters such as sales, use or property taxes. |
| |
(8) | As a result of the U.S. Cellular asset acquisition, we recorded a liability related to network shut-down costs, which primarily consisted of lease exit costs, for which we agreed to reimburse U.S. Cellular. During the third quarter of fiscal year 2014, we identified favorable trends in actual costs and, as a result, reduced the liability resulting in a gain of approximately $41 million. During the first quarter of fiscal year 2015, we revised our estimate and, as a result, reduced the liability resulting in approximately $20 million of income. |
*FINANCIAL MEASURES
Sprint provides financial measures determined in accordance with GAAP and adjusted GAAP (non-GAAP). The non-GAAP financial measures reflect industry conventions, or standard measures of liquidity, profitability or performance commonly used by the investment community for comparability purposes. These measurements should be considered in addition to, but not as a substitute for, financial information prepared in accordance with GAAP. We have defined below each of the non-GAAP measures we use, but these measures may not be synonymous to similar measurement terms used by other companies.
Sprint provides reconciliations of these non-GAAP measures in its financial reporting. Because Sprint does not predict special items that might occur in the future, and our forecasts are developed at a level of detail different than that used to prepare GAAP-based financial measures, Sprint does not provide reconciliations to GAAP of its forward-looking financial measures.
The measures used in this release include the following:
EBITDA is operating income/(loss) before depreciation and amortization. Adjusted EBITDA is EBITDA excluding severance, exit costs, and other special items. Adjusted EBITDA Margin represents Adjusted EBITDA divided by non-equipment net operating revenues for Wireless and Adjusted EBITDA divided by net operating revenues for Wireline. We believe that Adjusted EBITDA and Adjusted EBITDA Margin provide useful information to investors because they are an indicator of the strength and performance of our ongoing business operations. While depreciation and amortization are considered operating costs under GAAP, these expenses primarily represent non-cash current period costs associated with the use of long-lived tangible and definite-lived intangible assets. Adjusted EBITDA and Adjusted EBITDA Margin are calculations commonly used as a basis for investors, analysts and credit rating agencies to evaluate and compare the periodic and future operating performance and value of companies within the telecommunications industry.
Sprint Platform Postpaid ABPA is average billings per account and calculated by dividing postpaid service revenue earned from postpaid customers plus installment plan billings and lease revenue by the sum of the monthly average number of postpaid accounts during the period. We believe that ABPA provides useful information to investors, analysts and our management to evaluate average Sprint platform postpaid customer billings per account as it approximates the expected cash collections, including installment plan billings and lease revenue, per postpaid account each month.
Sprint Platform Postpaid Phone ABPU is average billings per postpaid phone user and calculated by dividing service revenue earned from postpaid phone customers plus installment plan billings and lease revenue by the sum of the monthly average number of postpaid phone connections during the period. We believe that ABPU provides useful information to investors, analysts and our management to evaluate average Sprint platform postpaid phone customer billings as it approximates the expected cash collections, including installment plan billings and lease revenue, per postpaid phone user each month.
Free Cash Flow is the cash provided by operating activities less the cash used in investing activities other than short-term investments, including changes in restricted cash, if any, and excluding the sale-leaseback of devices. Adjusted Free Cash Flow is Free Cash Flow plus the proceeds from device financings and sales of future lease receivables, net of repayments. We believe that Free Cash Flow and Adjusted Free Cash Flow provide useful information to investors, analysts and our management about the cash generated by our core operations and net proceeds obtained to fund certain leased devices, respectively, after interest and dividends, if any, and our ability to fund scheduled debt maturities and other financing activities, including discretionary refinancing and retirement of debt and purchase or sale of investments.
Net Debt is consolidated debt, including current maturities, less cash and cash equivalents, short-term investments and, if any, restricted cash. We believe that Net Debt provides useful information to investors, analysts and credit rating agencies about the capacity of the company to reduce the debt load and improve its capital structure.
SAFE HARBOR
This release includes “forward-looking statements” within the meaning of the securities laws. The words “may,” “could,” “should,” “estimate,” “project,” “forecast,” “intend,” “expect,” “anticipate,” “believe,” “target,” “plan”, “outlook,” “providing guidance,” and similar expressions are intended to identify information that is not historical in nature. All statements that address operating performance, events or developments that we expect or anticipate will occur in the future - including statements relating to our network, connections growth, and liquidity; and statements expressing general views about future operating results - are forward-looking statements. Forward-looking statements are estimates and projections reflecting management’s judgment based on currently available information and involve a number of risks and uncertainties that could cause actual results to differ materially from those suggested by the forward-looking statements. With respect to these forward-looking statements, management has made assumptions regarding, among other things, the development and deployment of new technologies and services; efficiencies and cost savings of new technologies and services; customer and network usage; connection growth and retention; service, speed, coverage and quality; availability of devices; availability of various financings, including any leasing transactions; the timing of various events and the economic environment. Sprint believes these forward-looking statements are reasonable; however, you should not place undue reliance on forward-looking statements, which are based on current expectations and speak only as of the date when made. Sprint undertakes no obligation to publicly update or revise any forward-looking statements, whether as a result of new information, future events or otherwise, except as required by law. In addition, forward-looking statements are subject to certain risks and uncertainties that could cause actual results to differ materially from our company's historical experience and our present expectations or projections. Factors that might cause such differences include, but are not limited to, those discussed in Sprint Corporation’s Annual Report on Form 10-K for the fiscal year ended March 31, 2016. You should understand that it is not possible to predict or identify all such factors. Consequently, you should not consider any such list to be a complete set of all potential risks or uncertainties.
About Sprint:
Sprint (NYSE: S) is a communications services company that creates more and better ways to connect its customers to the things they care about most. Sprint served 60.2 million connections as of Sept. 30, 2016 and is widely recognized for developing, engineering and deploying innovative technologies, including the first wireless 4G service from a national carrier in the United States; leading no-contract brands including Virgin Mobile USA, Boost Mobile, and Assurance Wireless; instant national and international push-to-talk capabilities; and a global Tier 1 Internet backbone. Sprint has been named to the Dow Jones Sustainability Index (DJSI) North America for the past five years. You can learn more and visit Sprint at www.sprint.com or www.facebook.com/sprint and www.twitter.com/sprint.
###
Sprint Quarterly Investor Update - Fiscal 2Q16
|
| |
“We took another step forward in our plan toward sustainable profitability and cash generation with this quarter’s results. The top line is now growing, we continue to take costs out of the business, and we are successfully raising money at materially lower rates to reduce our future cash interest expenses.” |
| |
| Marcelo Claure (CEO) |
Sprint Quarterly Investor Update - Fiscal 2Q16
Total
Connections^
Sprint ended the quarter with nearly 60.2 million connections, including 31.3 million postpaid, 13.5 million prepaid, and 15.4 million wholesale and affiliate connections.
The company had 740,000 net additions^ in the current quarter compared with 377,000 in the prior quarter and 1.1 million in the year-ago period.
The company has added nearly 2.1 million net additions^ over the last four quarters.
| |
Sprint Quarterly Investor Update - Fiscal 2Q16 | ^indicates results specific to Sprint Platform |
|
| | |
Postpaid net additions^ were 344,000 during the quarter compared to 378,000 in the year-ago period and 180,000 in the prior quarter. The year-over-year decline was driven by tablet net losses in the current quarter, partially offset by higher phone net additions. The sequential increase was primarily driven by higher phone gross additions as well as lower postpaid phone churn. | | |
|
| |
| |
Postpaid Phone Churn 1.37% Best Ever |
|
|
| | |
Postpaid phone churn^ of 1.37 percent, once again a record low, compared to 1.49 percent in the year-ago period and 1.39 percent in the prior quarter. The year-over-year improvement was driven by continued focus on the quality of customers and improving the network experience. Sequentially, network improvements more than offset seasonal pressure. | | Postpaid churn^ of 1.52 percent for the current quarter decreased from 1.54 percent in the year-ago period and 1.56 percent in the prior quarter. Year-over-year, lower phone churn was offset by higher tablet churn related to fewer promotional offers. The reduction in churn from the prior quarter was due to lower phone churn more than offsetting seasonal pressure. |
| |
Sprint Quarterly Investor Update - Fiscal 2Q16 | ^indicates results specific to Sprint Platform |
|
| |
Postpaid phone net additions^ of 347,000 compared to net additions of 62,000 in the year-ago period and 173,000 in the prior quarter. Both the year-over-year and sequential improvements were primarily driven by higher gross additions combined with lower churn. This quarter was the fifth consecutive quarter of positive phone net additions and the company ended the quarter with 25.7 million phone connections. | |
|
|
Tablet net losses^ were 50,000 in the quarter compared to net additions of 228,000 in the year-ago period and net losses of 31,000 in the prior quarter. The year-over-year decline was due to lower gross additions and higher tablet churn rates as the company continues to focus on growing phone connections. The company ended the quarter with 3.0 million tablet connections. |
| |
Sprint Quarterly Investor Update - Fiscal 2Q16 | ^indicates results specific to Sprint Platform |
|
| |
Average postpaid subscribers per account^ of 2.74 at quarter end compared to 2.70 in the year-ago period and 2.73 in the prior quarter. The growth has been driven by higher phones per account, partially offset by recent tablet pressure. | |
|
|
Prepaid net losses^ of 427,000 during the quarter compared to 188,000 in the year-ago period and 331,000 in the prior quarter. The year-over-year increase in net losses was mostly due to the Assurance brand, as the company continues to emphasize higher value contribution brands such as Boost and Virgin Mobile. The sequential increase was mostly related to less aggressive Boost offers designed to improve profitability.
Prepaid churn^ was 5.63 percent compared to 5.06 percent for the year-ago period and 5.55 percent for the prior quarter. The year-over-year increase was primarily due to higher churn in the company’s Assurance brand. |
Wholesale & affiliate^ net additions were 823,000 in the quarter compared to 866,000 in the year-ago period and 528,000 in the prior quarter. Connected devices represented the majority of the net additions.
| |
Sprint Quarterly Investor Update - Fiscal 2Q16 | ^indicates results specific to Sprint Platform |
|
| |
Retail sales^ were 6.8 million during the quarter compared to 7.5 million in the year-ago period and 6.5 million in the prior quarter. Lower postpaid upgrade volumes and prepaid gross additions were the biggest drivers of the year-over-year decline, while seasonally higher postpaid upgrade rates impacted the sequential change. | |

|
|
Postpaid tri-band LTE phones^ represented 78 percent of the 25.7 million ending postpaid phone connection base compared to 54 percent at the end of the year-ago period and 73 percent at the end of the prior quarter. During the quarter, 94 percent of postpaid phones sold were tri-band. |
|
|
Postpaid smartphones^ represented 93 percent of the ending postpaid phone connection base compared to 90 percent at the end of the year-ago period and 93 percent at the end of the prior quarter. During the quarter, 98 percent of postpaid phones sold were smartphones.
Postpaid carrier aggregation capable phones^, which allow for higher data speeds, were 75 percent of postpaid phones sold during the quarter, increasing the number of these phones within the phone base to 42 percent. |
| |
Sprint Quarterly Investor Update - Fiscal 2Q16 | ^indicates results specific to Sprint Platform |
|
| | |
Postpaid phone customers on unsubsidized service plans^ represented 67 percent of the base at the end of the quarter, compared to 51 percent in the year-ago period and 64 percent in the prior quarter. | | |
|
|
Postpaid device financing take rate^ was 73 percent of postpaid sales for the quarter (39 percent on leasing and 34 percent on installment plans) compared to 64 percent for the year-ago period and 69 percent in the prior quarter.
Postpaid phone financing take rate^ was 78 percent of phone sales for the quarter compared to 72 percent for the year-ago period and 75 percent in the prior quarter. |
|
|
Postpaid upgrade rate^ was 6.4 percent during the quarter compared to 7.8 percent for the year-ago period and 5.4 percent for the prior quarter. The year-over-year decline was driven by a lower percentage of the overall base being eligible for an upgrade. The sequential increase was driven by normal seasonality combined with the iPhone 7 launch. |
| |
Sprint Quarterly Investor Update - Fiscal 2Q16 | ^indicates results specific to Sprint Platform |
Sprint aims to unlock the value of the largest spectrum holdings in the U.S. by densifying and optimizing its network to provide customers the best experience. The company’s LTE Plus Network, which combines a rich tri-band spectrum portfolio with the LTE Advanced features of carrier aggregation and antenna beamforming, has been deployed across the country. Third party sources, along with record low postpaid phone churn, continue to validate the network improvements.
| |
• | Sprint ranked second for wireless network quality performance in five out of six geographic regions of the U.S. according to J.D. Power, a leader in independent industry benchmark studies, in its 2016 Wireless Network Quality Performance Study - Volume 2. |
| |
• | Sprint’s LTE Plus Network continued to outperform Verizon, AT&T, and T-Mobile by delivering the fastest LTE download speeds based on recent crowd-sourced data from Nielsen.1 Additionally, Sprint’s reliability beat T-Mobile and performed within 1 percent of AT&T and Verizon. 2 |
| |
• | Independent mobile analytics firm RootMetrics® awarded Sprint 52 percent more first or shared first place RootScore® Awards (from 90 to 137) in the 70 markets measured in the second half of 2016 compared to the prior testing period. 3 |
Sprint’s LTE Plus Network is now available in more than 250 markets and the company has started to deploy three-channel carrier aggregation in such markets as Chicago, San Francisco, Minneapolis, Dallas, Denver, Kansas City, Cleveland, and Columbus. These deployments will provide peak download speeds of more than 200Mbps on capable devices when available. The company currently has 10 three-channel carrier aggregation capable devices, including the recently launched iPhone 7 and Samsung Galaxy S7.
1 Sprint’s analysis of Nielsen NMP data for average LTE download speeds, based on a population weighted average of all 99 Sprint markets in the U.S.
2 Average network reliability (voice & data) based on Sprint’s analysis of Nielsen drive test data in the top 106 metro markets.
3 Rankings based on RootMetrics 70 Metro RootScore Reports (January-October 2016) for mobile performance as tested on best available plans and devices on 4 mobile networks across all available network types. Your experience may vary. The RootMetrics awards are not an endorsement of Sprint. Visit www.rootmetrics.com.
| |
Sprint Quarterly Investor Update - Fiscal 2Q16 | ^indicates results specific to Sprint Platform |
Net operating revenues of $8.2 billion for the quarter were up $272 million year-over-year and $235 million sequentially, as higher equipment revenue was partially offset by lower wireless and wireline service revenue. The growth in equipment revenue both year-over-year and sequentially was primarily driven by higher leasing revenue and more installment billing sales.
Wireless service revenue of $6.0 billion declined $404 million year-over-year and $84 million sequentially. The year-over-year and sequential decreases were driven by lower postpaid phone Average Revenue Per User (ARPU)^, as customers continued to migrate to rate plans offered in conjunction with device financing, partially offset by growth in the postpaid phone customer base. Lower prepaid revenues related to customer losses also impacted year-over-year and sequential service revenue.
Wireline revenues of $521 million for the quarter declined $88 million year-over-year and $24 million sequentially. The year-over-year and sequential declines were primarily driven by lower voice rates and volumes as the company continues to de-emphasize certain voice services.
| |
Sprint Quarterly Investor Update - Fiscal 2Q16 | ^indicates results specific to Sprint Platform |
|
| |
Postpaid phone Average Billings Per User (ABPU)^* of $71.69 for the quarter increased nearly 2 percent year-over-year and was relatively flat sequentially. The year-over-year increase was primarily related to higher billings associated with equipment, partially offset by a shift to service plans offered in conjunction with device financing options. | |
|
|
Postpaid Average Billings Per Account (ABPA)^* of $170.29 for the quarter increased 2 percent year-over-year and was flat sequentially. The year-over-year increase was due to higher equipment billings, in addition to growth in lines per account, partially offset by service plans offered in conjunction with device financing options. |
|
|
Increased 2% Year-Over-Year |
Prepaid Average Revenue Per User (ARPU)^ of $27.31 for the quarter decreased 1 percent year-over-year and was flat sequentially. |
| |
Sprint Quarterly Investor Update - Fiscal 2Q16 | ^indicates results specific to Sprint Platform |
|
| |
Cost of services (COS) of $2.1 billion for the quarter decreased $352 million year-over-year and was flat sequentially. The year-over-year decrease was primarily driven by lower wireless roaming expenses including impacts from the NTelos transaction, the shutdown of the WiMax network, and lower wireline costs, consistent with our decision to de-emphasize certain voice services. Sequentially, savings in wireline and wireless network costs were offset by seasonally higher service and repair and roaming expenses. | |
|
| |
| |
Nearly $600M Reduction Year-Over-Year COS and SG&A
|
|
Selling, general and administrative expenses (SG&A) of $2.0 billion for the quarter decreased by $229 million year-over-year and increased $78 million sequentially. The year-over-year reduction came from several areas of the business, including marketing, information technology, and customer care expenses. The sequential increase was driven by seasonally higher wireless selling expenses and higher bad debt expense related to an increase in installment billing sales, as more bad debt expense is recognized at the point of sale relative to the leasing model.
| |
Sprint Quarterly Investor Update - Fiscal 2Q16 | ^indicates results specific to Sprint Platform |
|
| |
Cost of products of $1.7 billion for the quarter increased $403 million year-over-year and $274 million sequentially. The year-over-year increase is mostly due to lease payments associated with the first sale-leaseback transaction with Mobile Leasing Solutions, LLC (MLS) and fewer leased sales. The sequential increase was primarily due to seasonally higher postpaid sales combined with a lower mix of leasing. | |
|
|
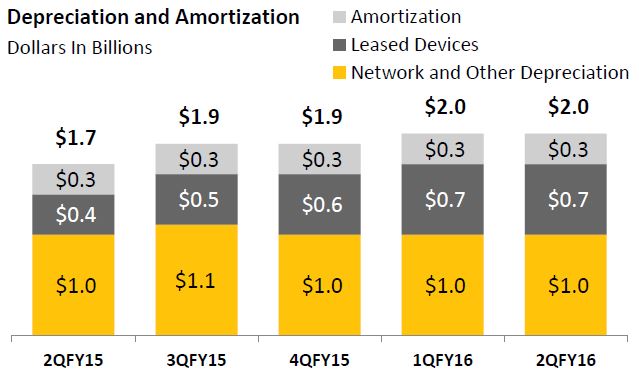
Depreciation and amortization expense of $2.0 billion for the quarter increased $238 million year-over-year and $14 million sequentially. The year-over-year and sequential increases were primarily related to depreciation of devices associated with our leasing options. Leased device depreciation was $724 million in the quarter, $420 million in the prior year, and $644 million in the prior quarter. Due to its off-balance sheet treatment, devices sold in the first transaction with MLS no longer recognize device depreciation and lease payments associated with the devices are recognized in cost of products. Depreciation expense will continue to be recognized on devices sold in the second MLS transaction due to its on-balance sheet treatment. |
|
|
Other, net expense of negative $145 million for the quarter included a pre-tax non-cash gain of $354 million related to spectrum swaps with other carriers that was partially offset by $103 million in litigation and other contingency expenses, as well as $111 million of loss on leased devices, with only the latter impacting Adjusted EBITDA*. |
Sprint Quarterly Investor Update - Fiscal 2Q16
Adjusted EBITDA* was $2.3 billion for the quarter, compared to $2.0 billion in the year-ago period and $2.5 billion in the prior quarter. The year-over-year improvement was primarily due to higher operating revenues and lower cost of services and SG&A expenses, partially offset by higher cost of products expenses. The sequential decline was mostly due to higher cost of products and bad debt expenses associated with higher installment billing sales, partially offset by higher operating revenues.
Operating income of $622 million compared to an operating loss of $2 million in the year-ago period and operating income of $361 million in the prior quarter. The current quarter included a pre-tax non-cash gain of $354 million related to spectrum swaps with other carriers that was partially offset by $103 million in litigation and other contingency expenses. The year-ago period included $267 million of items primarily related to litigation and other contingencies expense and network asset dispositions, while the prior quarter was impacted by $129 million of items, primarily related to contract termination charges associated with the pre-existing wholesale arrangement with Ntelos Holding Corp. Adjusting for items in each period, operating income would have improved by approximately $100 million year-over-year and declined approximately $125 million sequentially.
Net loss of $142 million for the quarter compared to a loss of $585 million in the year-ago period and $302 million in the prior quarter. Adjusting for the after-tax impacts of the aforementioned items, the year-over-year and sequential changes in net losses were directionally in line with the operating income changes.
Sprint Quarterly Investor Update - Fiscal 2Q16
Cash provided by operating activities of $1.7 billion for the quarter compared to $1.7 billion in the year-ago period and $542 million in the prior quarter. Year-over-year, the $39 million improvement was driven by improvements in Adjusted EBITDA* that were offset by unfavorable changes in working capital. The $1.2 billion sequential increase was primarily due to favorable working capital changes.
Adjusted free cash flow* of positive $707 million for the quarter compared to negative $100 million in the year-ago period and positive $466 million in the prior quarter. The $807 million improvement from the prior year was mostly driven by lower capital spending and expense reductions. The $241 million sequential increase was driven by favorable changes to working capital, partially offset by lower net proceeds from device financings. During the quarter, the company made net repayments of $184 million related to device financing and sales of future lease receivables.
Cash capital expenditures were $828 million in the quarter compared to $1.7 billion in the year-ago period and $878 million in the prior quarter. Capital expenditures for leased devices were $358 million in the current quarter compared to $573 million in the year-ago quarter and $405 million in the prior quarter. The year-over-year declines in spending was primarily driven by lower network capital expenditures, while the sequential decline was related to leased devices.
Sprint Quarterly Investor Update - Fiscal 2Q16
Total liquidity was $11.3 billion at the end of the quarter, including $5.7 billion of cash, cash equivalents and short-term investments. Additionally, the company also has $1.1 billion of availability under vendor financing agreements that can be used toward the purchase of 2.5GHz network equipment.
On October 20th, the company priced $3.5 billion of spectrum-backed senior secured notes at 3.36 percent, which is less than half of the company’s current effective interest rate. This transaction represents the latest example of Sprint’s strategy to diversify its sources of financing, lower its cost of capital, and reduce future interest expenses by retiring upcoming maturities with higher coupon payments. In conjunction with closing of the spectrum-backed notes, which is expected on October 27th, the company’s $2.5 billion unsecured financing facility will terminate.
Sprint Quarterly Investor Update - Fiscal 2Q16
Sprint Quarterly Investor Update - Fiscal 2Q16
|
| | | | | | | | | | | |
Wireless Operating Statistics (Unaudited) |
| Quarter To Date | | Year To Date |
Sprint platform (1) | 9/30/16 | 6/30/16 | 9/30/15 | | 9/30/16 | 9/30/15 |
Net additions (losses) (in thousands) | | | | | | |
Postpaid | 344 |
| 180 |
| 378 |
| | 524 |
| 688 |
|
Prepaid | (427 | ) | (331 | ) | (188 | ) | | (758 | ) | (554 | ) |
Wholesale and affiliate | 823 |
| 528 |
| 866 |
| | 1,351 |
| 1,597 |
|
Total Sprint platform wireless net additions | 740 |
| 377 |
| 1,056 |
| | 1,117 |
| 1,731 |
|
End of period connections (in thousands) | | | | | | |
Postpaid (d) | 31,289 |
| 30,945 |
| 30,394 |
| | 31,289 |
| 30,394 |
|
Prepaid (d) | 13,547 |
| 13,974 |
| 15,152 |
| | 13,547 |
| 15,152 |
|
Wholesale and affiliate (d) | 15,357 |
| 14,534 |
| 12,322 |
| | 15,357 |
| 12,322 |
|
Total Sprint platform end of period connections | 60,193 |
| 59,453 |
| 57,868 |
| | 60,193 |
| 57,868 |
|
Churn | | | | | | |
Postpaid | 1.52 | % | 1.56 | % | 1.54 | % | | 1.54 | % | 1.55 | % |
Prepaid | 5.63 | % | 5.55 | % | 5.06 | % | | 5.59 | % | 5.07 | % |
|
| | | | | | | | | | | | | | | | |
Supplemental data - connected devices |
End of period connections (in thousands) |
Retail postpaid | 1,874 |
| 1,822 |
| 1,576 |
| | 1,874 |
| 1,576 |
|
Wholesale and affiliate | 9,951 |
| 9,244 |
| 7,338 |
| | 9,951 |
| 7,338 |
|
Total | 11,825 |
| 11,066 |
| 8,914 |
| | 11,825 |
| 8,914 |
|
Supplemental data - total company | | | | | | |
End of period connections (in thousands) | | | | | | |
Sprint platform (1)(d) | 60,193 |
| 59,453 |
| 57,868 |
| | 60,193 |
| 57,868 |
|
Transactions (2) | — |
| — |
| 710 |
| | — |
| 710 |
|
Total | 60,193 |
| 59,453 |
| 58,578 |
| | 60,193 |
| 58,578 |
|
Sprint platform ARPU (1) (a) | | | | | | |
Postpaid | $ | 50.54 |
| $ | 51.54 |
| $ | 53.99 |
| | $ | 51.04 |
| $ | 54.73 |
|
Prepaid | $ | 27.31 |
| $ | 27.34 |
| $ | 27.66 |
| | $ | 27.32 |
| $ | 27.73 |
|
Sprint platform postpaid phone (1) | | | | | | |
Postpaid phone net additions | 347 |
| 173 |
| 62 |
| | 520 |
| 50 |
|
Postpaid phone end of period connections (d) | 25,669 |
| 25,322 |
| 24,928 |
| | 25,669 |
| 24,928 |
|
Postpaid phone churn | 1.37 | % | 1.39 | % | 1.49 | % | | 1.38 | % | 1.49 | % |
|
| | | | | | | | | | | | | | | | |
NON-GAAP RECONCILIATION - ABPA*, POSTPAID PHONE ARPU AND ABPU* (Unaudited) (Millions, except accounts, connections, ABPA*, ARPU, and ABPU*) |
| Quarter To Date | | Year To Date |
| 9/30/16 | 6/30/16 | 9/30/15 | | 9/30/16 | 9/30/15 |
Sprint platform ABPA* (1) | | | | | | |
Postpaid service revenue | $ | 4,720 |
| $ | 4,778 |
| $ | 4,893 |
| | $ | 9,498 |
| $ | 9,857 |
|
Add: Installment plan billings | 274 |
| 264 |
| 305 |
| | 538 |
| 603 |
|
Add: Lease revenue | 811 |
| 755 |
| 389 |
| | 1,566 |
| 645 |
|
Total for Sprint platform postpaid connections | $ | 5,805 |
| $ | 5,797 |
| $ | 5,587 |
| | $ | 11,602 |
| $ | 11,105 |
|
|
|
|
|
|
|
| |
|
|
|
|
Sprint platform postpaid accounts (in thousands) | 11,363 |
| 11,329 |
| 11,197 |
| | 11,346 |
| 11,186 |
|
Sprint platform postpaid ABPA* (b) | $ | 170.29 |
| $ | 170.56 |
| $ | 166.26 |
| | $ | 170.43 |
| $ | 165.45 |
|
|
| | | | | | | | | | | | | | | | |
| Quarter To Date | | Year To Date |
| 9/30/16 | 6/30/16 | 9/30/15 | | 9/30/16 | 9/30/15 |
Sprint platform postpaid phone ARPU and ABPU* (1) | | | | | | |
Postpaid phone service revenue | $ | 4,441 |
| $ | 4,489 |
| $ | 4,608 |
| | $ | 8,930 |
| $ | 9,290 |
|
Add: Installment plan billings | 248 |
| 243 |
| 286 |
| | 491 |
| 568 |
|
Add: Lease revenue | 797 |
| 741 |
| 379 |
| | 1,538 |
| 628 |
|
Total for Sprint platform postpaid phone connections | $ | 5,486 |
| $ | 5,473 |
| $ | 5,273 |
| | $ | 10,959 |
| $ | 10,486 |
|
|
|
|
|
|
|
| |
|
|
|
|
Sprint platform postpaid average phone connections (in thousands) | 25,514 |
| 25,275 |
| 24,886 |
| | 25,394 |
| 24,871 |
|
Sprint platform postpaid phone ARPU (a) | $ | 58.03 |
| $ | 59.20 |
| $ | 61.71 |
| | $ | 58.61 |
| $ | 62.25 |
|
Sprint platform postpaid phone ABPU* (c) | $ | 71.69 |
| $ | 72.17 |
| $ | 70.62 |
| | $ | 71.93 |
| $ | 70.27 |
|
(a) ARPU is calculated by dividing service revenue by the sum of the monthly average number of connections in the applicable service category. Changes in average monthly service revenue reflect connections for either the postpaid or prepaid service category who change rate plans, the level of voice and data usage, the amount of service credits which are offered to connections, plus the net effect of average monthly revenue generated by new connections and deactivating connections. Sprint platform postpaid phone ARPU represents revenues related to our postpaid phone connections.
(b) Sprint platform postpaid ABPA* is calculated by dividing service revenue earned from connections plus installment plan billings and lease revenue by the sum of the monthly average number of accounts during the period.
(c) Sprint platform postpaid phone ABPU* is calculated by dividing postpaid phone service revenue earned from postpaid phone connections plus installment plan billings and lease revenue by the sum of the monthly average number of postpaid phone connections during the period.
(d) As part of the transaction involving Shenandoah Telecommunications Company (Shentel), 186,000 and 92,000 subscribers were transferred in May 2016 from postpaid and prepaid, respectively, to affiliates. An additional 270,000 nTelos' subscribers are now part of our affiliate relationship with Shentel and are being reported in wholesale and affiliate subscribers during the quarter ended June 30, 2016.
Sprint Quarterly Investor Update - Fiscal 2Q16
|
| | | | | | | | | | | | | | | | |
Wireless Device Financing Summary (Unaudited) (Millions, except sales, connections, and sales and connections mix) |
| Quarter To Date | | Year To Date |
| 9/30/16 | 6/30/16 | 9/30/15 | | 9/30/16 | 9/30/15 |
Postpaid sales (in thousands) | 3,747 |
| 3,268 |
| 4,117 |
| | 7,015 |
| 8,157 |
|
Postpaid sales mix | | | | | | |
Subsidy/other | 27 | % | 31 | % | 36 | % | | 29 | % | 36 | % |
Installment plans | 34 | % | 25 | % | 13 | % | | 30 | % | 13 | % |
Leasing | 39 | % | 44 | % | 51 | % | | 41 | % | 51 | % |
| | | | | | |
Installment plans | | | | | | |
Installment sales financed | $ | 745 |
| $ | 407 |
| $ | 242 |
| | $ | 1,152 |
| $ | 497 |
|
Installment billings | 274 |
| 264 |
| 305 |
| | 538 |
| 603 |
|
Installments receivables, net | — |
| — |
| 1,113 |
| | — |
| 1,113 |
|
| | | | | | |
Leasing | | | | | | |
Lease revenue | $ | 811 |
| $ | 755 |
| $ | 389 |
| | $ | 1,566 |
| $ | 645 |
|
Lease depreciation | 724 |
| 644 |
| 420 |
| | 1,368 |
| 696 |
|
| | | | | | |
Leased device additions: | | | | | | |
Cash paid for capital expenditures - leased devices | $ | 358 |
| $ | 405 |
| $ | 573 |
| | $ | 763 |
| $ | 1,117 |
|
Transfers from inventory - leased devices | 645 |
| 541 |
| 742 |
| | 1,186 |
| 1,550 |
|
| | | | | | |
Leased devices in property, plant and equipment, net | $ | 3,759 |
| $ | 3,766 |
| $ | 3,609 |
| | $ | 3,759 |
| $ | 3,609 |
|
| | | | | | |
Leased device net proceeds | | | | | | |
Proceeds from MLS sale | $ | — |
| $ | 1,055 |
| $ | — |
| | $ | 1,055 |
| $ | — |
|
Repayments to MLS | (161 | ) | (165 | ) | — |
| | (326 | ) | — |
|
Proceeds from lease securitization | — |
| — |
| — |
| | — |
| — |
|
Repayments of lease securitization | (23 | ) | (75 | ) | — |
| | (98 | ) | — |
|
Net (repayments) proceeds of device financings and sales of future lease receivables | $ | (184 | ) | $ | 815 |
| $ | — |
| | $ | 631 |
| $ | — |
|
Sprint Quarterly Investor Update - Fiscal 2Q16
|
| | | | | | | | | | | | | | | | |
CONDENSED CONSOLIDATED STATEMENTS OF OPERATIONS (Unaudited) (Millions, except per share data) |
| Quarter To Date | | Year To Date |
| 9/30/16 | 6/30/16 | 9/30/15 | | 9/30/16 | 9/30/15 |
Net operating revenues | | | | | | |
Service revenue | 6,413 |
| 6,516 |
| 6,880 |
| | $ | 12,929 |
| $ | 13,917 |
|
Equipment revenue | 1,834 |
| 1,496 |
| 1,095 |
| | 3,330 |
| 2,085 |
|
Total net operating revenues | 8,247 |
| 8,012 |
| 7,975 |
|
| 16,259 |
| 16,002 |
|
Net operating expenses | | | | | | |
Cost of services (exclusive of depreciation and amortization below) | 2,101 |
| 2,099 |
| 2,453 |
| | 4,200 |
| 4,846 |
|
Cost of products (exclusive of depreciation and amortization below) | 1,693 |
| 1,419 |
| 1,290 |
| | 3,112 |
| 2,655 |
|
Selling, general and administrative | 1,995 |
| 1,917 |
| 2,224 |
| | 3,912 |
| 4,411 |
|
Depreciation - network and other | 986 |
| 1,036 |
| 992 |
| | 2,022 |
| 1,957 |
|
Depreciation - leased devices | 724 |
| 644 |
| 420 |
| | 1,368 |
| 696 |
|
Amortization | 271 |
| 287 |
| 331 |
| | 558 |
| 678 |
|
Other, net | (145 | ) | 249 |
| 267 |
| | 104 |
| 260 |
|
Total net operating expenses | 7,625 |
| 7,651 |
| 7,977 |
|
| 15,276 |
| 15,503 |
|
Operating income (loss) | 622 |
| 361 |
| (2 | ) | | 983 |
| 499 |
|
Interest expense | (630 | ) | (615 | ) | (542 | ) | | (1,245 | ) | (1,084 | ) |
Other (expense) income, net | (15 | ) | 8 |
| 5 |
| | (7 | ) | 9 |
|
Loss before income taxes | (23 | ) | (246 | ) | (539 | ) | | (269 | ) | (576 | ) |
Income tax expense | (119 | ) | (56 | ) | (46 | ) | | (175 | ) | (29 | ) |
Net loss | (142 | ) | (302 | ) | (585 | ) |
| $ | (444 | ) | $ | (605 | ) |
| | | | | | |
Basic and diluted net loss per common share | $ | (0.04 | ) | $ | (0.08 | ) | $ | (0.15 | ) | | $ | (0.11 | ) | $ | (0.15 | ) |
Weighted average common shares outstanding | 3,979 |
| 3,975 |
| 3,969 |
| | 3,977 |
| 3,968 |
|
Effective tax rate | -517.4 | % | -22.8 | % | -8.5 | % | | -65.1 | % | -5.0 | % |
|
| | | | | | | | | | | | | | | | |
NON-GAAP RECONCILIATION - NET LOSS TO ADJUSTED EBITDA* (Unaudited) (Millions) |
| Quarter To Date | | Year To Date |
| 9/30/16 | 6/30/16 | 9/30/15 | | 9/30/16 | 9/30/15 |
Net loss | $ | (142 | ) | $ | (302 | ) | $ | (585 | ) | | $ | (444 | ) | $ | (605 | ) |
Income tax expense | 119 |
| 56 |
| 46 |
| | 175 |
| 29 |
|
Loss before income taxes | (23 | ) | (246 | ) | (539 | ) |
| (269 | ) | (576 | ) |
Other expense (income), net | 15 |
| (8 | ) | (5 | ) | | 7 |
| (9 | ) |
Interest expense | 630 |
| 615 |
| 542 |
| | 1,245 |
| 1,084 |
|
Operating income (loss) | 622 |
| 361 |
| (2 | ) |
| 983 |
| 499 |
|
Depreciation - network and other | 986 |
| 1,036 |
| 992 |
| | 2,022 |
| 1,957 |
|
Depreciation - leased devices | 724 |
| 644 |
| 420 |
| | 1,368 |
| 696 |
|
Amortization | 271 |
| 287 |
| 331 |
| | 558 |
| 678 |
|
EBITDA* (3) | 2,603 |
| 2,328 |
| 1,741 |
|
| 4,931 |
| 3,830 |
|
(Gain) loss from asset dispositions and exchanges, net (4) | (354 | ) | — |
| 85 |
| | (354 | ) | 85 |
|
Severance and exit costs (5) | (5 | ) | 16 |
| 25 |
| | 11 |
| 38 |
|
Contract terminations (6) | — |
| 113 |
| — |
| | 113 |
| — |
|
Litigation and other contingencies (7) | 103 |
| — |
| 157 |
| | 103 |
| 157 |
|
Reduction in liability - U.S. Cellular asset acquisition (8) | — |
| — |
| — |
| | — |
| (20 | ) |
Adjusted EBITDA* (3) | $ | 2,347 |
| $ | 2,457 |
| $ | 2,008 |
|
| $ | 4,804 |
| $ | 4,090 |
|
Adjusted EBITDA margin* | 36.6 | % | 37.7 | % | 29.2 | % | | 37.2 | % | 29.4 | % |
Selected items: | | | | | | |
Cash paid for capital expenditures - network and other | $ | 470 |
| $ | 473 |
| $ | 1,162 |
| | $ | 943 |
| $ | 2,964 |
|
Cash paid for capital expenditures - leased devices | $ | 358 |
| $ | 405 |
| $ | 573 |
| | $ | 763 |
| $ | 1,117 |
|
Sprint Quarterly Investor Update - Fiscal 2Q16
|
| | | | | | | | | | | | | | | | |
WIRELESS STATEMENTS OF OPERATIONS (Unaudited) (Millions) |
| Quarter To Date | | Year To Date |
| 9/30/16 | 6/30/16 | 9/30/15 | | 9/30/16 | 9/30/15 |
Net operating revenues | | | | | | |
Service revenue | | | | | | |
Sprint platform (1): |
|
|
|
|
|
| |
|
|
|
|
Postpaid | $ | 4,720 |
| $ | 4,778 |
| $ | 4,893 |
| | $ | 9,498 |
| $ | 9,857 |
|
Prepaid | 1,129 |
| 1,165 |
| 1,259 |
| | 2,294 |
| 2,559 |
|
Wholesale, affiliate and other | 168 |
| 158 |
| 185 |
| | 326 |
| 366 |
|
Total Sprint platform | 6,017 |
| 6,101 |
| 6,337 |
|
| 12,118 |
| 12,782 |
|
| | | | | | |
Total transactions (2) | — |
| — |
| 84 |
| | — |
| 189 |
|
Total service revenue | 6,017 |
| 6,101 |
| 6,421 |
|
| 12,118 |
| 12,971 |
|
| | | | | | |
Equipment revenue | 1,834 |
| 1,496 |
| 1,095 |
| | 3,330 |
| 2,085 |
|
Total net operating revenues | 7,851 |
| 7,597 |
| 7,516 |
|
| 15,448 |
| 15,056 |
|
| | | | | | |
Net operating expenses | | | | | | |
Cost of services (exclusive of depreciation and amortization below) | 1,793 |
| 1,784 |
| 2,111 |
| | 3,577 |
| 4,116 |
|
Cost of products (exclusive of depreciation and amortization below) | 1,693 |
| 1,419 |
| 1,290 |
| | 3,112 |
| 2,655 |
|
Selling, general and administrative | 1,931 |
| 1,834 |
| 2,136 |
| | 3,765 |
| 4,232 |
|
Depreciation - network and other | 936 |
| 985 |
| 943 |
| | 1,921 |
| 1,860 |
|
Depreciation - leased devices | 724 |
| 644 |
| 420 |
| | 1,368 |
| 696 |
|
Amortization | 271 |
| 287 |
| 331 |
| | 558 |
| 678 |
|
Other, net | (151 | ) | 249 |
| 266 |
| | 98 |
| 258 |
|
Total net operating expenses | 7,197 |
| 7,202 |
| 7,497 |
|
| 14,399 |
| 14,495 |
|
Operating income | $ | 654 |
| $ | 395 |
| $ | 19 |
|
| $ | 1,049 |
| $ | 561 |
|
|
| | | | | | | | | | | | | | | | |
WIRELESS NON-GAAP RECONCILIATION (Unaudited) (Millions) |
| Quarter To Date | | Year To Date |
| 9/30/16 | 6/30/16 | 9/30/15 | | 9/30/16 | 9/30/15 |
| | | | | | |
Operating income | $ | 654 |
| $ | 395 |
| $ | 19 |
| | $ | 1,049 |
| $ | 561 |
|
(Gain) loss from asset dispositions and exchanges, net (4) | (354 | ) | — |
| 85 |
| | (354 | ) | 85 |
|
Severance and exit costs (5) | (11 | ) | 16 |
| 24 |
| | 5 |
| 36 |
|
Contract terminations (6) | — |
| 113 |
| — |
| | 113 |
| — |
|
Litigation and other contingencies (7) | 103 |
| — |
| 157 |
| | 103 |
| 157 |
|
Reduction in liability - U.S. Cellular asset acquisition (8) | — |
| — |
| — |
| | — |
| (20 | ) |
Depreciation - network and other | 936 |
| 985 |
| 943 |
| | 1,921 |
| 1,860 |
|
Depreciation - leased devices | 724 |
| 644 |
| 420 |
| | 1,368 |
| 696 |
|
Amortization | 271 |
| 287 |
| 331 |
| | 558 |
| 678 |
|
Adjusted EBITDA* (3) | $ | 2,323 |
| $ | 2,440 |
| $ | 1,979 |
|
| $ | 4,763 |
| $ | 4,053 |
|
Adjusted EBITDA margin* | 38.6 | % | 40.0 | % | 30.8 | % | | 39.3 | % | 31.2 | % |
Selected items: | | | | | | |
Cash paid for capital expenditures - network and other | $ | 358 |
| $ | 376 |
| $ | 1,003 |
| | $ | 734 |
| $ | 2,643 |
|
Cash paid for capital expenditures - leased devices | $ | 358 |
| $ | 405 |
| $ | 573 |
| | $ | 763 |
| $ | 1,117 |
|
Sprint Quarterly Investor Update - Fiscal 2Q16
|
| | | | | | | | | | | | | | | | |
WIRELINE STATEMENTS OF OPERATIONS (Unaudited) (Millions) |
| Quarter To Date | | Year To Date |
| 9/30/16 | 6/30/16 | 9/30/15 | | 9/30/16 | 9/30/15 |
Net operating revenues | | | | | | |
Voice | $ | 172 |
| $ | 181 |
| $ | 212 |
| | $ | 353 |
| $ | 445 |
|
Data | 43 |
| 43 |
| 43 |
| | 86 |
| 92 |
|
Internet | 288 |
| 302 |
| 323 |
| | 590 |
| $ | 651 |
|
Other | 18 |
| 19 |
| 31 |
| | 37 |
| 51 |
|
Total net operating revenues | 521 |
| 545 |
| 609 |
|
| 1,066 |
| 1,239 |
|
| | | | | | |
Net operating expenses | | | | | | |
Costs of services (exclusive of depreciation and amortization below) | 436 |
| 448 |
| 495 |
| | 884 |
| 1,029 |
|
Selling, general and administrative | 62 |
| 78 |
| 85 |
| | 140 |
| 172 |
|
Depreciation and amortization | 48 |
| 49 |
| 48 |
| | 97 |
| 94 |
|
Other, net | 7 |
| — |
| 1 |
| | 7 |
| 2 |
|
Total net operating expenses | 553 |
| 575 |
| 629 |
|
| 1,128 |
| 1,297 |
|
Operating loss | $ | (32 | ) | $ | (30 | ) | $ | (20 | ) |
| $ | (62 | ) | $ | (58 | ) |
|
| | | | | | | | | | | | | | | | |
WIRELINE NON-GAAP RECONCILIATION (Unaudited) (Millions) |
| Quarter To Date | | Year To Date |
| 9/30/16 | 6/30/16 | 9/30/15 | | 9/30/16 | 9/30/15 |
Operating loss | $ | (32 | ) | $ | (30 | ) | $ | (20 | ) | | $ | (62 | ) | $ | (58 | ) |
Severance and exit costs (5) | 7 |
| — |
| 1 |
| | 7 |
| 2 |
|
Depreciation and amortization | 48 |
| 49 |
| 48 |
| | 97 |
| 94 |
|
Adjusted EBITDA* | $ | 23 |
| $ | 19 |
| $ | 29 |
|
| $ | 42 |
| $ | 38 |
|
Adjusted EBITDA margin* | 4.4 | % | 3.5 | % | 4.8 | % | | 3.9 | % | 3.1 | % |
Selected items: | | | | | | |
Cash paid for capital expenditures - network and other | $ | 31 |
| $ | 20 |
| $ | 63 |
| | $ | 51 |
| $ | 131 |
|
Sprint Quarterly Investor Update - Fiscal 2Q16
|
| | | | | | |
CONDENSED CONSOLIDATED CASH FLOW INFORMATION (Unaudited)** (Millions) |
| Year To Date |
| 9/30/16 | 9/30/15 |
Operating activities | | |
Net loss | $ | (444 | ) | $ | (605 | ) |
Depreciation and amortization | 3,948 |
| 3,331 |
|
Provision for losses on accounts receivable | 232 |
| 278 |
|
Share-based and long-term incentive compensation expense | 29 |
| 40 |
|
Deferred income tax expense | 157 |
| 28 |
|
Gains from asset dispositions and exchanges | (354 | ) | — |
|
Amortization of long-term debt premiums, net | (159 | ) | (157 | ) |
Loss on disposal of property, plant and equipment | 231 |
| 85 |
|
Contract terminations | 96 |
| — |
|
Other changes in assets and liabilities: | | |
Accounts and notes receivable | (126 | ) | (1,357 | ) |
Inventories and other current assets | (892 | ) | (1,025 | ) |
Deferred purchase price from sale of receivables | (400 | ) | 1,198 |
|
Accounts payable and other current liabilities | (195 | ) | (509 | ) |
Non-current assets and liabilities, net | (205 | ) | 125 |
|
Other, net | 332 |
| 365 |
|
Net cash provided by operating activities | 2,250 |
| 1,797 |
|
Investing activities |
|
| |
Capital expenditures - network and other | (943 | ) | (2,964 | ) |
Capital expenditures - leased devices | (763 | ) | (1,117 | ) |
Expenditures relating to FCC licenses | (32 | ) | (45 | ) |
Change in short-term investments, net | (1,650 | ) | 63 |
|
Proceeds from sales of assets and FCC licenses | 66 |
| 4 |
|
Other, net | (36 | ) | (21 | ) |
Net cash used in investing activities | (3,358 | ) | (4,080 | ) |
Financing activities | | |
Proceeds from debt and financings | 3,278 |
| 434 |
|
Repayments of debt, financing and capital lease obligations | (667 | ) | (206 | ) |
Debt financing costs | (175 | ) | (1 | ) |
Other, net | 37 |
| 18 |
|
Net cash provided by financing activities | 2,473 |
| 245 |
|
| | |
Net increase (decrease) in cash and cash equivalents | 1,365 |
| (2,038 | ) |
| | |
Cash and cash equivalents, beginning of period | 2,641 |
| 4,010 |
|
Cash and cash equivalents, end of period | $ | 4,006 |
| $ | 1,972 |
|
|
| | | | | | | | | | | | | | | | |
RECONCILIATION TO CONSOLIDATED FREE CASH FLOW* (NON-GAAP) (Unaudited) (Millions) | | | | |
| Quarter To Date | | Year To Date |
| 9/30/16 | 6/30/16 | 9/30/15 | | 9/30/16 | 9/30/15 |
Net cash provided by operating activities | $ | 1,708 |
| $ | 542 |
| $ | 1,669 |
| | $ | 2,250 |
| $ | 1,797 |
|
| | | | | | |
Capital expenditures - network and other | (470 | ) | (473 | ) | (1,162 | ) | | (943 | ) | (2,964 | ) |
Capital expenditures - leased devices | (358 | ) | (405 | ) | (573 | ) | | (763 | ) | (1,117 | ) |
Expenditures related to FCC licenses, net | (17 | ) | (15 | ) | (19 | ) | | (32 | ) | (45 | ) |
Proceeds from sales of assets and FCC licenses | 39 |
| 27 |
| 3 |
| | 66 |
| 4 |
|
Other investing activities, net | (11 | ) | (25 | ) | (18 | ) | | (36 | ) | (21 | ) |
Free cash flow* | $ | 891 |
| $ | (349 | ) | $ | (100 | ) |
| $ | 542 |
| $ | (2,346 | ) |
| | | | | | |
Net (repayments) proceeds of device financings and sales of future lease receivables | (184 | ) | 815 |
| — |
| | 631 |
| — |
|
Adjusted free cash flow* | $ | 707 |
| $ | 466 |
| $ | (100 | ) |
| $ | 1,173 |
| $ | (2,346 | ) |
**Certain prior period amounts have been reclassified to conform to the current period presentation.
Sprint Quarterly Investor Update - Fiscal 2Q16
|
| | | | | | |
CONDENSED CONSOLIDATED BALANCE SHEETS (Unaudited) (Millions) |
| |
| 9/30/16 | 3/31/16 |
ASSETS | | |
Current assets | | |
Cash and cash equivalents | $ | 4,006 |
| $ | 2,641 |
|
Short-term investments | 1,650 |
| — |
|
Accounts and notes receivable, net | 1,004 |
| 1,099 |
|
Device and accessory inventory | 981 |
| 1,173 |
|
Prepaid expenses and other current assets | 2,215 |
| 1,920 |
|
Total current assets | 9,856 |
| 6,833 |
|
| | |
Property, plant and equipment, net | 19,176 |
| 20,297 |
|
Goodwill | 6,575 |
| 6,575 |
|
FCC licenses and other | 40,541 |
| 40,073 |
|
Definite-lived intangible assets, net | 3,861 |
| 4,469 |
|
Other assets | 819 |
| 728 |
|
Total assets | $ | 80,828 |
| $ | 78,975 |
|
| | |
LIABILITIES AND STOCKHOLDERS' EQUITY | | |
Current liabilities | | |
Accounts payable | $ | 2,649 |
| $ | 2,899 |
|
Accrued expenses and other current liabilities | 4,285 |
| 4,374 |
|
Current portion of long-term debt, financing and capital lease obligations | 7,014 |
| 4,690 |
|
Total current liabilities | 13,948 |
| 11,963 |
|
| | |
Long-term debt, financing and capital lease obligations | 29,541 |
| 29,268 |
|
Deferred tax liabilities | 14,120 |
| 13,959 |
|
Other liabilities | 3,796 |
| 4,002 |
|
Total liabilities | 61,405 |
| 59,192 |
|
Stockholders' equity | | |
Common stock | 40 |
| 40 |
|
Treasure shares, at cost | — |
| (3 | ) |
Paid-in capital | 27,637 |
| 27,563 |
|
Accumulated deficit | (7,822 | ) | (7,378 | ) |
Accumulated other comprehensive loss | (432 | ) | (439 | ) |
Total stockholders' equity | 19,423 |
| 19,783 |
|
Total liabilities and stockholders' equity | $ | 80,828 |
| $ | 78,975 |
|
|
| | | | | | |
NET DEBT* (NON-GAAP) (Unaudited) (Millions) |
| 9/30/16 | 3/31/16 |
Total debt | $ | 36,555 |
| $ | 33,958 |
|
Less: Cash and cash equivalents | (4,006 | ) | (2,641 | ) |
Less: Short-term investments | (1,650 | ) | — |
|
Net debt* | $ | 30,899 |
| $ | 31,317 |
|
Sprint Quarterly Investor Update - Fiscal 2Q16
|
| | | | |
SCHEDULE OF DEBT (Unaudited) (Millions) |
| | 9/30/2016 |
| MATURITY | PRINCIPAL |
ISSUER | | |
Sprint Corporation | | |
7.25% Senior notes due 2021 | 09/15/2021 | $ | 2,250 |
|
7.875% Senior notes due 2023 | 09/15/2023 | 4,250 |
|
7.125% Senior notes due 2024 | 06/15/2024 | 2,500 |
|
7.625% Senior notes due 2025 | 02/15/2025 | 1,500 |
|
Sprint Corporation | | 10,500 |
|
| | |
Sprint Communications, Inc. | | |
Export Development Canada Facility (Tranche 4) | 12/15/2017 | 250 |
|
Export Development Canada Facility (Tranche 3) | 12/17/2019 | 300 |
|
6% Senior notes due 2016 | 12/01/2016 | 2,000 |
|
9.125% Senior notes due 2017 | 03/01/2017 | 1,000 |
|
8.375% Senior notes due 2017 | 08/15/2017 | 1,300 |
|
9% Guaranteed notes due 2018 | 11/15/2018 | 3,000 |
|
7% Guaranteed notes due 2020 | 03/01/2020 | 1,000 |
|
7% Senior notes due 2020 | 08/15/2020 | 1,500 |
|
11.5% Senior notes due 2021 | 11/15/2021 | 1,000 |
|
9.25% Debentures due 2022 | 04/15/2022 | 200 |
|
6% Senior notes due 2022 | 11/15/2022 | 2,280 |
|
Sprint Communications, Inc. | | 13,830 |
|
| | |
Sprint Capital Corporation | | |
6.9% Senior notes due 2019 | 05/01/2019 | 1,729 |
|
6.875% Senior notes due 2028 | 11/15/2028 | 2,475 |
|
8.75% Senior notes due 2032 | 03/15/2032 | 2,000 |
|
Sprint Capital Corporation | | 6,204 |
|
| | |
Clearwire Communications LLC | | |
14.75% First-priority senior secured notes due 2016 | 12/01/2016 | 300 |
|
8.25% Exchangeable notes due 2040 | 12/01/2040 | 629 |
|
Clearwire Communications LLC | | 929 |
|
| | |
Secured equipment credit facilities | 2017 - 2021 | 618 |
|
| | |
Financing obligations | 2017 - 2021 | 3,670 |
|
| | |
Capital leases and other obligations | 2016 - 2023 | 471 |
|
Total principal | | 36,222 |
|
| | |
Net premiums and debt financing costs |
| 333 |
|
Total debt | | $ | 36,555 |
|
*This table excludes (i) our unsecured revolving credit facility, which will expire in 2018 and has no outstanding balance, (ii) $309M in letters of credit outstanding under the revolving credit facility, (iii) our $2.5 billion unsecured credit facility, which will expire in 2017 and has no outstanding balance, (iv) outstanding financing obligations of approximately $3.7 billion, (v) $471 million of capital leases and other obligations, and (vi) net premiums and debt financing costs.
Sprint Quarterly Investor Update - Fiscal 2Q16
NOTES TO THE FINANCIAL INFORMATION (Unaudited)
| |
(1) | Sprint platform refers to the Sprint network that supports the wireless service we provide through our multiple brands. |
| |
(2) | Postpaid and prepaid connections from transactions are defined as retail postpaid and prepaid connections acquired from Clearwire in July 2013 who had not deactivated or been recaptured on the Sprint platform. |
| |
(3) | As more of our customers elect to lease a device rather than purchasing one under our subsidized program, there is a significant positive impact to EBITDA* and Adjusted EBITDA* from direct channel sales primarily due to the fact the cost of the device is not recorded as cost of products but rather is depreciated over the customer lease term. Under our device leasing program for the direct channel, devices are transferred from inventory to property and equipment and the cost of the leased device is recognized as depreciation expense over the customer lease term to an estimated residual value. The customer payments are recognized as revenue over the term of the lease. Under our subsidized program, the cash received from the customer for the device is recognized as equipment revenue at the point of sale and the cost of the device is recognized as cost of products. During the three and six-month periods ended September 30, 2016, we leased devices through our Sprint direct channels totaling approximately $645 million and $1,186 million, respectively, which would have increased cost of products and reduced EBITDA* if they had been purchased under our subsidized program. Also, during the three and six-month periods ended September 30, 2016, the equipment revenue derived from customers electing to finance their devices through device leasing or installment billing programs in our direct channel was 68%. |
The impact to EBITDA* and Adjusted EBITDA* resulting from the sale of devices under our installment billing program is generally neutral except for the impact from the time value of money element related to the imputed interest on the installment receivable.
| |
(4) | During the second quarter of fiscal year 2016 the company recorded a pre-tax non-cash gain of $354 million related to spectrum swaps with other carriers. During the second quarter of fiscal year 2015, the company recorded losses on dispositions of assets primarily related to network development costs that are no longer relevant as a result of changes in the company's network plans. |
| |
(5) | Severance and exit costs consist of lease exit costs primarily associated with tower and cell sites, access exit costs related to payments that will continue to be made under the company's backhaul access contracts for which the company will no longer be receiving any economic benefit, and severance costs associated with reduction in its work force. |
| |
(6) | Contract terminations primarily relate to the termination of our pre-existing wholesale arrangement with Ntelos Holding Corp. |
| |
(7) | Litigation and other contingencies consist of unfavorable developments associated with legal as well as federal and state matters such as sales, use or property taxes. |
| |
(8) | As a result of the U.S. Cellular asset acquisition, we recorded a liability related to network shut-down costs, which primarily consisted of lease exit costs, for which we agreed to reimburse U.S. Cellular. During the third quarter of fiscal year 2014, we identified favorable trends in actual costs and, as a result, reduced the liability resulting in a gain of approximately $41 million. During the first quarter of fiscal year 2015, we revised our estimate and, as a result, reduced the liability resulting in approximately $20 million of income. |
Sprint Quarterly Investor Update - Fiscal 2Q16
*FINANCIAL MEASURES
Sprint provides financial measures determined in accordance with GAAP and adjusted GAAP (non-GAAP). The non-GAAP financial measures reflect industry conventions, or standard measures of liquidity, profitability or performance commonly used by the investment community for comparability purposes. These measurements should be considered in addition to, but not as a substitute for, financial information prepared in accordance with GAAP. We have defined below each of the non-GAAP measures we use, but these measures may not be synonymous to similar measurement terms used by other companies.
Sprint provides reconciliations of these non-GAAP measures in its financial reporting. Because Sprint does not predict special items that might occur in the future, and our forecasts are developed at a level of detail different than that used to prepare GAAP-based financial measures, Sprint does not provide reconciliations to GAAP of its forward-looking financial measures.
The measures used in this release include the following:
EBITDA is operating income/(loss) before depreciation and amortization. Adjusted EBITDA is EBITDA excluding severance, exit costs, and other special items. Adjusted EBITDA Margin represents Adjusted EBITDA divided by non-equipment net operating revenues for Wireless and Adjusted EBITDA divided by net operating revenues for Wireline. We believe that Adjusted EBITDA and Adjusted EBITDA Margin provide useful information to investors because they are an indicator of the strength and performance of our ongoing business operations. While depreciation and amortization are considered operating costs under GAAP, these expenses primarily represent non-cash current period costs associated with the use of long-lived tangible and definite-lived intangible assets. Adjusted EBITDA and Adjusted EBITDA Margin are calculations commonly used as a basis for investors, analysts and credit rating agencies to evaluate and compare the periodic and future operating performance and value of companies within the telecommunications industry.
Sprint Platform Postpaid ABPA is average billings per account and calculated by dividing postpaid service revenue earned from postpaid customers plus installment plan billings and lease revenue by the sum of the monthly average number of postpaid accounts during the period. We believe that ABPA provides useful information to investors, analysts and our management to evaluate average Sprint platform postpaid customer billings per account as it approximates the expected cash collections, including installment plan billings and lease revenue, per postpaid account each month.
Sprint Platform Postpaid Phone ABPU is average billings per postpaid phone user and calculated by dividing service revenue earned from postpaid phone customers plus installment plan billings and lease revenue by the sum of the monthly average number of postpaid phone connections during the period. We believe that ABPU provides useful information to investors, analysts and our management to evaluate average Sprint platform postpaid phone customer billings as it approximates the expected cash collections, including installment plan billings and lease revenue, per postpaid phone user each month.
Free Cash Flow is the cash provided by operating activities less the cash used in investing activities other than short-term investments, including changes in restricted cash, if any, and excluding the sale-leaseback of devices. Adjusted Free Cash Flow is Free Cash Flow plus the proceeds from device financings and sales of future lease receivables, net of repayments. We believe that Free Cash Flow and Adjusted Free Cash Flow provide useful information to investors, analysts and our management about the cash generated by our core operations and net proceeds obtained to fund certain leased devices, respectively, after interest and dividends, if any, and our ability to fund scheduled debt maturities and other financing activities, including discretionary refinancing and retirement of debt and purchase or sale of investments.
Net Debt is consolidated debt, including current maturities, less cash and cash equivalents, short-term investments and, if any, restricted cash. We believe that Net Debt provides useful information to investors, analysts and credit rating agencies about the capacity of the company to reduce the debt load and improve its capital structure.
Sprint Quarterly Investor Update - Fiscal 2Q16
SAFE HARBOR
This release includes “forward-looking statements” within the meaning of the securities laws. The words “may,” “could,” “should,” “estimate,” “project,” “forecast,” “intend,” “expect,” “anticipate,” “believe,” “target,” “plan”, “outlook,” “providing guidance,” and similar expressions are intended to identify information that is not historical in nature. All statements that address operating performance, events or developments that we expect or anticipate will occur in the future - including statements relating to our network, connections growth, and liquidity; and statements expressing general views about future operating results - are forward-looking statements. Forward-looking statements are estimates and projections reflecting management’s judgment based on currently available information and involve a number of risks and uncertainties that could cause actual results to differ materially from those suggested by the forward-looking statements. With respect to these forward-looking statements, management has made assumptions regarding, among other things, the development and deployment of new technologies and services; efficiencies and cost savings of new technologies and services; customer and network usage; connection growth and retention; service, speed, coverage and quality; availability of devices; availability of various financings, including any leasing transactions; the timing of various events and the economic environment. Sprint believes these forward-looking statements are reasonable; however, you should not place undue reliance on forward-looking statements, which are based on current expectations and speak only as of the date when made. Sprint undertakes no obligation to publicly update or revise any forward-looking statements, whether as a result of new information, future events or otherwise, except as required by law. In addition, forward-looking statements are subject to certain risks and uncertainties that could cause actual results to differ materially from our company's historical experience and our present expectations or projections. Factors that might cause such differences include, but are not limited to, those discussed in Sprint Corporation’s Annual Report on Form 10-K for the fiscal year ended March 31, 2016. You should understand that it is not possible to predict or identify all such factors. Consequently, you should not consider any such list to be a complete set of all potential risks or uncertainties.
About Sprint:
Sprint (NYSE: S) is a communications services company that creates more and better ways to connect its customers to the things they care about most. Sprint served 60.2 million connections as of Sept. 30, 2016 and is widely recognized for developing, engineering and deploying innovative technologies, including the first wireless 4G service from a national carrier in the United States; leading no-contract brands including Virgin Mobile USA, Boost Mobile, and Assurance Wireless; instant national and international push-to-talk capabilities; and a global Tier 1 Internet backbone. Sprint has been named to the Dow Jones Sustainability Index (DJSI) North America for the past five years. You can learn more and visit Sprint at www.sprint.com or www.facebook.com/sprint and www.twitter.com/sprint.
Sprint Quarterly Investor Update - Fiscal 2Q16
This regulatory filing also includes additional resources:
fiscal2q16sprintquarterlyinv.pdf
SentinelOne (NYSE:S)
Historical Stock Chart
From Mar 2024 to Apr 2024

SentinelOne (NYSE:S)
Historical Stock Chart
From Apr 2023 to Apr 2024
