UNITED STATES
SECURITIES AND EXCHANGE COMMISSION
Washington, D.C. 20549
FORM 8-K
CURRENT REPORT
Pursuant
to Section 13 or 15(d) of
the Securities Exchange Act of 1934
Date of Report (Date of earliest event reported) January 6, 2016
RPM INTERNATIONAL INC.
(Exact name of registrant as specified in its charter)
|
|
|
|
|
| Delaware |
|
1-14187 |
|
02-0642224 |
| (State or other jurisdiction |
|
(Commission |
|
(IRS Employer |
| of incorporation) |
|
File Number) |
|
Identification No.) |
|
|
|
| 2628 Pearl Road, P.O. Box 777, Medina, Ohio |
|
44258 |
| (Address of principal executive offices) |
|
(Zip Code) |
Registrant’s telephone number, including area code: (330) 273-5090
(Former name or former address, if changed since last report.)
Check the appropriate box below if the Form 8-K filing is intended to simultaneously satisfy the filing obligation of the registrant under any of the
following provisions (see General Instruction A.2. below):
| ¨ |
Written communications pursuant to Rule 425 under the Securities Act (17 CFR 230.425) |
| ¨ |
Soliciting material pursuant to Rule 14a-12 under the Exchange Act (17 CFR 240.14a-12) |
| ¨ |
Pre-commencement communications pursuant to Rule 14d-2(b) under the Exchange Act (17 CFR 240.14d-2(b)) |
| ¨ |
Pre-commencement communications pursuant to Rule 13e-4(c) under the Exchange Act (17 CFR 240.13e-4(c)) |
Item 2.02 Results of Operations and Financial Condition.
On January 6, 2016, the Company issued a press release announcing its second quarter results, which provided detail not included in previously issued
reports. A copy of the press release is furnished with this Current Report on Form 8-K as Exhibit 99.1.
Item 9.01 Financial Statements and
Exhibits.
(d) Exhibits.
|
|
|
| Exhibit
Number |
|
Description |
|
|
| 99.1 |
|
Press release of the Company, dated January 6, 2016, announcing the Company’s second quarter results. |
SIGNATURES
Pursuant to the requirements of the Securities Exchange Act of 1934, the registrant has duly caused this report to be signed on its behalf by
the undersigned hereunto duly authorized.
|
|
|
|
|
|
|
|
|
RPM International Inc. |
|
|
|
|
(Registrant) |
|
|
|
| Date January 6, 2016 |
|
|
|
/s/ Edward W. Moore |
|
|
|
|
Edward W. Moore |
|
|
|
|
Senior Vice President, General Counsel and
Chief Compliance Officer |
Exhibit Index
|
|
|
| Exhibit
Number |
|
Description |
|
|
| 99.1 |
|
Press release of the Company, dated January 6, 2016, announcing the Company’s second quarter results. |
Exhibit 99.1
RPM Reports Fiscal 2016 Second-Quarter Results
| |
• |
|
Second-quarter net income improves 20% on 8% sales increase |
| |
• |
|
Both periods impacted by currency headwinds, reconsolidation of SPHC businesses |
| |
• |
|
EPS guidance for FY 2016 maintained at $2.50 |
| |
• |
|
Management to present longer term goals on earnings call, with accompanying slides at www.rpminc.com |
MEDINA,
OH – January 6, 2016 – RPM International Inc. (NYSE: RPM) today reported a 20% increase in net income and a 19% increase in earnings per diluted share on an 8% sales increase for its fiscal 2016 second quarter ended November 30,
2015.
Second-Quarter Results
Net sales of $1.16
billion were up 7.9% over the $1.07 billion reported a year ago. Consolidated EBIT (earnings before interest and taxes) increased 17.9%, to $141.6 million from $120.1 million in the fiscal 2015 second quarter. Fiscal 2016 second-quarter net income
was up 19.6%, to $83.4 million from $69.8 million in the fiscal 2015 second quarter. Earnings per diluted share increased 19.2%, to $0.62 from $0.52 a year ago.
“During the second quarter, most of our international businesses posted solid sales gains in local currencies, which were reduced by foreign currency
translation that lowered reported sales by 6.3% company-wide,” stated Frank C. Sullivan, chairman and chief executive officer. In total, foreign currency, including both translational and transactional, reduced EPS by $0.06 per share. Sales and
earnings benefited from the reconsolidation of our Specialty Products Holding Company (SPHC) subsidiary’s businesses, which continued to perform in line with our expectations.”
Second-Quarter Segment Sales and Earnings
During the
fiscal 2016 second quarter, industrial segment sales declined 5.8%, to $610.2 million from $647.8 million in the fiscal 2015 second quarter. Organic sales improved 1.9%, while acquisition growth added 0.7%. Foreign currency translation reduced
sales by 8.4%. Industrial segment EBIT declined 0.4%, to $64.5 million from $64.8 million in the same period a year ago.
“We continued to see solid
performance by our businesses serving the U.S. commercial construction market. However, the impact is masked by the strong dollar, because a significant portion of the industrial segment’s revenue is outside U.S. markets. Our great
entrepreneurial businesses generating growth in local currencies are seeing those positive results erased by foreign currency translation. For example, in Europe, our second largest market, a 2.2% increase in sales in constant dollars was converted
through currency exchange to a 9.6% decline. Additionally, our industrial businesses serving the energy industry have been impacted by the global slowdown in oil and gas drilling, resulting in a decline in sales to that sector of nearly 10%,”
Sullivan stated.
RPM Reports Fiscal 2016 Second-Quarter Results
January 6, 2016
Page
2
of 4
Second-quarter sales for the specialty segment increased 164.8%, to $186.7 million from $70.5 million in the
fiscal 2015 second period. Organic growth was 3.8%, while acquisitions, principally the reconsolidated SPHC subsidiaries, added 167.1%. Foreign currency translation reduced sales by 6.1%. Specialty segment EBIT improved 104.8%, to $29.1 million from
$14.2 million.
“Most of our core specialty businesses, including food coatings, wood protection products, pleasure marine and other high performance
coatings, performed well in the quarter, excluding the negative impact from foreign currency,” Sullivan stated.
RPM’s fiscal 2016
second-quarter consumer segment sales increased 1.8%, to $359.1 million from $352.8 million a year ago. Organic sales increased 3.6%, while acquisition growth added 0.7%. Foreign currency translation reduced sales by 2.5%. Consumer segment EBIT
improved 6.2%, to $65.4 million from $61.6 million a year ago. During the quarter, the final earn-out accrual of $14.5 million, or approximately $0.07 per share, related to RPM’s acquisition of Kirker in fiscal 2013 was reversed into
income, compared to the $17.0 million, or approximately $0.09 per share, that was reversed during the same period last year.
“During the quarter,
our largest U.S. consumer businesses performed solidly and in line with expectations, while our nail enamel and Canadian businesses continued to struggle with sales declines,” stated Sullivan. “We expect to benefit from several product
roll-outs with various customers in the third and fourth quarters of fiscal 2016.”
Cash Flow and Financial Position
For the first half of fiscal 2016, cash from operations was $167.1 million, compared to $55.3 million a year ago. Capital expenditures of
$31.3 million compared to $26.5 million during the first half of last year. Total debt at November 30, 2015 was $1.68 billion, compared to $1.43 billion at November 30, 2014 and $1.66 billion at May 31, 2015.
RPM’s net (of cash) debt-to-total capitalization ratio was 53.5%, compared to 44.8% at November 30, 2014. At November 30, 2015, liquidity stood at $960.8 million, including cash of $190.6 million and $770.2 million in long-term
committed available credit.
First-Half Sales and Earnings
Fiscal 2016 first-half net sales improved 5.4%, to $2.40 billion from $2.28 billion during the first six months of fiscal 2015. Consolidated EBIT increased
6.5%, to $302.2 million from $283.8 million in the year-ago first half. Net income was up 8.5%, to $183.2 million from $168.8 million in the fiscal 2015 first half. Diluted earnings per share were $1.36, up 9.7% from $1.24 a year ago.
First-Half Segment Sales and Earnings
RPM’s
industrial segment fiscal 2016 first-half sales declined 5.1%, to $1.27 billion from $1.34 billion in the fiscal 2015 first half. Organic sales increased 2.9%, while acquisition growth added 0.6%. Foreign currency translation reduced sales by
8.6%. Industrial segment EBIT decreased 2.7%, to $148.7 million from $152.9 million a year ago.
RPM Reports Fiscal 2016 Second-Quarter Results
January 6, 2016
Page
3
of 4
Specialty segment sales grew 146.7%, to $370.4 million from $150.1 million in the 2015 first half. Organic
growth was 0.3%, while acquisitions, primarily the reconsolidated SPHC businesses, added 153.6%. Foreign currency translation reduced sales by 7.2%. For the first half of fiscal 2016, specialty segment EBIT increased 83.0%, to $57.1 million from
$31.2 million.
First-half sales for the consumer segment declined 3.6%, to $754.6 million from $782.8 million a year ago. Organic sales decreased 1.3%,
and acquisition growth added 0.5%. Foreign currency translation reduced sales by 2.8%. Consumer segment EBIT declined 4.9%, to $131.5 million from $138.2 million in the first half of fiscal 2015.
Business Outlook
“In our industrial segment, we
anticipate sales to be flat to up slightly for the balance of this fiscal year, principally due to the strength of our businesses serving the U.S. commercial construction markets. In the specialty segment, the second half of fiscal 2016 will have a
one-month benefit year over year from the reconsolidation of SPHC. For the remaining months of this fiscal year, we expect sales growth in the specialty segment to be in the mid-to-upper-single-digit range. Consumer segment growth will be in the
mid-single digits. Over the last several months, the U.S. dollar has continued to strengthen against most of the major currencies around the world and we expect the negative impact in the back half of fiscal 2016 to be approximately $0.05 per share
worse than we originally estimated. In addition, during last year’s third quarter, we recognized a $0.10 per share tax benefit that will not repeat this fiscal year, reducing last year’s EPS to an apples-to-apples comparison to this fiscal
year of $0.10 per share. For the full year, however, we are reaffirming our guidance for earnings per diluted share of $2.50,” stated Sullivan.
As
part of the earnings call this morning, RPM will present some longer term goals, which will be supported by an online slide presentation that can be accessed at www.rpminc.com.
Webcast and Conference Call Information
Management will
host a conference call to discuss these results beginning at 10:00 a.m. EST today. The call can be accessed by dialing 888-771-4371 or 847-585-4405 for international callers. Participants are asked to call the assigned number approximately 10
minutes before the conference call begins. The call, which will last approximately one hour, will be open to the public, but only financial analysts will be permitted to ask questions. The media and all other participants will be in a listen-only
mode.
For those unable to listen to the live call, a replay will be available from approximately 12:30 p.m. EST today until 11:59 p.m. EST on
January 13, 2016. The replay can be accessed by dialing 888-843-7419 or 630-652-3042 for international callers. The access code is 41121750. The call also will be available both live and for replay, and as a written transcript, via the RPM web
site at www.RPMinc.com.
About RPM
RPM International
Inc. owns subsidiaries that are world leaders in specialty coatings, sealants, building materials and related services across three segments. RPM’s industrial products include roofing systems, sealants, corrosion control coatings, flooring
coatings and other construction chemicals. Industrial companies include Stonhard, Tremco, illbruck, Carboline, Flowcrete, and Euclid Chemical. RPM’s consumer products are used by professionals and do-it-yourselfers for home maintenance and
RPM Reports Fiscal 2016 Second-Quarter Results
January 6, 2016
Page
4
of 4
improvement and by hobbyists. Consumer brands include Rust-Oleum, DAP, Zinsser, Varathane and Testors. RPM’s specialty products include industrial cleaners, colorants, exterior finishes,
specialty OEM coatings, edible coatings, restoration services equipment and specialty glazes for the pharmaceutical and food industries. Specialty segment companies include Day-Glo, Dryvit, RPM Wood Finishes, Mantrose-Haeuser, RPM Belgium, Legend
Brands, Kop-Coat, and TCI. Additional details can be found at www.RPMinc.com and by following RPM on Twitter at www.twitter.com/RPMintl.
For more
information, contact Barry M. Slifstein, vice president – investor relations, at 330-273-5090 or bslifstein@rpminc.com.
This press release contains
“forward-looking statements” relating to our business. These forward-looking statements, or other statements made by us, are made based on our expectations and beliefs concerning future events impacting us, and are subject to uncertainties
and factors (including those specified below) which are difficult to predict and, in many instances, are beyond our control. As a result, our actual results could differ materially from those expressed in or implied by any such forward-looking
statements. These uncertainties and factors include (a) global markets and general economic conditions, including uncertainties surrounding the volatility in financial markets, the availability of capital and the effect of changes in interest
rates, and the viability of banks and other financial institutions; (b) the prices, supply and capacity of raw materials, including assorted pigments, resins, solvents and other natural gas- and oil-based materials; packaging, including plastic
containers; and transportation services, including fuel surcharges; (c) continued growth in demand for our products; (d) legal, environmental and litigation risks inherent in our construction and chemicals businesses and risks related to
the adequacy of our insurance coverage for such matters; (e) the effect of changes in interest rates; (f) the effect of fluctuations in currency exchange rates upon our foreign operations; (g) the effect of non-currency risks of
investing in and conducting operations in foreign countries, including those relating to domestic and international political, social, economic and regulatory factors; (h) risks and uncertainties associated with our ongoing acquisition and
divestiture activities; (i) risks related to the adequacy of our contingent liability reserves; and (j) other risks detailed in our filings with the Securities and Exchange Commission, including the risk factors set forth in our Annual
Report on Form 10-K for the year ended May 31, 2015, as the same may be updated from time to time. We do not undertake any obligation to publicly update or revise any forward-looking statements to reflect future events, information or
circumstances that arise after the date of this release.
CONSOLIDATED STATEMENTS OF INCOME
IN THOUSANDS, EXCEPT PER SHARE DATA
(Unaudited)
|
|
|
|
|
|
|
|
|
|
|
|
|
|
|
|
|
| |
|
Three Months Ended |
|
|
Six Months Ended |
|
| |
|
November 30, |
|
|
November 30, |
|
| |
|
2015 |
|
|
2014 |
|
|
2015 |
|
|
2014 |
|
| Net Sales |
|
$ |
1,155,984 |
|
|
$ |
1,071,128 |
|
|
$ |
2,398,510 |
|
|
$ |
2,275,024 |
|
| Cost of sales |
|
|
662,050 |
|
|
|
617,185 |
|
|
|
1,371,618 |
|
|
|
1,312,688 |
|
|
|
|
|
|
|
|
|
|
|
|
|
|
|
|
|
|
| Gross profit |
|
|
493,934 |
|
|
|
453,943 |
|
|
|
1,026,892 |
|
|
|
962,336 |
|
| Selling, general & administrative expenses |
|
|
352,594 |
|
|
|
334,889 |
|
|
|
725,448 |
|
|
|
681,414 |
|
| Interest expense |
|
|
22,478 |
|
|
|
19,404 |
|
|
|
44,938 |
|
|
|
38,819 |
|
| Investment (income), net |
|
|
(1,100 |
) |
|
|
(5,058 |
) |
|
|
(5,168 |
) |
|
|
(8,861 |
) |
| Other (income), net |
|
|
(299 |
) |
|
|
(1,042 |
) |
|
|
(788 |
) |
|
|
(2,864 |
) |
|
|
|
|
|
|
|
|
|
|
|
|
|
|
|
|
|
| Income before income taxes |
|
|
120,261 |
|
|
|
105,750 |
|
|
|
262,462 |
|
|
|
253,828 |
|
| Provision for income taxes |
|
|
36,112 |
|
|
|
31,894 |
|
|
|
77,951 |
|
|
|
75,133 |
|
|
|
|
|
|
|
|
|
|
|
|
|
|
|
|
|
|
| Net income |
|
|
84,149 |
|
|
|
73,856 |
|
|
|
184,511 |
|
|
|
178,695 |
|
| Less: Net income attributable to noncontrolling interests |
|
|
716 |
|
|
|
4,090 |
|
|
|
1,263 |
|
|
|
9,850 |
|
|
|
|
|
|
|
|
|
|
|
|
|
|
|
|
|
|
| Net income attributable to RPM International Inc. Stockholders |
|
$ |
83,433 |
|
|
$ |
69,766 |
|
|
$ |
183,248 |
|
|
$ |
168,845 |
|
|
|
|
|
|
|
|
|
|
|
|
|
|
|
|
|
|
| Earnings per share of common stock attributable to RPM International Inc. Stockholders: |
|
|
|
|
|
|
|
|
|
|
|
|
|
|
|
|
| Basic |
|
$ |
0.63 |
|
|
$ |
0.52 |
|
|
$ |
1.39 |
|
|
$ |
1.27 |
|
|
|
|
|
|
|
|
|
|
|
|
|
|
|
|
|
|
| Diluted |
|
$ |
0.62 |
|
|
$ |
0.52 |
|
|
$ |
1.36 |
|
|
$ |
1.24 |
|
|
|
|
|
|
|
|
|
|
|
|
|
|
|
|
|
|
| Average shares of common stock outstanding - basic |
|
|
129,398 |
|
|
|
130,028 |
|
|
|
129,723 |
|
|
|
130,061 |
|
|
|
|
|
|
|
|
|
|
|
|
|
|
|
|
|
|
| Average shares of common stock outstanding - diluted |
|
|
136,734 |
|
|
|
134,966 |
|
|
|
137,072 |
|
|
|
135,000 |
|
|
|
|
|
|
|
|
|
|
|
|
|
|
|
|
|
|
|
|
|
|
|
| SUPPLEMENTAL SEGMENT INFORMATION |
|
|
|
|
|
|
|
|
|
|
|
|
|
|
|
|
| IN THOUSANDS |
|
|
|
|
|
|
|
|
|
|
|
|
|
|
|
|
| (Unaudited) |
|
|
|
|
|
|
|
| |
|
Three Months Ended |
|
|
Six Months Ended |
|
| |
|
November 30, |
|
|
November 30, |
|
| |
|
2015 |
|
|
2014 (a) |
|
|
2015 |
|
|
2014 (a) |
|
| Net Sales: |
|
|
|
|
|
|
|
|
|
|
|
|
|
|
|
|
| Industrial Segment |
|
$ |
610,201 |
|
|
$ |
647,836 |
|
|
$ |
1,273,530 |
|
|
$ |
1,342,120 |
|
| Specialty Segment |
|
|
186,729 |
|
|
|
70,511 |
|
|
|
370,369 |
|
|
|
150,113 |
|
| Consumer Segment |
|
|
359,054 |
|
|
|
352,781 |
|
|
|
754,611 |
|
|
|
782,791 |
|
|
|
|
|
|
|
|
|
|
|
|
|
|
|
|
|
|
| Total |
|
$ |
1,155,984 |
|
|
$ |
1,071,128 |
|
|
$ |
2,398,510 |
|
|
$ |
2,275,024 |
|
|
|
|
|
|
|
|
|
|
|
|
|
|
|
|
|
|
| Income Before Income Taxes (a): |
|
|
|
|
|
|
|
|
|
|
|
|
|
|
|
|
| Industrial Segment |
|
|
|
|
|
|
|
|
|
|
|
|
|
|
|
|
| Income Before Income Taxes (b) |
|
$ |
62,962 |
|
|
$ |
62,810 |
|
|
$ |
145,713 |
|
|
$ |
148,233 |
|
| Interest (Expense), Net (c) |
|
|
(1,535 |
) |
|
|
(1,976 |
) |
|
|
(3,034 |
) |
|
|
(4,647 |
) |
|
|
|
|
|
|
|
|
|
|
|
|
|
|
|
|
|
| EBIT (d) |
|
$ |
64,497 |
|
|
$ |
64,786 |
|
|
$ |
148,747 |
|
|
$ |
152,880 |
|
|
|
|
|
|
|
|
|
|
|
|
|
|
|
|
|
|
| Specialty Segment |
|
|
|
|
|
|
|
|
|
|
|
|
|
|
|
|
| Income Before Income Taxes (b) |
|
$ |
29,324 |
|
|
$ |
14,299 |
|
|
$ |
57,530 |
|
|
$ |
31,340 |
|
| Interest Income, Net (c) |
|
|
199 |
|
|
|
78 |
|
|
|
395 |
|
|
|
116 |
|
|
|
|
|
|
|
|
|
|
|
|
|
|
|
|
|
|
| EBIT (d) |
|
$ |
29,125 |
|
|
$ |
14,221 |
|
|
$ |
57,135 |
|
|
$ |
31,224 |
|
|
|
|
|
|
|
|
|
|
|
|
|
|
|
|
|
|
| Consumer Segment |
|
|
|
|
|
|
|
|
|
|
|
|
|
|
|
|
| Income Before Income Taxes (b) |
|
$ |
65,429 |
|
|
$ |
61,562 |
|
|
$ |
131,552 |
|
|
$ |
138,231 |
|
| Interest Income (Expense), Net (c) |
|
|
42 |
|
|
|
(4 |
) |
|
|
100 |
|
|
|
(12 |
) |
|
|
|
|
|
|
|
|
|
|
|
|
|
|
|
|
|
| EBIT (d) |
|
$ |
65,387 |
|
|
$ |
61,566 |
|
|
$ |
131,452 |
|
|
$ |
138,243 |
|
|
|
|
|
|
|
|
|
|
|
|
|
|
|
|
|
|
| Corporate/Other |
|
|
|
|
|
|
|
|
|
|
|
|
|
|
|
|
| (Expense) Before Income Taxes (b) |
|
$ |
(37,454 |
) |
|
$ |
(32,921 |
) |
|
$ |
(72,333 |
) |
|
$ |
(63,976 |
) |
| Interest (Expense), Net (c) |
|
|
(20,084 |
) |
|
|
(12,444 |
) |
|
|
(37,231 |
) |
|
|
(25,415 |
) |
|
|
|
|
|
|
|
|
|
|
|
|
|
|
|
|
|
| EBIT (d) |
|
$ |
(17,370 |
) |
|
$ |
(20,477 |
) |
|
$ |
(35,102 |
) |
|
$ |
(38,561 |
) |
|
|
|
|
|
|
|
|
|
|
|
|
|
|
|
|
|
| Consolidated |
|
|
|
|
|
|
|
|
|
|
|
|
|
|
|
|
| Income Before Income Taxes (b) |
|
$ |
120,261 |
|
|
$ |
105,750 |
|
|
$ |
262,462 |
|
|
$ |
253,828 |
|
| Interest (Expense), Net (c) |
|
|
(21,378 |
) |
|
|
(14,346 |
) |
|
|
(39,770 |
) |
|
|
(29,958 |
) |
|
|
|
|
|
|
|
|
|
|
|
|
|
|
|
|
|
| EBIT (d) |
|
$ |
141,639 |
|
|
$ |
120,096 |
|
|
$ |
302,232 |
|
|
$ |
283,786 |
|
|
|
|
|
|
|
|
|
|
|
|
|
|
|
|
|
|
| (a) |
Prior period information has been recast to reflect the current period change in reportable segments. |
| (b) |
The presentation includes a reconciliation of Income (Loss) Before Income Taxes, a measure defined by Generally Accepted Accounting Principles in the United States (GAAP), to EBIT. |
| (c) |
Interest (expense), net includes the combination of interest (expense) and investment income/(expense), net. |
| (d) |
EBIT is defined as earnings (loss) before interest and taxes. We evaluate the profit performance of our segments based on income before income taxes, but also look to EBIT as a performance evaluation measure because
interest expense is essentially related to acquisitions, as opposed to segment operations. For that reason, we believe EBIT is also useful to investors as a metric in their investment decisions. EBIT should not be considered an alternative to, or
more meaningful than, income before income taxes as determined in accordance with GAAP, since EBIT omits the impact of interest and taxes in determining operating performance, which represent items necessary to our continued operations, given our
level of indebtedness and ongoing tax obligations. Nonetheless, EBIT is a key measure expected by and useful to our fixed income investors, rating agencies and the banking community all of whom believe, and we concur, that this measure is critical
to the capital markets’ analysis of our segments’ core operating performance. We also evaluate EBIT because it is clear that movements in EBIT impact our ability to attract financing. Our underwriters and bankers consistently require
inclusion of this measure in offering memoranda in conjunction with any debt underwriting or bank financing. EBIT may not be indicative of our historical operating results, nor is it meant to be predictive of potential future results.
|
CONSOLIDATED BALANCE SHEETS
IN THOUSANDS
(Unaudited)
|
|
|
|
|
|
|
|
|
|
|
|
|
| |
|
November 30, 2015 |
|
|
November 30, 2014 |
|
|
May 31, 2015 |
|
| Assets |
|
|
|
|
|
|
|
|
|
|
|
|
| Current Assets |
|
|
|
|
|
|
|
|
|
|
|
|
| Cash and cash equivalents |
|
$ |
190,609 |
|
|
$ |
296,527 |
|
|
$ |
174,711 |
|
| Trade accounts receivable |
|
|
841,924 |
|
|
|
833,378 |
|
|
|
980,737 |
|
| Allowance for doubtful accounts |
|
|
(25,110 |
) |
|
|
(26,605 |
) |
|
|
(24,526 |
) |
|
|
|
|
|
|
|
|
|
|
|
|
|
| Net trade accounts receivable |
|
|
816,814 |
|
|
|
806,773 |
|
|
|
956,211 |
|
| Inventories |
|
|
710,282 |
|
|
|
637,932 |
|
|
|
674,205 |
|
| Deferred income taxes |
|
|
28,620 |
|
|
|
20,280 |
|
|
|
29,892 |
|
| Prepaid expenses and other current assets |
|
|
265,090 |
|
|
|
198,301 |
|
|
|
264,827 |
|
|
|
|
|
|
|
|
|
|
|
|
|
|
| Total current assets |
|
|
2,011,415 |
|
|
|
1,959,813 |
|
|
|
2,099,846 |
|
|
|
|
|
|
|
|
|
|
|
|
|
|
| Property, Plant and Equipment, at Cost |
|
|
1,262,062 |
|
|
|
1,172,307 |
|
|
|
1,258,304 |
|
| Allowance for depreciation |
|
|
(687,426 |
) |
|
|
(662,329 |
) |
|
|
(668,658 |
) |
|
|
|
|
|
|
|
|
|
|
|
|
|
| Property, plant and equipment, net |
|
|
574,636 |
|
|
|
509,978 |
|
|
|
589,646 |
|
|
|
|
|
|
|
|
|
|
|
|
|
|
| Other Assets |
|
|
|
|
|
|
|
|
|
|
|
|
| Goodwill |
|
|
1,187,204 |
|
|
|
1,118,444 |
|
|
|
1,215,688 |
|
| Other intangible assets, net of amortization |
|
|
577,324 |
|
|
|
441,556 |
|
|
|
604,130 |
|
| Deferred income taxes, non-current |
|
|
2,902 |
|
|
|
7,582 |
|
|
|
5,685 |
|
| Other |
|
|
164,751 |
|
|
|
159,880 |
|
|
|
179,245 |
|
|
|
|
|
|
|
|
|
|
|
|
|
|
| Total other assets |
|
|
1,932,181 |
|
|
|
1,727,462 |
|
|
|
2,004,748 |
|
|
|
|
|
|
|
|
|
|
|
|
|
|
| Total Assets |
|
$ |
4,518,232 |
|
|
$ |
4,197,253 |
|
|
$ |
4,694,240 |
|
|
|
|
|
|
|
|
|
|
|
|
|
|
| Liabilities and Stockholders’ Equity |
|
|
|
|
|
|
|
|
|
|
|
|
| Current Liabilities |
|
|
|
|
|
|
|
|
|
|
|
|
| Accounts payable |
|
$ |
396,896 |
|
|
$ |
379,874 |
|
|
$ |
512,165 |
|
| Current portion of long-term debt |
|
|
2,593 |
|
|
|
151,358 |
|
|
|
2,038 |
|
| Accrued compensation and benefits |
|
|
119,482 |
|
|
|
111,032 |
|
|
|
169,370 |
|
| Accrued losses |
|
|
22,468 |
|
|
|
18,537 |
|
|
|
22,016 |
|
| Other accrued liabilities |
|
|
197,229 |
|
|
|
208,701 |
|
|
|
197,647 |
|
|
|
|
|
|
|
|
|
|
|
|
|
|
| Total current liabilities |
|
|
738,668 |
|
|
|
869,502 |
|
|
|
903,236 |
|
|
|
|
|
|
|
|
|
|
|
|
|
|
| Long-Term Liabilities |
|
|
|
|
|
|
|
|
|
|
|
|
| Long-term debt, less current maturities |
|
|
1,673,471 |
|
|
|
1,275,875 |
|
|
|
1,654,037 |
|
| Other long-term liabilities |
|
|
732,467 |
|
|
|
411,922 |
|
|
|
752,821 |
|
| Deferred income taxes |
|
|
81,402 |
|
|
|
48,476 |
|
|
|
90,681 |
|
|
|
|
|
|
|
|
|
|
|
|
|
|
| Total long-term liabilities |
|
|
2,487,340 |
|
|
|
1,736,273 |
|
|
|
2,497,539 |
|
|
|
|
|
|
|
|
|
|
|
|
|
|
| Total liabilities |
|
|
3,226,008 |
|
|
|
2,605,775 |
|
|
|
3,400,775 |
|
|
|
|
|
|
|
|
|
|
|
|
|
|
| Commitments and contingencies |
|
|
|
|
|
|
|
|
|
|
|
|
| Stockholders’ Equity |
|
|
|
|
|
|
|
|
|
|
|
|
| Preferred stock; none issued |
|
|
|
|
|
|
|
|
|
|
|
|
| Common stock (outstanding 133,318; 133,748; 133,203) |
|
|
1,333 |
|
|
|
1,337 |
|
|
|
1,332 |
|
| Paid-in capital |
|
|
887,650 |
|
|
|
806,898 |
|
|
|
872,127 |
|
| Treasury stock, at cost |
|
|
(170,220 |
) |
|
|
(94,354 |
) |
|
|
(124,928 |
) |
| Accumulated other comprehensive (loss) |
|
|
(477,470 |
) |
|
|
(259,267 |
) |
|
|
(394,135 |
) |
| Retained earnings |
|
|
1,048,968 |
|
|
|
935,773 |
|
|
|
936,996 |
|
|
|
|
|
|
|
|
|
|
|
|
|
|
| Total RPM International Inc. stockholders’ equity |
|
|
1,290,261 |
|
|
|
1,390,387 |
|
|
|
1,291,392 |
|
| Noncontrolling interest |
|
|
1,963 |
|
|
|
201,091 |
|
|
|
2,073 |
|
|
|
|
|
|
|
|
|
|
|
|
|
|
| Total equity |
|
|
1,292,224 |
|
|
|
1,591,478 |
|
|
|
1,293,465 |
|
|
|
|
|
|
|
|
|
|
|
|
|
|
| Total Liabilities and Stockholders’ Equity |
|
$ |
4,518,232 |
|
|
$ |
4,197,253 |
|
|
$ |
4,694,240 |
|
|
|
|
|
|
|
|
|
|
|
|
|
|
CONSOLIDATED STATEMENTS OF CASH FLOWS
IN THOUSANDS
(Unaudited)
|
|
|
|
|
|
|
|
|
| |
|
Six Months Ended |
|
| |
|
November 30, |
|
| |
|
2015 |
|
|
2014 |
|
| Cash Flows From Operating Activities: |
|
|
|
|
|
|
|
|
| Net income |
|
$ |
184,511 |
|
|
$ |
178,695 |
|
| Adjustments to reconcile net income to net cash provided by (used for) operating activities: |
|
|
|
|
|
|
|
|
| Depreciation |
|
|
33,509 |
|
|
|
30,132 |
|
| Amortization |
|
|
22,144 |
|
|
|
16,015 |
|
| Reversal of contingent consideration obligations |
|
|
(14,500 |
) |
|
|
(18,080 |
) |
| Deferred income taxes |
|
|
(680 |
) |
|
|
2,170 |
|
| Stock-based compensation expense |
|
|
15,524 |
|
|
|
15,706 |
|
| Other non-cash interest expense |
|
|
4,862 |
|
|
|
1,329 |
|
| Other |
|
|
1,441 |
|
|
|
(2,551 |
) |
| Changes in assets and liabilities, net of effect from purchases and sales of businesses: |
|
|
|
|
|
|
|
|
| Decrease in receivables |
|
|
117,358 |
|
|
|
44,564 |
|
| (Increase) in inventory |
|
|
(49,781 |
) |
|
|
(41,392 |
) |
| Decrease in prepaid expenses and other current and long-term assets |
|
|
4,617 |
|
|
|
1,306 |
|
| (Decrease) in accounts payable |
|
|
(105,841 |
) |
|
|
(133,960 |
) |
| (Decrease) in accrued compensation and benefits |
|
|
(45,649 |
) |
|
|
(57,837 |
) |
| Increase (decrease) in accrued losses |
|
|
715 |
|
|
|
(8,471 |
) |
| Increase in other accrued liabilities |
|
|
7,375 |
|
|
|
37,229 |
|
| Other |
|
|
(8,532 |
) |
|
|
(9,599 |
) |
|
|
|
|
|
|
|
|
|
| Cash Provided By Operating Activities |
|
|
167,073 |
|
|
|
55,256 |
|
|
|
|
|
|
|
|
|
|
| Cash Flows From Investing Activities: |
|
|
|
|
|
|
|
|
| Capital expenditures |
|
|
(31,295 |
) |
|
|
(26,498 |
) |
| Acquisition of businesses, net of cash acquired |
|
|
(12,006 |
) |
|
|
(33,355 |
) |
| Purchase of marketable securities |
|
|
(14,213 |
) |
|
|
(14,308 |
) |
| Proceeds from sales of marketable securities |
|
|
11,737 |
|
|
|
19,205 |
|
| Other |
|
|
5,355 |
|
|
|
6,515 |
|
|
|
|
|
|
|
|
|
|
| Cash (Used For) Investing Activities |
|
|
(40,422 |
) |
|
|
(48,441 |
) |
|
|
|
|
|
|
|
|
|
| Cash Flows From Financing Activities: |
|
|
|
|
|
|
|
|
| Additions to long-term and short-term debt |
|
|
38,765 |
|
|
|
83,312 |
|
| Reductions of long-term and short-term debt |
|
|
(18,774 |
) |
|
|
(6,501 |
) |
| Cash dividends |
|
|
(71,276 |
) |
|
|
(66,763 |
) |
| Shares of common stock repurchased and returned for taxes |
|
|
(45,292 |
) |
|
|
(8,954 |
) |
| Payments of acquisition-related contingent consideration |
|
|
(1,631 |
) |
|
|
(24,750 |
) |
| Other |
|
|
270 |
|
|
|
1,048 |
|
|
|
|
|
|
|
|
|
|
| Cash (Used For) Financing Activities |
|
|
(97,938 |
) |
|
|
(22,608 |
) |
|
|
|
|
|
|
|
|
|
| Effect of Exchange Rate Changes on Cash and Cash Equivalents |
|
|
(12,815 |
) |
|
|
(20,548 |
) |
|
|
|
|
|
|
|
|
|
| Net Change in Cash and Cash Equivalents |
|
|
15,898 |
|
|
|
(36,341 |
) |
|
|
|
| Cash and Cash Equivalents at Beginning of Period |
|
|
174,711 |
|
|
|
332,868 |
|
|
|
|
|
|
|
|
|
|
| Cash and Cash Equivalents at End of Period |
|
$ |
190,609 |
|
|
$ |
296,527 |
|
|
|
|
|
|
|
|
|
|
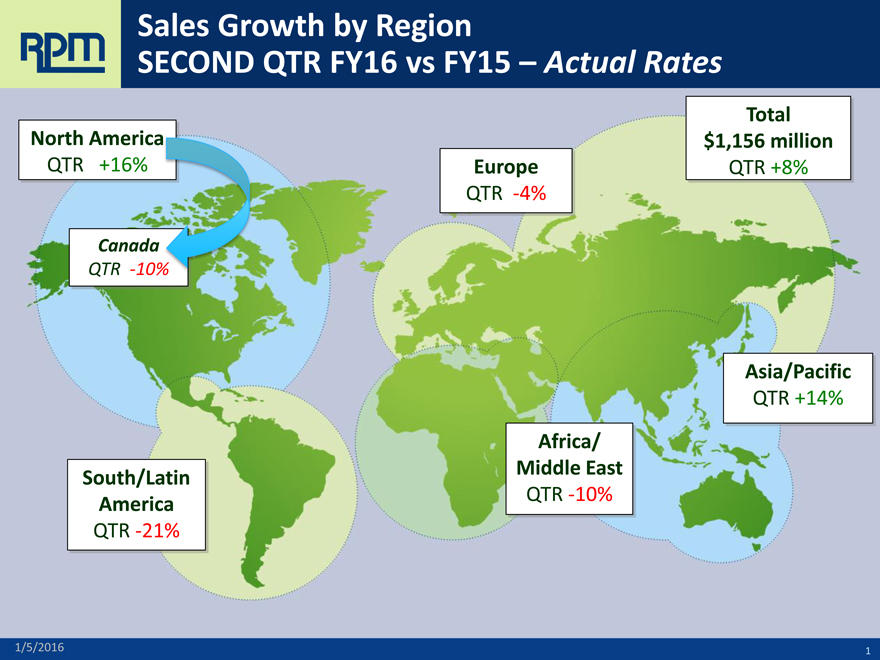
Sales Growth by Region
SECOND QTR FY16 vs FY15 – Actual Rates
Total
North America $1,156 million
QTR +16% Europe QTR +8%
QTR -4%
Canada
QTR -10%
Asia/Pacific
QTR +14%
Africa/
South/Latin Middle East
America QTR -10%
QTR -21%
1/5/2016 1
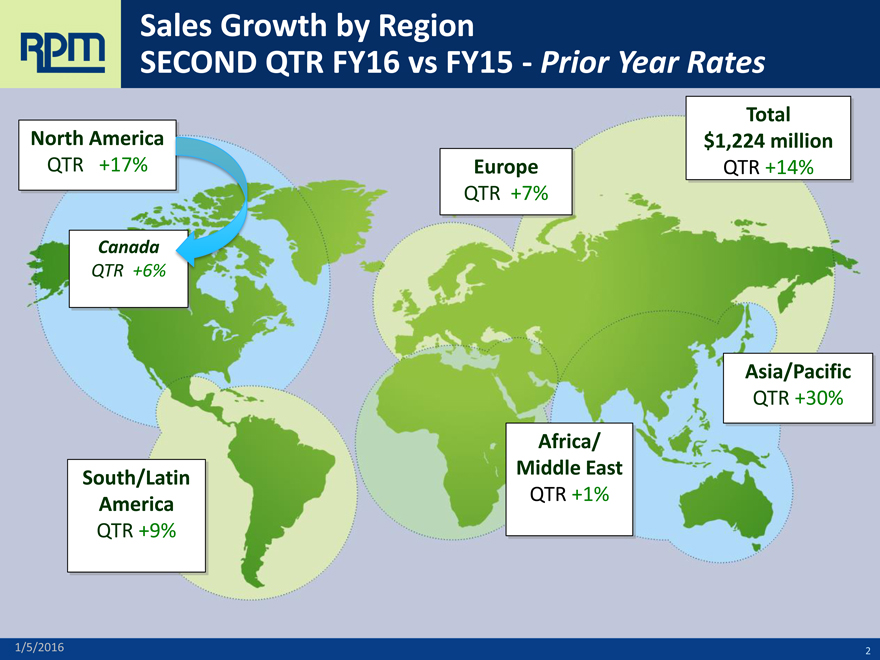
Sales Growth by Region
SECOND QTR FY16 vs FY15 -Prior Year Rates
Total
North America $1,224 million
QTR +17% Europe QTR +14%
QTR +7%
Canada
QTR +6%
Asia/Pacific
QTR +30%
Africa/
South/Latin Middle East
America QTR +1%
QTR +9%
1/5/2016
RPM (NYSE:RPM)
Historical Stock Chart
From Mar 2024 to Apr 2024

RPM (NYSE:RPM)
Historical Stock Chart
From Apr 2023 to Apr 2024
