Procter & Gamble, After Shedding Bulk of Beauty Business, Reports Organic Sales Growth
January 20 2017 - 8:12AM
Dow Jones News
By Joshua Jamerson
Procter & Gamble Co. said sales in its latest quarter fell
slightly from a year ago but the drop was less than Wall Street
expected, offering the first glimpse at the consumer-products
giant's operations since it shed the bulk of its beauty
business.
The company reported organic sales growth across its segments,
and shares rose 1.8% to $86.25 in premarket trading Friday.
P&G has struggled for years to accelerate sales growth
facing slowing demand for its consumer staples like fabric softener
and increased competition from new smaller & nimbler rivals.
The company determined a focus on areas like salon products and
designer perfumes that distracted from core areas and hurt its
growth.
In June 2015, P&G announced it would shed brands such as
Wella shampoos, Clairol hair dye and CoverGirl makeup and merge
them with Coty Inc. in a complicated deal originally valued at $13
billion. The report Friday marked P&G's first since it unloaded
the bulk of the beauty business to Coty; the deal closed last
fall.
P&G reported net income of $7.88 billion, or $2.88 a share,
compared with year-ago earnings of $3.21 billion, or $1.12 a share.
On an adjusted basis, excluding gains from the sale, the company
said it earned $1.08 a share, slightly above analysts' projections
for $1.06 a share.
Sales edged lower to $16.86 billion from $16.92 billion a year
ago, less of a drop-off than the $16.77 billion analysts were
expecting.
P&G has shown recently it is able to cut costs but had yet
to deliver on a promise to meaningfully increase revenue. Investors
have been looking for P&G to post improved organic-sales
growth, a measure that strips out currency moves, acquisitions and
divestments.
The company said organic sales increased 2% driven by a 2%
increase in organic shipment volume, as pricing and mix had no net
impact on quarterly sales.
--Imani Moise contributed to this article.
(END) Dow Jones Newswires
January 20, 2017 07:57 ET (12:57 GMT)
Copyright (c) 2017 Dow Jones & Company, Inc.
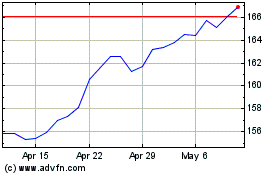
Procter and Gamble (NYSE:PG)
Historical Stock Chart
From Mar 2024 to Apr 2024

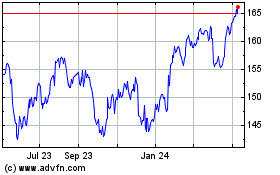
Procter and Gamble (NYSE:PG)
Historical Stock Chart
From Apr 2023 to Apr 2024
