Procter & Gamble Profit Rises
October 25 2016 - 8:20AM
Dow Jones News
Procter & Gamble Co. on Tuesday posted an unexpected rise in
profit in the latest quarter as revenue slid less than anticipated
amid organic sales growth.
During the September quarter, P&G said organic sales, a
closely watched metric that strips out currency moves, acquisitions
and divestments, grew 3%. Overall pricing remained flat while
volume improved 2%. Excluding acquisitions and divestitures, core
volume rose 3%.
And all five of P&G's segments recorded core volume
improvement—2% in beauty, 3% in grooming, 5% in health care, 4% in
fabric and home care and 4% in baby, feminine and family care.
Chief Executive David Taylor pointed to organic sales growth
across all product categories as well as strong cost savings. He
said earlier this month P&G completed the last major step in
its portfolio transformation with the sale of its beauty brands to
Coty Inc.
"We're pleased with the progress we're making, but there is
still more work to do to get back to the levels of balanced top-
and bottom-line growth and cash generation," said Mr. Taylor.
P&G—which has struggled for years to accelerate sales growth
and has underperformed smaller, nimbler rivals—has been slashing
costs and commanding higher prices for staples from shaving cream
to paper towels.
In all for the latest quarter, P&G reported a profit of
$2.71 billion, or 96 cents a share, up from $2.6 billion, or 91
cents a share, a year ago.
Excluding special items, adjusted per-share earnings rose to
$1.03 a share. Revenue edged 0.1% lower to $16.5 billion. Analysts
polled by Thomson Reuters had forecast adjusted earnings to remain
flat at 98 cents a share on $16.49 billion in revenue.
Gross margin was 51.0%, from 50.7%.
The company backed its 2017 forecast for per-share earnings
growth in the mid-single digits from fiscal 2016's $3.67 a share
and sales growth of about 1%.
P&G shares, which have risen 5.9% so far this year, added
another 0.5% premarket to $84.55.
Write to Anne Steele at Anne.Steele@wsj.com
(END) Dow Jones Newswires
October 25, 2016 08:05 ET (12:05 GMT)
Copyright (c) 2016 Dow Jones & Company, Inc.
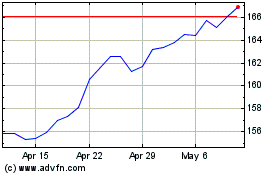
Procter and Gamble (NYSE:PG)
Historical Stock Chart
From Mar 2024 to Apr 2024

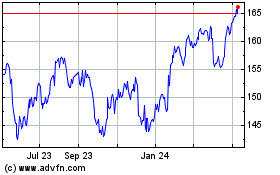
Procter and Gamble (NYSE:PG)
Historical Stock Chart
From Apr 2023 to Apr 2024
