P&G Earnings Top Expectations, but Volumes Fall
April 26 2016 - 12:24PM
Dow Jones News
By Anne Steele
Procter & Gamble Co. on Tuesday reported
better-than-expected earnings for its March quarter as a core sales
metric improved, though volumes declined across nearly all of its
businesses.
In the fiscal third quarter ended March 31, P&G said organic
sales, a closely watched metric that strips out currency moves,
acquisitions and divestments, rose 1%. Overall pricing improved 1%,
but volume slipped 2%.
P&G logged a 5% volume decline in its beauty segment, a 6%
drop in its grooming segment, a 3% decline in its health care
segment, and a 2% slip in its baby, feminine and family care
segment. The company said attributed its volume declines to lower
shipments in developing markets, some brand divestitures and the
so-called deconsolidation of its Venezuela operations -- a move in
which the company essentially wrote off its investment in the
country even though it continues to do business there.
The Cincinnati maker of Pantene shampoo and Bounty paper towels
has struggled for years to accelerate sales growth and is
underperforming smaller, nimbler rivals that are growing sales
organically in the U.S. and abroad.
Overall, P&G reported a profit of $2.75 billion, or 97 cents
a share, up from $2.15 billion, or 75 cents a share, a year
earlier. Excluding special items, per-share earnings fell to 86
cents a share. Revenue fell 6.9% to $15.76 billion.
Analysts polled by Thomson Reuters had forecast 82 cents a share
in adjusted earnings on $15.81 billion in revenue.
The company said its gross margin increased 250 basis points in
the quarter.
P&G also tightened its outlook for core earnings for the
year to a range of down 3% to 6% from last year's core earnings of
$3.76. The company had previously guided for earnings of about
$3.91 a share. P&G said earnings are expected to be
"significantly lower" than the prior year due to increased
advertising investments, a higher tax rate, foreign-exchange
headwinds and lower nonoperating income.
Shares in the company edged up down 0.4% premarket to
$81.10.
Write to Anne Steele at Anne.Steele@wsj.com
(END) Dow Jones Newswires
April 26, 2016 12:09 ET (16:09 GMT)
Copyright (c) 2016 Dow Jones & Company, Inc.
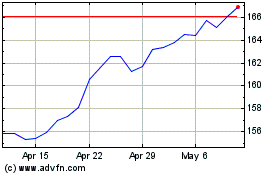
Procter and Gamble (NYSE:PG)
Historical Stock Chart
From Mar 2024 to Apr 2024

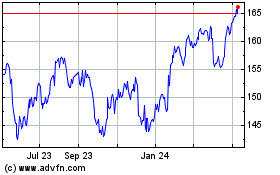
Procter and Gamble (NYSE:PG)
Historical Stock Chart
From Apr 2023 to Apr 2024
