OFG Bancorp (NYSE:OFG) today reported results for the second
quarter ended June 30, 2016.
2Q16 Highlights
- Net income available to shareholders
was in line with the preceding quarter and surpassed the year ago
quarter. OFG generated $10.9 million, or $0.25 per share fully
diluted, in 2Q16 compared to $10.7 million, or $0.24, in 1Q16. In
the year ago quarter, OFG reported a net loss of $6.6 million, or
($0.15) per share, primarily due to non-recurring charges.
- Oriental Bank’s overall performance
continued strong. New loan generation at $237.8 million grew
5.1% from the preceding quarter, with increased activity in auto,
mortgage, and consumer loans. Banking and wealth management fee
revenues increased 6.8% from 1Q16.
- Credit quality continued its
positive trajectory. Net charge-offs (excluding acquired loans)
declined to 1.21% from 1.30% in 1Q16. Early and total delinquency
rates dropped from the previous and year-ago quarters.
Non-performing loan rates fell to the lowest level in the last five
quarters.
- Costs remained under control.
The efficiency ratio improved to 58.76%, the best level in last
five quarters.
- Total Puerto Rico government related
exposure continued to decline. Balances fell approximately
1.0%, to $405.3 million from the end of 1Q16. In addition, Puerto
Rico Electric Power Authority (PREPA) continued to make progress
toward final implementation of its Restructuring Support Agreement
by the end of 2016.
- Net Interest Margin (NIM) remained
relatively level, at 4.65% compared to 4.67% in 1Q16.
- Capital continued to build.
Tangible book value per common share increased to $14.96 from
$14.68 in 1Q16. Tangible common equity (TCE) ratio increased to
9.92% from 9.50%.
CEO Comment
José Rafael Fernández, President, Chief Executive Officer, and
Vice Chairman of the Board, commented:
“OFG delivered another good quarter, demonstrating strong
consistency in our financial results. Diluted EPS of $0.25 was
slightly better than 1Q16 as we continued to focus on building our
franchise while continuously adapting to our environment.
“New loan generation remained robust, underscoring our growing
retail franchise. NIM remained in line. Credit quality continued to
be solid as a result of maintaining our prudent lending standards
and proactive collection program. Our Puerto Rico government
related loan exposure continued to decrease. Expenses are being
well contained, with the efficiency ratio the best it has been in
more than a year. As a result, tangible book value has
increased.
“We are continuing to build franchise value by differentiating
Oriental from others with technology that makes banking easier and
more accessible, with superior levels of service. During 2Q16, we
introduced the Oriental Biz mobile app, adding mobile check capture
for small business customers. We were the first to introduce this
feature for retail customers in Puerto Rico in 2013, and now we are
the first to introduce this feature to small commercial clients on
the island. During 2Q16, we also introduced Cardless Cash, another
first for Puerto Rico, for making ATM withdrawals quickly without
using an ATM/debit card. All of these are attracting a steady
influx of new customers.
“Enactment of the Puerto Rico Oversight, Management and Economic
Stability Act, or PROMESA, provides a clearer path to address
Puerto Rico’s fiscal challenges and more importantly creates a
congressional committee to focus on Puerto Rico’s economic
development. As it is, the economy continues to fare reasonably
well, despite some headlines to the contrary. We are also pleased
the PREPA restructuring continues to move ahead for the benefit of
its customers, Puerto Rico, and creditors alike.”
2Q16 Income Statement Highlights
The following compares data for the second quarter 2016 to the
first quarter 2016 unless otherwise noted.
- Interest Income from Loans
declined $1.5 million to $79.7 million. This was due to lower
balances, yields and cost recoveries from acquired loans as they
continue to run off, partially offset by portfolio growth in
originated loans.
- Interest Income from Securities
declined $1.9 million to $8.2 million. This was primarily due to
the previously disclosed 1Q16 sale of mortgage backed securities,
which was done in conjunction with the partial unwinding of a
high-rate repurchase funding agreement.
- Interest Expense declined $1.7
million to $14.6 million. This was due to lower balances and costs
after the above mentioned 1Q16 transaction.
- Total Provision for Loan and Lease
Losses increased $0.7 million to $14.4 million. Provision for
originated loans fell $1.6 million primarily due to lower net
charge-offs and delinquency ratios. Provision for acquired loans
increased $2.3 million primarily due to one former BBVA
institutional commercial loan.
- Net Interest Margin was 4.65%
compared to 4.67%, reflecting the reasons mentioned above.
Excluding cost recoveries, NIM was 4.59% compared to 4.55%.
- Total Banking and Wealth Management
Revenues increased $1.2 million to $18.3 million due to
increases in all major operations, but primarily in wealth
management. This was due to seasonal commercial insurance fees,
higher volume in the sale of annuities, and higher commissions from
broker dealer operations. Mortgage banking revenues increased 19.8%
due to higher volumes of originated and sold loans.
- FDIC Shared-Loss Expense,
Net decreased $0.6 million to $3.4 million due to lower
valuation changes in the covered mortgage portfolio.
- Total Non-Interest Expenses
declined $1.0 million to $53.8 million. Compensation decreased $1.8
million primarily due to reaching maximum Federal Insurance
Contributions Act (FICA) contributions. General and administrative
expenses declined $1.7 million due to lower professional and other
service fees, reflecting continuing expense management. Net losses
on the sale of foreclosed assets increased $2.2 million compared to
1Q16, which saw net gains on sales.
- Effective Income Tax Rate was
estimated at approximately 29% for the near-term, including this
quarter.
June 30, 2016 Balance Sheet Highlights
The following compares data as of June 30, 2016 to March 31,
2016 unless otherwise noted.
- Total Loans increased to $4.37
billion from $4.36 billion, as inflows of originated loans outpaced
outflows in acquired loans.
- Total Investments declined to
$1.32 billion from $1.33 billion, mainly due to prepayments of
mortgage-backed securities.
- Puerto Rico Central Government and
Public Corporation Loan Balances fell 1.9% to $194.4 million.
Loans to Puerto Rico municipalities and Puerto Rico investment
securities balances remained approximately level at $204.3 million
and $6.7 million, respectively.
- Total Deposits declined to $4.64
billion from $4.78 billion primarily due to a reduction of brokered
deposit balances.
- Total Borrowings declined to
$1.04 billion from $1.07 billion primarily due to lower balances
from FHLB advances and other borrowings.
- Total Stockholders’ Equity
increased $12.1 million to $915.9 million, reflecting an increase
in retained earnings and in accumulated other comprehensive income,
net.
Credit Quality Highlights
The following compares data for the second quarter 2016 to the
first quarter 2016 unless otherwise noted.
- Net Charge-Off (NCO) Rate at
1.21% fell 9 basis points, due to declines in the auto, commercial,
and mortgage lending categories, partially offset by an increase in
consumer lending charge-offs.
- Early Delinquency Rate was at
1.86% and total delinquency 4.83%. Starting 2Q16 auto and consumer
early delinquencies are being tracked to be consistent across all
retail loan categories. Regardless of the change, early and total
delinquency has been falling due to proactive measures to manage
the effects of the economic environment.
- Non-Performing Loan Rate at
9.08% declined 50 basis points with favorable experiences in
commercial, auto and mortgage lending, partially offset by a small
increase from consumer lending.
- Allowance for Loan and Lease
Losses fell $0.4 million to $112.8 million due to generally
improved credit metrics. Loan loss reserve ratio to total loans
(excluding acquired loans) decreased to 3.53% from 3.63%.
Capital Position
The following compares data for the second quarter 2016 to the
first quarter 2016.
Regulatory capital ratios continued to be significantly above
requirements for a well-capitalized institution.
- Tangible Common Equity to Total
Tangible Assets at 9.92% increased 42 basis points to the
highest level in five quarters.
- Common Equity Tier 1 Capital
Ratio (using Basel III methodology) increased to 12.64% from
12.33%
- Total Risk-Based Capital Ratio
increased to 18.00% from 17.67%.
Conference Call
A conference call to discuss OFG’s results for the second
quarter 2016, outlook and related matters will be held today,
Friday, July 22, at 10:00 AM Eastern Time. The call will be
accessible live via a webcast on OFG’s Investor Relations website
at www.ofgbancorp.com. A webcast replay will be available shortly
thereafter. Access the webcast link in advance to download any
necessary software.
Financial Supplement
OFG’s Financial Supplement, with full financial tables for the
second quarter ended June 30, 2016, can be found on the Webcasts,
Presentations & Other Files page, on OFG’s Investor Relations
website at www.ofgbancorp.com.
Non-GAAP Financial Measures
In addition to our financial information presented in accordance
with GAAP, management uses certain “non-GAAP financial measures”
within the meaning of the SEC Regulation G, to clarify and enhance
understanding of past performance and prospects for the future.
Forward Looking Statements
The information included in this document contains certain
forward-looking statements within the meaning of the Private
Securities Litigation Reform Act of 1995. These statements are
based on management’s current expectations and involve certain
risks and uncertainties that may cause actual results to differ
materially from those expressed in the forward-looking
statements.
Factors that might cause such a difference include, but are not
limited to (i) the rate of growth in the economy and employment
levels, as well as general business and economic conditions; (ii)
changes in interest rates, as well as the magnitude of such
changes; (iii) a credit default by the government of Puerto Rico;
(iv) the fiscal and monetary policies of the federal government and
its agencies; (v) changes in federal bank regulatory and
supervisory policies, including required levels of capital; (vi)
the relative strength or weakness of the consumer and commercial
credit sectors and of the real estate market in Puerto Rico; (vii)
the performance of the stock and bond markets; (viii) competition
in the financial services industry; and (ix) possible legislative,
tax or regulatory changes.
For a discussion of such factors and certain risks and
uncertainties to which OFG is subject, see OFG’s annual report on
Form 10-K for the year ended December 31, 2015, as well as its
other filings with the U.S. Securities and Exchange Commission.
Other than to the extent required by applicable law, including the
requirements of applicable securities laws, OFG assumes no
obligation to update any forward-looking statements to reflect
occurrences or unanticipated events or circumstances after the date
of such statements.
About OFG Bancorp
Now in its 52nd year in business, OFG Bancorp is a diversified
financial holding company that operates under U.S. and Puerto Rico
banking laws and regulations. Its three principal subsidiaries,
Oriental Bank, Oriental Financial Services and Oriental Insurance,
provide a full range of commercial, consumer and mortgage banking
services, as well as financial planning, trust, insurance,
investment brokerage and investment banking services, primarily in
Puerto Rico, through 48 financial centers. Investor information can
be found at www.ofgbancorp.com.
View source
version on businesswire.com: http://www.businesswire.com/news/home/20160722005279/en/
For OFG BancorpPuerto Rico:Alexandra López,
787-522-6970allopez@orientalbank.comorUS:Steven Anreder,
212-532-3232sanreder@ofgbancorp.comorGary Fishman,
212-532-3232gfishman@ofgbancorp.com
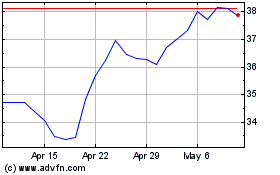
OFG Bancorp (NYSE:OFG)
Historical Stock Chart
From Mar 2024 to Apr 2024

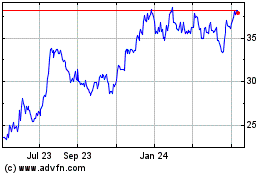
OFG Bancorp (NYSE:OFG)
Historical Stock Chart
From Apr 2023 to Apr 2024
