_________________________________________________
UNITED STATES
SECURITIES AND EXCHANGE COMMISSION
Washington, D.C. 20549
FORM 8-K
CURRENT REPORT
PURSUANT TO SECTION 13 OR 15(d) OF THE
SECURITIES EXCHANGE ACT OF 1934
Date of Report (Date of earliest event reported)
November 4, 2015
Annaly Capital Management, Inc.
(Exact Name of Registrant as Specified in its Charter)
|
Maryland
|
|
1-13447
|
|
22-3479661
|
|
State or Other Jurisdiction
Of Incorporation)
|
|
(Commission
File Number)
|
|
(I.R.S. Employer
Identification No.)
|
|
1211 Avenue of the Americas
New York, New York
|
|
10036
|
|
(Address of Principal
Executive Offices)
|
|
(Zip Code)
|
Registrant’s telephone number, including area code: (212) 696-0100
(Former Name or Former Address, if Changed Since Last Report)
Check the appropriate box below if the Form 8-K filing is intended to simultaneously satisfy the filing obligation of the registrant under any of the following provisions:
[ ] Written communications pursuant to Rule 425 under the Securities Act (17 CFR 230.425)
[ ] Soliciting material pursuant to Rule 14a-12 under the Exchange Act (17 CFR 240.14a-12)
[ ] Pre-commencement communications pursuant to Rule 14d-2(b) under the Exchange Act (17 CFR 240.14d-2(b))
[ ] Pre-commencement communications pursuant to Rule 13e-4(c) under the Exchange Act (17 CFR 240.13e-4(c))
Item 2.02. Results of Operations and Financial Condition
On November 4, 2015, the registrant issued a press release announcing its financial results for the quarter ended September 30, 2015. A copy of the press release is furnished as Exhibit 99.1 to this report.
On November 4, 2015, the registrant posted supplemental financial information on the Investors section of its website (www.annaly.com). A copy of the supplemental financial information is furnished as Exhibit 99.2 to this report and incorporated herein by reference.
Item 9.01 Financial Statements and Exhibits
(d) Exhibits
99.1 Press Release, dated November 4, 2015, issued by Annaly Capital Management, Inc.
99.2 Supplemental Financial Information for the quarter ended September 30, 2015
SIGNATURES
Pursuant to the requirements of the Securities Exchange Act of 1934, the Registrant has duly caused this report to be signed on its behalf by the undersigned hereunto duly authorized.
| |
ANNALY CAPITAL MANAGEMENT, INC.
|
| |
|
|
| |
|
|
| |
|
|
| |
By: |
/s/ Glenn A. Votek |
| |
|
Name: Glenn A. Votek |
| |
|
Title: Chief Financial Officer |
Dated: November 4, 2015
Exhibit 99.1
FOR IMMEDIATE RELEASE
ANNALY CAPITAL MANAGEMENT, INC. REPORTS 3rd QUARTER 2015 RESULTS
| ● |
|
GAAP net loss of ($627.5) million, ($0.68) loss per average common share
|
| ● |
|
Core earnings of $217.6 million, $0.21 earnings per average common share
|
| ● |
|
Normalized core earnings of $0.30 per average common share, excludes $0.09 of premium amortization adjustment cost due to change in long-term CPR estimate
|
| ● |
|
Common stock book value of $11.99, economic leverage of 5.8:1
|
| ● |
|
26% increase in credit investment portfolio, represents 18% of total stockholders’ equity
|
| ● |
|
Enhanced disclosure of financial results and portfolio details
|
New York, New York–November 4, 2015–Annaly Capital Management, Inc. (NYSE: NLY) (the “Company”) today announced its financial results for the quarter ended September 30, 2015.
“Annaly’s third quarter results continue to exemplify the stability and resilience of our business model amidst one of the most unique and volatile time periods in the history of fixed income markets,” commented Kevin Keyes, Chief Executive Officer and President. “Our diversified investment platform continues to grow while producing stable risk-adjusted returns in a challenging market environment. Annaly’s commercial real estate and non-Agency residential credit portfolios grew by approximately 26% over the previous quarter and now constitute approximately 18% of our total equity capital. The credit investment portfolio, which is predominantly made up of low-levered, floating rate, longer term cash flows, complements our Agency MBS strategy in this current environment of heightened interest rate volatility. As we proceed in anticipation of eventual Federal Reserve policy action and continued market dislocation, we remain prepared with a strong capital position to take advantage of multiple investment opportunities.”
“Also, in an effort to provide increased transparency into our evolving business strategy and performance, we have enhanced our disclosure of our growing non-Agency and commercial asset portfolios; and also provided a more detailed discussion of our core financial earnings to now include the effects of long term prepayment estimates upon our results. Normalized core earnings, excluding premium amortization adjustments, is intended to provide investors with a reference point for each quarter’s dividend payment. ”
Enhanced Financial Disclosure
Beginning with this quarterly earnings release, the Company has added an additional non-GAAP disclosure in order to provide investors and stakeholders additional detail and insight into the Company’s results. The Company’s traditional non-GAAP “core earnings” (which is defined as net income (loss) excluding gains or losses on disposals of investments and termination of interest rate swaps, unrealized gains or losses on interest rate swaps and financial instruments measured at fair value through earnings, net gains and losses on trading assets, impairment losses, net income (loss) attributable to noncontrolling interest, and certain other non-recurring gains or losses, and inclusive of dollar roll income (a component of Net gains (losses) on trading assets)) measure includes a component of premium amortization representing the change in estimated long-term constant prepayment rates (“CPR”) (referred to herein as the premium amortization adjustment (“PAA”)). In addition to the existing core earnings measure, the Company is now providing a non-GAAP “normalized core earnings” measure which presents the Company’s core earnings excluding the PAA. Additionally, under the title “normalized” the Company will disclose other measures (such as net interest margin, annualized yield on interest earnings assets, net interest spread and core return on average equity) which exclude the effect of the PAA. The Company believes these additional metrics will permit investors and stakeholders to evaluate the various components of its financial performance in a more detailed manner. Discussions of period-over-period fluctuations within the following ‘Financial Performance’ section are presented based on GAAP and normalized results.
The Company’s GAAP and core earnings metrics (that are not normalized) include the PAA because in accordance with GAAP the Company recognizes income under the retrospective method on substantially all of its Investment Securities classified as available-for-sale. Premiums and discounts associated with the purchase of Investment Securities are amortized or accreted into income over the remaining projected lives of the securities. Using a third-party supplied model and market information to project future cash flows and expected remaining lives of securities, the effective interest rate determined for each security is applied as if it had been in place from the security’s acquisition. The amortized cost of the investment is then adjusted to the amount that would have existed had the new effective yield been applied since the acquisition. The adjustment to amortized cost is offset with a charge or credit to interest income. Changes in interest rates and other market factors will impact prepayment speed projections and the amount of premium amortization recognized in a period.
The following table illustrates the impact of adjustments to long-term CPR estimates on premium amortization expense for the periods presented:
| |
|
September 30, 2015
|
|
|
June 30, 2015
|
|
|
September 30, 2014
|
|
| |
|
(dollars in thousands)
|
|
|
Premium amortization expense
|
|
$ |
255,123 |
|
|
$ |
94,037 |
|
|
$ |
197,709 |
|
|
Less: PAA cost (benefit)
|
|
|
83,136 |
|
|
|
(79,582 |
) |
|
|
25,992 |
|
|
Premium amortization expense exclusive of PAA
|
|
$ |
171,987 |
|
|
$ |
173,619 |
|
|
$ |
171,717 |
|
| |
|
|
|
|
|
|
|
|
|
|
|
|
| |
|
September 30, 2015
|
|
|
June 30, 2015
|
|
|
September 30, 2014
|
|
| |
|
(per common share)
|
|
|
Premium amortization expense
|
|
$ |
0.27 |
|
|
$ |
0.10 |
|
|
$ |
0.21 |
|
|
Less: PAA cost (benefit)
|
|
|
0.09 |
|
|
|
(0.08 |
) |
|
|
0.02 |
|
|
Premium amortization expense exclusive of PAA
|
|
$ |
0.18 |
|
|
$ |
0.18 |
|
|
$ |
0.19 |
|
In addition to the enhanced disclosures described above, beginning with this quarterly earnings release the Company is also providing additional and more detailed portfolio information, including information on the Company’s non-Agency residential credit assets and commercial real estate portfolio (see Third Quarter 2015 Supplemental Information available on the Company’s website www.annaly.com).
The following represents an example of augmented disclosures on our residential and commercial credit assets as of September 30, 2015:
Residential Credit Portfolio (aggregate fair value of $820.8 million):
|
Sector Type
|
|
|
STACR
|
|
|
20 |
% |
|
CAS
|
|
|
18 |
% |
|
NPL
|
|
|
17 |
% |
|
Jumbo 2.0
|
|
|
14 |
% |
|
Prime
|
|
|
10 |
% |
|
Subprime
|
|
|
7 |
% |
|
Alt-A
|
|
|
6 |
% |
|
RPL
|
|
|
5 |
% |
|
L-Street CRT
|
|
|
2 |
% |
|
Jumbo 2.0 IO
|
|
|
1 |
% |
|
Total
|
|
|
100 |
% |
|
Coupon Type
|
|
|
Fixed
|
|
|
48 |
% |
|
Floating
|
|
|
48 |
% |
|
ARM
|
|
|
3 |
% |
|
IO
|
|
|
1 |
% |
|
Total
|
|
|
100 |
% |
Commercial Credit Portfolio (aggregate economic interest of $1.9 billion):
|
Sector Type
|
|
|
Multifamily
|
|
|
54 |
% |
|
Office
|
|
|
17 |
% |
|
Retail
|
|
|
12 |
% |
|
Hotel
|
|
|
7 |
% |
|
Industrial
|
|
|
4 |
% |
|
Other
|
|
|
6 |
% |
|
Total
|
|
|
100 |
% |
|
Geographic Concentration
|
|
|
NY
|
|
|
40 |
% |
|
CA
|
|
|
13 |
% |
|
TX
|
|
|
6 |
% |
|
FL
|
|
|
5 |
% |
|
Other
|
|
|
36 |
% |
|
Total
|
|
|
100 |
% |
Financial Performance
The following table summarizes certain key performance indicators as of and for the quarters ended September 30, 2015, June 30, 2015, and September 30, 2014:
| |
September 30, 2015
|
June 30, 2015
|
September 30, 2014
|
|
Book value per common share
|
$11.99
|
$12.32
|
$12.87
|
|
Economic leverage at period-end (1)
|
5.8:1
|
5.6:1
|
5.4:1
|
|
GAAP net income (loss) per common share
|
($0.68)
|
$0.93
|
$0.36
|
|
Core earnings per common share
|
$0.21
|
$0.41
|
$0.31
|
|
Normalized core earnings per common share (2)
|
$0.30
|
$0.33
|
$0.33
|
|
Annualized return (loss) on average equity
|
(20.18%)
|
28.00%
|
10.69%
|
|
Annualized core return on average equity
|
7.00%
|
12.79%
|
9.30%
|
|
Annualized normalized core return on average equity (2)
|
9.67%
|
10.31%
|
10.08%
|
|
Net interest margin (3)
|
1.24%
|
2.01%
|
1.61%
|
|
Normalized net interest margin (2)
|
1.62%
|
1.67%
|
1.74%
|
|
Net interest spread
|
0.76%
|
1.64%
|
1.35%
|
|
Normalized net interest spread (2)
|
1.21%
|
1.23%
|
1.47%
|
|
Average yield on interest earning assets
|
2.41%
|
3.23%
|
2.99%
|
|
Normalized average yield on interest earning assets (2)
|
2.86%
|
2.82%
|
3.11%
|
| (1) |
Computed as the sum of recourse debt, TBA derivative notional outstanding and net forward purchases of Investment Securities divided by total equity. Recourse debt consists of repurchase agreements, other secured financing and Convertible Senior Notes. Securitized debt, participation sold and mortgages payable are non-recourse to the Company and are excluded from this measure. |
| (2) |
Excludes effect of the PAA due to changes in long-term CPR estimates. |
| (3) |
Represents the sum of the Company’s annualized economic net interest income (inclusive of interest expense on interest rate swaps used to hedge cost of funds) plus TBA dollar roll income (less interest expense on swaps used to hedge dollar roll transactions) divided by the sum of its average interest-earning assets plus average outstanding TBA derivative balances. Average interest earning assets reflects the average amortized cost of our investments during the period. |
The Company reported a GAAP net loss for the quarter ended September 30, 2015 of ($627.5) million, or ($0.68) per average common share, compared to GAAP net income of $900.1 million, or $0.93 per average common share, for the quarter ended June 30, 2015, and GAAP net income of $354.9 million, or $0.36 per average common share, for the quarter ended September 30, 2014. The decrease for the quarter ended September 30, 2015 compared to each of the quarters ended June 30, 2015 and September 30, 2014 is primarily the result of unfavorable market value changes on interest rate swaps.
Core earnings for the quarter ended September 30, 2015 was $217.6 million, or $0.21 per average common share, compared to $411.1 million, or $0.41 per average common share, for the quarter ended June 30, 2015, and $308.6 million, or $0.31 per average common share, for the quarter ended September 30, 2014. Normalized core earnings, which excludes the PAA, for the quarter ended September 30, 2015 was $300.7 million, or $0.30 per average common share, compared to $331.5 million, or $0.33 per average common share, for the quarter ended June 30, 2015, and $334.6 million, or $0.33 per average common share, for the quarter ended September 30, 2014. Normalized core earnings declined during the quarter ended September 30, 2015 compared to the quarter ended June 30, 2015 on higher swap costs in the current quarter due to increased notional balances as well as due to a reduction in investment advisory income and dividend income resulting from Chimera’s internalization of its management and the Company’s disposition of its investment in Chimera during the quarter. Normalized core earnings declined during the quarter ended September 30, 2015 compared to the quarter ended September 30, 2014 as a result of lower average interest earning assets and lower weighted average coupons.
The following table presents a reconciliation between GAAP net income (loss), core earnings and normalized core earnings for the quarters ended September 30, 2015, June 30, 2015, and September 30, 2014:
| |
|
For the quarters ended
|
|
| |
|
September 30, 2015
|
|
|
June 30, 2015
|
|
|
September 30, 2014
|
|
| |
|
(dollars in thousands)
|
|
|
GAAP net income (loss)
|
|
$ |
(627,491 |
) |
|
$ |
900,071 |
|
|
$ |
354,856 |
|
|
Less:
|
|
|
|
|
|
|
|
|
|
|
|
|
|
Unrealized (gains) losses on interest rate swaps
|
|
|
822,585 |
|
|
|
(700,792 |
) |
|
|
(98,593 |
) |
|
Net (gains) losses on disposal of investments
|
|
|
7,943 |
|
|
|
(3,833 |
) |
|
|
(4,693 |
) |
|
Net (gains) losses on trading assets
|
|
|
(108,175 |
) |
|
|
114,230 |
|
|
|
(4,676 |
) |
|
Net unrealized (gains) losses on financial instruments measured at fair value through earnings
|
|
|
24,501 |
|
|
|
(17,581 |
) |
|
|
37,944 |
|
|
Other non-recurring loss (1)
|
|
|
- |
|
|
|
- |
|
|
|
23,783 |
|
|
Impairment of goodwill
|
|
|
- |
|
|
|
22,966 |
|
|
|
- |
|
|
GAAP net (income) loss attributable to noncontrolling interest
|
|
|
197 |
|
|
|
149 |
|
|
|
- |
|
|
Plus:
|
|
|
|
|
|
|
|
|
|
|
|
|
|
TBA dollar roll income (2)
|
|
|
98,041 |
|
|
|
95,845 |
|
|
|
- |
|
|
Core earnings
|
|
|
217,601 |
|
|
|
411,055 |
|
|
|
308,621 |
|
|
Premium amortization adjustment cost (benefit)
|
|
|
83,136 |
|
|
|
(79,582 |
) |
|
|
25,992 |
|
|
Normalized core earnings
|
|
$ |
300,737 |
|
|
$ |
331,473 |
|
|
$ |
334,613 |
|
|
GAAP net income (loss) per average common share
|
|
$ |
(0.68 |
) |
|
$ |
0.93 |
|
|
$ |
0.36 |
|
|
Core earnings per average common share
|
|
$ |
0.21 |
|
|
$ |
0.41 |
|
|
$ |
0.31 |
|
|
Normalized core earnings per average common share
|
|
$ |
0.30 |
|
|
$ |
0.33 |
|
|
$ |
0.33 |
|
| (1) |
Represents a one-time payment made by FIDAC to Chimera Investment Corp. (Chimera) to resolve issues raised in derivative demand letters sent to Chimera’s board of directors. This amount is a component of Other income (loss) in the Company’s Consolidated Statements of Comprehensive Income (Loss). |
| (2) |
Represents a component of Net gains (losses) on trading assets. |
Normalized net interest margin for the quarters ended September 30, 2015, June 30, 2015, and September 30, 2014 was 1.62%, 1.67% and 1.74%, respectively. For the quarter ended September 30, 2015, the normalized average yield on interest earning assets was 2.86% and the average cost of interest bearing liabilities, including interest expense on interest rate swaps used to hedge cost of funds, was 1.65%, which resulted in a normalized net interest spread of 1.21%. The normalized average yield on interest earning assets for the quarter ended September 30, 2015 increased incrementally when compared to the quarter ended June 30, 2015 due to higher weighted average coupons on Investment Securities and decreased when compared to the quarter ended September 30, 2014 due to lower weighted average coupons on Investment Securities. Our average cost of interest bearing liabilities increased for the quarter ended September 30, 2015 when compared to the quarter ended June 30, 2015 on higher swap costs and reduced average repurchase agreement balances. Our average cost of interest bearing liabilities for the quarter ended September 30, 2015 when compared to the quarter ended September 30, 2014 was relatively unchanged.
Asset Portfolio
Investment Securities, which are comprised of Agency mortgage-backed securities, Agency debentures, credit risk transfer securities and Non-Agency mortgage-backed securities, totaled $67.0 billion at September 30, 2015, compared to $68.2 billion at June 30, 2015 and $82.8 billion at September 30, 2014. The Company’s Investment Securities portfolio at September 30, 2015 was comprised of 93% fixed-rate assets with the remainder constituting adjustable or floating-rate investments. During the quarter ended September 30, 2015, the Company disposed of $3.7 billion of Investment Securities, resulting in a net realized gain of $4.5 million. During the quarter ended June 30, 2015, the Company disposed of $2.5 billion of Investment Securities, resulting in a net realized gain of $3.9 million. During the quarter ended September 30, 2014, the Company disposed of $4.2 billion of Investment Securities, resulting in a net realized gain of $4.7 million.
At September 30, 2015, the Company had outstanding $14.1 billion in notional balances of TBA derivative positions. Realized and unrealized gains (losses) on TBA derivatives are recorded in Net gains (losses) on trading assets in the Company’s Consolidated Statements of Comprehensive Income (Loss). The following table summarizes certain characteristics of the Company’s TBA derivatives at September 30, 2015:
|
Purchase and sale contracts for derivative TBAs
|
|
Notional
|
|
|
Implied Cost Basis
|
|
|
Implied Market Value
|
|
|
Net Carrying Value
|
|
| |
|
(dollars in thousands)
|
|
|
Purchase contracts
|
|
$ |
14,055,000 |
|
|
$ |
14,490,220 |
|
|
$ |
14,577,736 |
|
|
$ |
87,516 |
|
|
Sale contracts
|
|
|
- |
|
|
|
- |
|
|
|
- |
|
|
|
- |
|
|
Net TBA derivatives
|
|
$ |
14,055,000 |
|
|
$ |
14,490,220 |
|
|
$ |
14,577,736 |
|
|
$ |
87,516 |
|
The Company uses a third-party model and market information to project prepayment speeds for purposes of determining amortization of related premiums and discounts on Investment Securities. Changes to model assumptions, including interest rates and other market data, as well as periodic revisions to the model may cause changes to the results. The net amortization of premiums and accretion of discounts on Investment Securities for the quarters ended September 30, 2015, June 30, 2015, and September 30, 2014, was $255.1 million (which included PAA cost of $83.1 million), $94.0 million (which included PAA benefit of $79.6 million), and $197.7 million (which included PAA cost of $26.0 million), respectively. The total net premium balance on Investment Securities at September 30, 2015, June 30, 2015, and September 30, 2014, was $4.8 billion, $4.8 billion, and $5.5 billion, respectively. The weighted average amortized cost basis of the Company’s non-interest-only Investment Securities at September 30, 2015, June 30, 2015, and September 30, 2014, was 105.3%, 105.4%, and 105.4%, respectively. The weighted average amortized cost basis of the Company’s interest-only Investment Securities at September 30, 2015, June 30, 2015, and September 30, 2014, was 16.1%, 16.0%, and 15.2%, respectively. The weighted average experienced CPR on our Agency mortgage-backed securities for the quarters ended September 30, 2015, June 30, 2015, and September 30, 2014, was 12%, 12% and 9%, respectively. The weighted average long-term CPR on our Agency mortgage-backed securities at September 30, 2015, June 30, 2015, and September 30, 2014, was 9.2%, 7.7% and 6.9%, respectively.
The Company’s commercial investment portfolio consists of commercial real estate investments and corporate debt. Commercial real estate debt and preferred equity, including securitized loans of consolidated variable interest entities (“VIEs”) and loans held for sale of $476.6 million, totaled $4.7 billion and investments in commercial real estate totaled $301.4 million at September 30, 2015. Commercial real estate debt and preferred equity, including securitized loans of consolidated VIEs, totaled $4.1 billion and investments in commercial real estate totaled $216.8 million at June 30, 2015. Corporate debt investments totaled $425.0 million as of September 30, 2015, up from $311.6 million at June 30, 2015. The weighted average yield on commercial real estate debt and preferred equity, which includes loans held for sale, as of September 30, 2015, June 30, 2015, and September 30, 2014, was 6.82%, 8.29% and 9.23%, respectively. Excluding loans held for sale, the weighted average yield on commercial real estate debt and preferred equity was 7.63% at September 30, 2015. The weighted average levered return on investments in commercial real estate, excluding real estate held-for-sale, as of September 30, 2015, June 30, 2015, and September 30, 2014, was 11.59%, 12.53% and 11.46%, respectively.
During the quarter, the Company originated or provided additional funding on pre-existing debt commitments totaling $652.8 million with a weighted average coupon of 3.74%, of which $480.0 million ($476.6 net of unamortized origination fees) is held for sale at September 30, 2015. During the quarter, the Company received gross cash of $162.5 million from partial paydowns, prepayments and maturities with a weighted average coupon of 8.90%. During the quarter, the Company purchased three retail properties for a gross purchase price of $244.5 million and a net equity investment of $67.9 million with an expected levered return of 9.60%. The Company also acquired AAA rated commercial mortgage-backed securities during the quarter for a gross purchase price of $91.3 million and a net equity investment of $15.5 million with a levered return of 8.12%. During the quarter, the Company grew its corporate debt portfolio by $113.3 million.
At September 30, 2015, June 30, 2015, and September 30, 2014, residential and commercial credit assets (excluding loans held for sale) comprised 18%, 14% and 11% of stockholders’ equity.
Capital and Funding
At September 30, 2015, total stockholders’ equity was $12.3 billion. Leverage at September 30, 2015, June 30, 2015, and September 30, 2014, was 4.8:1, 4.8:1 and 5.4:1, respectively. For purposes of calculating the Company’s leverage ratio, debt consists of repurchase agreements, other secured financing, Convertible Senior Notes, securitized debt, participation sold and mortgages payable. Securitized debt, participation sold and mortgages payable are non-recourse to the Company. Economic leverage, which excludes non-recourse debt and includes other forms of financing such as TBA dollar roll transactions, was 5.8:1 at September 30, 2015, compared to 5.6:1 at June 30, 2015, and 5.4:1 at September 30, 2014. At September 30, 2015, June 30, 2015, and September 30, 2014, the Company’s capital ratio, which represents the ratio of stockholders’ equity to total assets (inclusive of total market value of TBA derivatives), was 13.7%, 14.2%, and 15.0%, respectively. On a GAAP basis, the Company produced an annualized return (loss) on average equity for the quarters ended September 30, 2015, June 30, 2015, and September 30, 2014 of (20.18%), 28.00%, and 10.69%, respectively. On a normalized core earnings basis, the Company provided an annualized return on average equity for the quarters ended September 30, 2015, June 30, 2015, and September 30, 2014, of 9.67%, 10.31%, and 10.08%, respectively.
At September 30, 2015, June 30, 2015, and September 30, 2014, the Company had a common stock book value per share of $11.99, $12.32 and $12.87, respectively.
At September 30, 2015, June 30, 2015, and September 30, 2014, the Company had outstanding $56.4 billion, $57.5 billion, and $69.6 billion of repurchase agreements, with weighted average remaining maturities of 147 days, 149 days, and 159 days, respectively, and with weighted average borrowing rates of 1.75%, 1.73%, and 1.61%, after giving effect to the Company’s interest rate swaps used to hedge cost of funds. During the quarters ended September 30, 2015, June 30, 2015, and September 30, 2014, the weighted average rate on repurchase agreements was 0.73%, 0.67%, and 0.58% respectively.
The following table presents the principal balance and weighted average rate of repurchase agreements by maturity at June 30, 2015:
|
Maturity
|
|
Principal Balance
|
|
|
Weighted Average Rate
|
|
|
(dollars in thousands)
|
|
|
Within 30 days
|
|
$ |
19,880,862 |
|
|
|
0.50 |
% |
|
30 to 59 days
|
|
|
4,846,173 |
|
|
|
0.52 |
% |
|
60 to 89 days
|
|
|
8,840,129 |
|
|
|
0.57 |
% |
|
90 to 119 days
|
|
|
3,957,380 |
|
|
|
0.52 |
% |
|
Over 120 days(1)
|
|
|
18,924,820 |
|
|
|
1.29 |
% |
|
Total
|
|
$ |
56,449,364 |
|
|
|
0.78 |
% |
| (1) |
Approximately 14% of the total repurchase agreements have a remaining maturity over 1 year. |
Hedge Portfolio
At September 30, 2015, the Company had outstanding interest rate swaps with a net notional amount of $29.7 billion. Changes in the unrealized gains or losses on the interest rate swaps are reflected in the Company’s Consolidated Statements of Comprehensive Income (Loss). The Company enters into interest rate swaps to mitigate the risk of rising interest rates that affect the Company’s cost of funds or its dollar roll transactions. As of September 30, 2015, the swap portfolio, excluding forward starting swaps, had a weighted average pay rate of 2.26%, a weighted average receive rate of 0.42% and a weighted average maturity of 7.28 years.
The following table summarizes certain characteristics of the Company’s interest rate swaps at September 30, 2015:
|
Maturity
|
|
Current Notional (1)
|
|
|
Weighted
Average Pay
Rate (2) (3)
|
|
|
Weighted
Average Receive
Rate (2)
|
|
|
Weighted
Average Years
to Maturity (2)
|
|
|
(dollars in thousands)
|
|
|
0 - 3 years
|
|
$ |
3,202,454 |
|
|
|
1.85 |
% |
|
|
0.22 |
% |
|
|
2.04 |
|
|
3 - 6 years
|
|
|
11,113,000 |
|
|
|
1.81 |
% |
|
|
0.46 |
% |
|
|
4.49 |
|
|
6 - 10 years
|
|
|
11,743,300 |
|
|
|
2.45 |
% |
|
|
0.47 |
% |
|
|
8.20 |
|
|
Greater than 10 years
|
|
|
3,634,400 |
|
|
|
3.70 |
% |
|
|
0.26 |
% |
|
|
19.62 |
|
|
Total / Weighted Average
|
|
$ |
29,693,154 |
|
|
|
2.26 |
% |
|
|
0.42 |
% |
|
|
7.28 |
|
| (1) |
Notional amount includes $0.5 billion in forward starting pay fixed swaps, which settle in December 2015. |
| (2) |
Excludes forward starting swaps. |
| (3) |
Weighted average fixed rate on forward starting pay fixed swaps was 2.04 %. |
The Company enters into U.S. Treasury and Eurodollar futures contracts to hedge a portion of its interest rate risk. The following table summarizes outstanding futures positions as of September 30, 2015:
| |
|
Notional - Long
Positions
|
|
|
Notional - Short
Positions
|
|
|
Weighted Average
Years to Maturity
|
|
| |
|
(dollars in thousands)
|
|
|
|
|
|
2-year swap equivalent Eurodollar contracts
|
|
$ |
- |
|
|
$ |
(8,000,000 |
) |
|
|
2.00 |
|
|
U.S. Treasury futures - 5 year
|
|
|
- |
|
|
|
(2,273,000 |
) |
|
|
4.41 |
|
|
U.S. Treasury futures - 10 year and greater
|
|
|
- |
|
|
|
(655,600 |
) |
|
|
6.92 |
|
|
Total
|
|
$ |
- |
|
|
$ |
(10,928,600 |
) |
|
|
2.80 |
|
At September 30, 2015, June 30, 2015, and September 30, 2014, the Company’s hedge ratio was 58%, 54% and 50%. Our hedge ratio measures total notional balances of interest rate swaps, interest rate swaptions and futures relative to repurchase agreements and TBA notional outstanding.
Dividend Declarations
Common dividends declared for each of the quarters ended September 30, 2015, June 30, 2015, and September 30, 2014 were $0.30 per common share. The annualized dividend yield on the Company’s common stock for the quarter ended September 30, 2015, based on the September 30, 2015 closing price of $9.87, was 12.16%, compared to 13.06% for the quarter ended June 30, 2015, and 11.24% for the quarter ended September 30, 2014.
Key Metrics
The following table presents key metrics of the Company’s portfolio, liabilities and hedging positions, and performance as of and for the quarters ended September 30, 2015, June 30, 2015, and September 30, 2014:
| |
September 30, 2015
|
June 30, 2015
|
September 30, 2014
|
|
Portfolio Related Metrics:
|
|
|
|
|
Fixed-rate Investment Securities as a percentage of total Investment Securities
|
93%
|
94%
|
95%
|
|
Adjustable-rate and floating-rate Investment Securities as a percentage of total Investment Securities
|
7%
|
6%
|
5%
|
|
Weighted average experienced CPR, for the period
|
12%
|
12%
|
9%
|
|
Weighted average projected long-term CPR, as of period end
|
9.2%
|
7.7%
|
6.9%
|
|
Weighted average yield on commercial real estate debt and preferred equity at period-end (1)
|
6.82%
|
8.29%
|
9.23%
|
|
Weighted average levered return on investments in commercial real estate at period-end (2)
|
11.59%
|
12.53%
|
11.46%
|
| |
|
|
|
|
Liabilities and Hedging Metrics:
|
|
|
|
|
Weighted average days to maturity on repurchase agreements outstanding at period-end
|
147
|
149
|
159
|
|
Hedge ratio (3)
|
58%
|
54%
|
50%
|
|
Weighted average pay rate on interest rate swaps at period-end (4)
|
2.26%
|
2.29%
|
2.48%
|
|
Weighted average receive rate on interest rate swaps at period-end (4)
|
0.42%
|
0.40%
|
0.21%
|
|
Weighted average net rate on interest rate swaps at period-end (4)
|
1.84%
|
1.89%
|
2.27%
|
|
Leverage at period-end (5)
|
4.8:1
|
4.8:1
|
5.4:1
|
|
Economic leverage at period-end (6)
|
5.8:1
|
5.6:1
|
5.4:1
|
|
Capital ratio at period-end
|
13.7%
|
14.2%
|
15.0%
|
| |
|
|
|
|
Performance Related Metrics:
|
|
|
|
|
Book value per common share
|
$11.99
|
$12.32
|
$12.87
|
|
GAAP net income (loss) per common share
|
($0.68)
|
$0.93
|
$0.36
|
|
Core earnings per common share
|
$0.21
|
$0.41
|
$0.31
|
|
Normalized core earnings per common share
|
$0.30
|
$0.33
|
$0.33
|
|
Annualized return (loss) on average equity
|
(20.18%)
|
28.00%
|
10.69%
|
|
Annualized core return on average equity
|
7.00%
|
12.79%
|
9.30%
|
|
Annualized normalized core return on average equity
|
9.67%
|
10.31%
|
10.08%
|
|
Net interest margin
|
1.24%
|
2.01%
|
1.61%
|
|
Normalized net interest margin
|
1.62%
|
1.67%
|
1.74%
|
|
Average yield on interest earning assets (7)
|
2.41%
|
3.23%
|
2.99%
|
|
Normalized average yield on interest earning assets (7)
|
2.86%
|
2.82%
|
3.11%
|
|
Average cost of interest bearing liabilities (8)
|
1.65%
|
1.59%
|
1.64%
|
|
Net interest spread
|
0.76%
|
1.64%
|
1.35%
|
|
Normalized net interest spread
|
1.21%
|
1.23%
|
1.47%
|
| |
(1) |
Includes loans held for sale. Excluding loans held for sale, the weighted average yield on commercial real estate debt and preferred equity was 7.63% at September 30, 2015.
|
| |
(2) |
Excludes real estate held-for-sale. |
| |
(3) |
Measures total notional balances of interest rate swaps, interest rate swaptions and futures relative to repurchase agreements and TBA notional outstanding. |
| |
(4) |
Excludes forward starting swaps. |
| |
(5) |
Debt consists of repurchase agreements, other secured financing, Convertible Senior Notes, securitized debt, participation sold and mortgages payable. Securitized debt, participation sold and mortgages payable are non-recourse to the Company. |
| |
(6) |
Computed as the sum of recourse debt, TBA derivative notional outstanding and net forward purchases of Investment Securities divided by total equity. |
| |
(7) |
Average interest earning assets reflects the average amortized cost of our investments during the period. |
| |
(8) |
Includes interest expense on interest rate swaps used to hedge cost of funds. |
Other Information
Annaly’s principal business objective is to generate net income for distribution to its shareholders from its investments. Annaly is a Maryland corporation that has elected to be taxed as a real estate investment trust (“REIT”). Annaly is managed and advised by Annaly Management Company LLC.
The Company prepares a supplement to provide additional quarterly information for the benefit of its shareholders. The supplement can be found at the Company’s website in the Investors section under Investor Presentations.
Conference Call
The Company will hold the third quarter 2015 earnings conference call on November 5, 2015 at 10:00 a.m. Eastern Time. The number to call is 888-317-6003 for domestic calls and 412-317-6061 for international calls. The conference passcode is 5317373. There will also be an audio webcast of the call on www.annaly.com. The replay of the call is available for one week following the conference call. The replay number is 877-344-7529 for domestic calls and 412-317-0088 for international calls and the conference passcode is 10074993. If you would like to be added to the e-mail distribution list, please visit www.annaly.com, click on Investor Relations, then select Email Alerts and complete the email notification form.
This news release and our public documents to which we refer contain or incorporate by reference certain forward-looking statements which are based on various assumptions (some of which are beyond our control) and may be identified by reference to a future period or periods or by the use of forward-looking terminology, such as "may," "will," "believe," "expect," "anticipate," "continue," or similar terms or variations on those terms or the negative of those terms. Actual results could differ materially from those set forth in forward-looking statements due to a variety of factors, including, but not limited to, changes in interest rates; changes in the yield curve; changes in prepayment rates; the availability of mortgage-backed securities and other securities for purchase; the availability of financing and, if available, the terms of any financings; changes in the market value of our assets; changes in business conditions and the general economy; our ability to grow the commercial mortgage business; credit risks related to our investments in Agency CRT securities, residential mortgage-backed securities and related residential mortgage credit assets, commercial real estate assets and corporate debt; our ability to grow our residential mortgage credit business; our ability to consummate any contemplated investment opportunities; changes in government regulations affecting our business; our ability to maintain our qualification as a REIT for federal income tax purposes; and our ability to maintain our exemption from registration under the Investment Company Act of 1940, as amended. For a discussion of the risks and uncertainties which could cause actual results to differ from those contained in the forward-looking statements, see "Risk Factors" in our most recent Annual Report on Form 10-K and any subsequent Quarterly Reports on Form 10-Q. We do not undertake, and specifically disclaim any obligation, to publicly release the result of any revisions which may be made to any forward-looking statements to reflect the occurrence of anticipated or unanticipated events or circumstances after the date of such statements.
|
ANNALY CAPITAL MANAGEMENT, INC. AND SUBSIDIARIES
|
|
CONSOLIDATED STATEMENTS OF FINANCIAL CONDITION
|
|
(dollars in thousands, except per share data)
|
| |
|
|
|
|
|
|
|
|
|
|
|
|
|
|
|
| |
|
September 30,
|
|
|
June 30,
|
|
|
March 31,
|
|
|
December 31,
|
|
|
September 30,
|
|
| |
|
2015
|
|
|
2015
|
|
|
2015
|
|
|
2014(1)
|
|
|
2014
|
|
| |
|
(Unaudited)
|
|
|
(Unaudited)
|
|
|
(Unaudited)
|
|
|
|
|
|
(Unaudited)
|
|
|
ASSETS
|
|
|
|
|
|
|
|
|
|
|
|
|
|
|
|
| |
|
|
|
|
|
|
|
|
|
|
|
|
|
|
|
|
Cash and cash equivalents
|
|
$ |
2,237,423 |
|
|
$ |
1,785,158 |
|
|
$ |
1,920,326 |
|
|
$ |
1,741,244 |
|
|
$ |
1,178,621 |
|
|
Reverse repurchase agreements
|
|
|
- |
|
|
|
- |
|
|
|
100,000 |
|
|
|
100,000 |
|
|
|
- |
|
|
Investments, at fair value:
|
|
|
|
|
|
|
|
|
|
|
|
|
|
|
|
|
|
|
|
|
|
Agency mortgage-backed securities
|
|
|
65,806,640 |
|
|
|
67,605,287 |
|
|
|
69,388,001 |
|
|
|
81,565,256 |
|
|
|
81,462,387 |
|
|
Agency debentures
|
|
|
413,115 |
|
|
|
429,845 |
|
|
|
995,408 |
|
|
|
1,368,350 |
|
|
|
1,334,181 |
|
|
Credit risk transfer securities
|
|
|
330,727 |
|
|
|
214,130 |
|
|
|
108,337 |
|
|
|
- |
|
|
|
- |
|
|
Non-Agency mortgage-backed securities
|
|
|
490,037 |
|
|
|
- |
|
|
|
- |
|
|
|
- |
|
|
|
- |
|
|
Commercial real estate debt investments (2)
|
|
|
2,881,659 |
|
|
|
2,812,824 |
|
|
|
1,515,903 |
|
|
|
- |
|
|
|
- |
|
|
Investment in affiliate
|
|
|
- |
|
|
|
123,343 |
|
|
|
141,246 |
|
|
|
143,045 |
|
|
|
136,748 |
|
|
Commercial real estate debt and preferred equity, held for investment (3)
|
|
|
1,316,595 |
|
|
|
1,332,955 |
|
|
|
1,498,406 |
|
|
|
1,518,165 |
|
|
|
1,554,958 |
|
|
Loans held for sale
|
|
|
476,550 |
|
|
|
- |
|
|
|
- |
|
|
|
- |
|
|
|
- |
|
|
Investments in commercial real estate
|
|
|
301,447 |
|
|
|
216,800 |
|
|
|
207,209 |
|
|
|
210,032 |
|
|
|
73,827 |
|
|
Corporate debt
|
|
|
424,974 |
|
|
|
311,640 |
|
|
|
227,830 |
|
|
|
166,464 |
|
|
|
144,451 |
|
|
Receivable for investments sold
|
|
|
127,571 |
|
|
|
247,361 |
|
|
|
2,009,937 |
|
|
|
1,010,094 |
|
|
|
855,161 |
|
|
Accrued interest and dividends receivable
|
|
|
228,169 |
|
|
|
234,006 |
|
|
|
247,801 |
|
|
|
278,489 |
|
|
|
287,231 |
|
|
Receivable for investment advisory income
|
|
|
3,992 |
|
|
|
10,589 |
|
|
|
10,268 |
|
|
|
10,402 |
|
|
|
8,369 |
|
|
Goodwill
|
|
|
71,815 |
|
|
|
71,815 |
|
|
|
94,781 |
|
|
|
94,781 |
|
|
|
94,781 |
|
|
Interest rate swaps, at fair value
|
|
|
39,295 |
|
|
|
30,259 |
|
|
|
25,908 |
|
|
|
75,225 |
|
|
|
198,066 |
|
|
Other derivatives, at fair value
|
|
|
87,516 |
|
|
|
38,074 |
|
|
|
113,503 |
|
|
|
5,499 |
|
|
|
19,407 |
|
|
Other assets
|
|
|
101,162 |
|
|
|
81,594 |
|
|
|
70,813 |
|
|
|
68,321 |
|
|
|
39,798 |
|
| |
|
|
|
|
|
|
|
|
|
|
|
|
|
|
|
|
|
|
|
|
|
Total assets
|
|
$ |
75,338,687 |
|
|
$ |
75,545,680 |
|
|
$ |
78,675,677 |
|
|
$ |
88,355,367 |
|
|
$ |
87,387,986 |
|
| |
|
|
|
|
|
|
|
|
|
|
|
|
|
|
|
|
|
|
|
|
|
LIABILITIES AND STOCKHOLDERS’ EQUITY
|
|
|
|
|
|
|
|
|
|
|
|
|
|
|
|
|
|
|
|
|
| |
|
|
|
|
|
|
|
|
|
|
|
|
|
|
|
|
|
|
|
|
|
Liabilities:
|
|
|
|
|
|
|
|
|
|
|
|
|
|
|
|
|
|
|
|
|
|
Repurchase agreements
|
|
$ |
56,449,364 |
|
|
$ |
57,459,552 |
|
|
$ |
60,477,378 |
|
|
$ |
71,361,926 |
|
|
$ |
69,610,722 |
|
|
Other secured financing
|
|
|
359,970 |
|
|
|
203,200 |
|
|
|
90,000 |
|
|
|
- |
|
|
|
- |
|
|
Securities loaned
|
|
|
- |
|
|
|
- |
|
|
|
- |
|
|
|
- |
|
|
|
7 |
|
|
Convertible Senior Notes
|
|
|
- |
|
|
|
- |
|
|
|
749,512 |
|
|
|
845,295 |
|
|
|
836,625 |
|
|
Securitized debt of consolidated VIEs (4)
|
|
|
2,553,398 |
|
|
|
2,610,974 |
|
|
|
1,491,829 |
|
|
|
260,700 |
|
|
|
260,700 |
|
|
Mortgages payable
|
|
|
166,697 |
|
|
|
146,359 |
|
|
|
146,470 |
|
|
|
146,553 |
|
|
|
42,635 |
|
|
Participation sold
|
|
|
13,389 |
|
|
|
13,490 |
|
|
|
13,589 |
|
|
|
13,693 |
|
|
|
13,768 |
|
|
Payable for investments purchased
|
|
|
744,378 |
|
|
|
673,933 |
|
|
|
5,205 |
|
|
|
264,984 |
|
|
|
2,153,789 |
|
|
Accrued interest payable
|
|
|
145,554 |
|
|
|
131,629 |
|
|
|
155,072 |
|
|
|
180,501 |
|
|
|
180,345 |
|
|
Dividends payable
|
|
|
284,348 |
|
|
|
284,331 |
|
|
|
284,310 |
|
|
|
284,293 |
|
|
|
284,278 |
|
|
Interest rate swaps, at fair value
|
|
|
2,160,350 |
|
|
|
1,328,729 |
|
|
|
2,025,170 |
|
|
|
1,608,286 |
|
|
|
857,658 |
|
|
Other derivatives, at fair value
|
|
|
113,626 |
|
|
|
40,539 |
|
|
|
61,778 |
|
|
|
8,027 |
|
|
|
- |
|
|
Accounts payable and other liabilities
|
|
|
63,280 |
|
|
|
58,139 |
|
|
|
50,774 |
|
|
|
47,328 |
|
|
|
36,511 |
|
| |
|
|
|
|
|
|
|
|
|
|
|
|
|
|
|
|
|
|
|
|
|
Total liabilities
|
|
|
63,054,354 |
|
|
|
62,950,875 |
|
|
|
65,551,087 |
|
|
|
75,021,586 |
|
|
|
74,277,038 |
|
| |
|
|
|
|
|
|
|
|
|
|
|
|
|
|
|
|
|
|
|
|
|
Stockholders’ Equity:
|
|
|
|
|
|
|
|
|
|
|
|
|
|
|
|
|
|
|
|
|
|
7.875% Series A Cumulative Redeemable Preferred Stock:
7,412,500 authorized, issued and outstanding
|
|
|
177,088 |
|
|
|
177,088 |
|
|
|
177,088 |
|
|
|
177,088 |
|
|
|
177,088 |
|
|
7.625% Series C Cumulative Redeemable Preferred Stock
12,650,000 authorized, 12,000,000 issued and outstanding
|
|
|
290,514 |
|
|
|
290,514 |
|
|
|
290,514 |
|
|
|
290,514 |
|
|
|
290,514 |
|
|
7.50% Series D Cumulative Redeemable Preferred Stock:
18,400,000 authorized, issued and outstanding
|
|
|
445,457 |
|
|
|
445,457 |
|
|
|
445,457 |
|
|
|
445,457 |
|
|
|
445,457 |
|
|
Common stock, par value $0.01 per share, 1,956,937,500 authorized, 947,826,176, 947,768,496,
|
|
|
|
|
|
|
|
|
|
|
|
|
|
|
|
|
|
|
|
|
| 947,698,431, 947,643,079 and 947,591,766 issued and outstanding, respectively |
|
|
9,478 |
|
|
|
9,478 |
|
|
|
9,477 |
|
|
|
9,476 |
|
|
|
9,476 |
|
|
Additional paid-in capital
|
|
|
14,789,320 |
|
|
|
14,788,677 |
|
|
|
14,787,117 |
|
|
|
14,786,509 |
|
|
|
14,781,308 |
|
|
Accumulated other comprehensive income (loss)
|
|
|
262,855 |
|
|
|
(354,965 |
) |
|
|
773,999 |
|
|
|
204,883 |
|
|
|
(967,820 |
) |
|
Accumulated deficit
|
|
|
(3,695,884 |
) |
|
|
(2,766,250 |
) |
|
|
(3,364,147 |
) |
|
|
(2,585,436 |
) |
|
|
(1,625,075 |
) |
| |
|
|
|
|
|
|
|
|
|
|
|
|
|
|
|
|
|
|
|
|
|
Total stockholders’ equity
|
|
|
12,278,828 |
|
|
|
12,589,999 |
|
|
|
13,119,505 |
|
|
|
13,328,491 |
|
|
|
13,110,948 |
|
| |
|
|
|
|
|
|
|
|
|
|
|
|
|
|
|
|
|
|
|
|
|
Noncontrolling interest
|
|
|
5,505 |
|
|
|
4,806 |
|
|
|
5,085 |
|
|
|
5,290 |
|
|
|
- |
|
| |
|
|
|
|
|
|
|
|
|
|
|
|
|
|
|
|
|
|
|
|
|
Total equity
|
|
|
12,284,333 |
|
|
|
12,594,805 |
|
|
|
13,124,590 |
|
|
|
13,333,781 |
|
|
|
13,110,948 |
|
| |
|
|
|
|
|
|
|
|
|
|
|
|
|
|
|
|
|
|
|
|
|
Total liabilities and equity
|
|
$ |
75,338,687 |
|
|
$ |
75,545,680 |
|
|
$ |
78,675,677 |
|
|
$ |
88,355,367 |
|
|
$ |
87,387,986 |
|
| (1) |
Derived from the audited consolidated financial statements at December 31, 2014. |
| (2) |
Includes senior securitized commercial mortgage loans of consolidated VIEs with a carrying value of $2.6 billion, $2.6 billion and $1.4 billion at September 30, 2015, June 30, 2015 and March 31, 2015, respectively. |
| (3) |
Includes senior securitized commercial mortgage loans of consolidated VIE with a carrying value of $314.9 million, $361.2 million, $361.2 million, $398.6 million and $398.4 million at September 30, 2015, June 30, 2015, March 31, 2015, December 31, 2014, and September 30, 2014, respectively. |
| (4) |
Includes securitized debt of consolidated VIEs carried at fair value of $2.4 billion, $2.4 billion and $1.3 billion at September 30, 2015, June 30, 2015 and March 31, 2015, respectively. |
|
ANNALY CAPITAL MANAGEMENT, INC. AND SUBSIDIARIES
|
|
CONSOLIDATED STATEMENTS OF COMPREHENSIVE INCOME (LOSS)
|
|
(UNAUDITED)
|
|
(dollars in thousands, except per share data)
|
| |
|
|
|
|
|
|
|
|
|
|
|
|
|
|
|
| |
|
For the quarters ended
|
|
| |
|
September 30,
|
|
|
June 30,
|
|
|
March 31,
|
|
|
December 31,
|
|
|
September 30,
|
|
| |
|
2015
|
|
|
2015
|
|
|
2015
|
|
|
2014
|
|
|
2014
|
|
|
Net interest income:
|
|
|
|
|
|
|
|
|
|
|
|
|
|
|
|
|
Interest income
|
|
$ |
450,792 |
|
|
$ |
624,346 |
|
|
$ |
519,172 |
|
|
$ |
648,144 |
|
|
$ |
644,640 |
|
|
Interest expense
|
|
|
110,297 |
|
|
|
113,072 |
|
|
|
129,420 |
|
|
|
134,512 |
|
|
|
127,069 |
|
|
Net interest income
|
|
|
340,495 |
|
|
|
511,274 |
|
|
|
389,752 |
|
|
|
513,632 |
|
|
|
517,571 |
|
| |
|
|
|
|
|
|
|
|
|
|
|
|
|
|
|
|
|
|
|
|
|
Realized and unrealized gains (losses):
|
|
|
|
|
|
|
|
|
|
|
|
|
|
|
|
|
|
|
|
|
|
Realized gains (losses) on interest rate swaps(1)
|
|
|
(162,304 |
) |
|
|
(144,465 |
) |
|
|
(158,239 |
) |
|
|
(174,908 |
) |
|
|
(169,083 |
) |
|
Realized gains (losses) on termination of interest rate swaps
|
|
|
- |
|
|
|
- |
|
|
|
(226,462 |
) |
|
|
- |
|
|
|
- |
|
|
Unrealized gains (losses) on interest rate swaps
|
|
|
(822,585 |
) |
|
|
700,792 |
|
|
|
(466,202 |
) |
|
|
(873,468 |
) |
|
|
98,593 |
|
|
Subtotal
|
|
|
(984,889 |
) |
|
|
556,327 |
|
|
|
(850,903 |
) |
|
|
(1,048,376 |
) |
|
|
(70,490 |
) |
|
Net gains (losses) on disposal of investments
|
|
|
(7,943 |
) |
|
|
3,833 |
|
|
|
62,356 |
|
|
|
3,420 |
|
|
|
4,693 |
|
|
Net gains (losses) on trading assets
|
|
|
108,175 |
|
|
|
(114,230 |
) |
|
|
(6,906 |
) |
|
|
(57,454 |
) |
|
|
4,676 |
|
|
Net unrealized gains (losses) on financial instruments measured at fair value through earnings
|
|
|
(24,501 |
) |
|
|
17,581 |
|
|
|
(33,546 |
) |
|
|
(29,520 |
) |
|
|
(37,944 |
) |
|
Impairment of goodwill
|
|
|
- |
|
|
|
(22,966 |
) |
|
|
- |
|
|
|
- |
|
|
|
- |
|
|
Subtotal
|
|
|
75,731 |
|
|
|
(115,782 |
) |
|
|
21,904 |
|
|
|
(83,554 |
) |
|
|
(28,575 |
) |
|
Total realized and unrealized gains (losses)
|
|
|
(909,158 |
) |
|
|
440,545 |
|
|
|
(828,999 |
) |
|
|
(1,131,930 |
) |
|
|
(99,065 |
) |
| |
|
|
|
|
|
|
|
|
|
|
|
|
|
|
|
|
|
|
|
|
|
Other income (loss):
|
|
|
|
|
|
|
|
|
|
|
|
|
|
|
|
|
|
|
|
|
|
Investment advisory income
|
|
|
3,780 |
|
|
|
10,604 |
|
|
|
10,464 |
|
|
|
10,858 |
|
|
|
8,253 |
|
|
Dividend income from affiliate
|
|
|
- |
|
|
|
4,318 |
|
|
|
4,318 |
|
|
|
4,048 |
|
|
|
4,048 |
|
|
Other income (loss)
|
|
|
(13,521 |
) |
|
|
(22,344 |
) |
|
|
(1,082 |
) |
|
|
3,365 |
|
|
|
(22,249 |
) |
|
Total other income (loss)
|
|
|
(9,741 |
) |
|
|
(7,422 |
) |
|
|
13,700 |
|
|
|
18,271 |
|
|
|
(9,948 |
) |
| |
|
|
|
|
|
|
|
|
|
|
|
|
|
|
|
|
|
|
|
|
|
General and administrative expenses:
|
|
|
|
|
|
|
|
|
|
|
|
|
|
|
|
|
|
|
|
|
|
Compensation and management fee
|
|
|
37,450 |
|
|
|
37,014 |
|
|
|
38,629 |
|
|
|
38,734 |
|
|
|
39,028 |
|
|
Other general and administrative expenses
|
|
|
12,007 |
|
|
|
14,995 |
|
|
|
12,309 |
|
|
|
19,720 |
|
|
|
12,289 |
|
|
Total general and administrative expenses
|
|
|
49,457 |
|
|
|
52,009 |
|
|
|
50,938 |
|
|
|
58,454 |
|
|
|
51,317 |
|
| |
|
|
|
|
|
|
|
|
|
|
|
|
|
|
|
|
|
|
|
|
|
Income (loss) before income taxes
|
|
|
(627,861 |
) |
|
|
892,388 |
|
|
|
(476,485 |
) |
|
|
(658,481 |
) |
|
|
357,241 |
|
|
Income taxes
|
|
|
(370 |
) |
|
|
(7,683 |
) |
|
|
14 |
|
|
|
(209 |
) |
|
|
2,385 |
|
|
Net income (loss)
|
|
|
(627,491 |
) |
|
|
900,071 |
|
|
|
(476,499 |
) |
|
|
(658,272 |
) |
|
|
354,856 |
|
|
Net income (loss) attributable to noncontrolling interest
|
|
|
(197 |
) |
|
|
(149 |
) |
|
|
(90 |
) |
|
|
(196 |
) |
|
|
- |
|
|
Net income (loss) attributable to Annaly
|
|
|
(627,294 |
) |
|
|
900,220 |
|
|
|
(476,409 |
) |
|
|
(658,076 |
) |
|
|
354,856 |
|
|
Dividends on preferred stock
|
|
|
17,992 |
|
|
|
17,992 |
|
|
|
17,992 |
|
|
|
17,992 |
|
|
|
17,992 |
|
|
Net income (loss) available (related) to common stockholders
|
|
$ |
(645,286 |
) |
|
$ |
882,228 |
|
|
$ |
(494,401 |
) |
|
$ |
(676,068 |
) |
|
$ |
336,864 |
|
| |
|
|
|
|
|
|
|
|
|
|
|
|
|
|
|
|
|
|
|
|
|
Net income (loss) per share available (related) to common stockholders:
|
|
|
|
|
|
|
|
|
|
|
|
|
|
|
|
|
|
|
|
|
|
Basic
|
|
$ |
(0.68 |
) |
|
$ |
0.93 |
|
|
$ |
(0.52 |
) |
|
$ |
(0.71 |
) |
|
$ |
0.36 |
|
|
Diluted
|
|
$ |
(0.68 |
) |
|
$ |
0.93 |
|
|
$ |
(0.52 |
) |
|
$ |
(0.71 |
) |
|
$ |
0.35 |
|
| |
|
|
|
|
|
|
|
|
|
|
|
|
|
|
|
|
|
|
|
|
|
Weighted average number of common shares outstanding:
|
|
|
|
|
|
|
|
|
|
|
|
|
|
|
|
|
|
|
|
|
|
Basic
|
|
|
947,795,500 |
|
|
|
947,731,493 |
|
|
|
947,669,831 |
|
|
|
947,615,793 |
|
|
|
947,565,432 |
|
|
Diluted
|
|
|
947,795,500 |
|
|
|
947,929,762 |
|
|
|
947,669,831 |
|
|
|
947,615,793 |
|
|
|
987,315,527 |
|
| |
|
|
|
|
|
|
|
|
|
|
|
|
|
|
|
|
|
|
|
|
|
Net income (loss)
|
|
$ |
(627,491 |
) |
|
$ |
900,071 |
|
|
$ |
(476,499 |
) |
|
$ |
(658,272 |
) |
|
$ |
354,856 |
|
|
Other comprehensive income (loss):
|
|
|
|
|
|
|
|
|
|
|
|
|
|
|
|
|
|
|
|
|
|
Unrealized gains (losses) on available-for-sale securities
|
|
|
609,725 |
|
|
|
(1,125,043 |
) |
|
|
631,472 |
|
|
|
1,175,864 |
|
|
|
(390,871 |
) |
|
Reclassification adjustment for net (gains) losses included in net income (loss)
|
|
|
8,095 |
|
|
|
(3,921 |
) |
|
|
(62,356 |
) |
|
|
(3,161 |
) |
|
|
(4,693 |
) |
|
Other comprehensive income (loss)
|
|
|
617,820 |
|
|
|
(1,128,964 |
) |
|
|
569,116 |
|
|
|
1,172,703 |
|
|
|
(395,564 |
) |
|
Comprehensive income (loss)
|
|
|
(9,671 |
) |
|
|
(228,893 |
) |
|
|
92,617 |
|
|
|
514,431 |
|
|
|
(40,708 |
) |
|
Comprehensive income (loss) attributable to noncontrolling interest
|
|
|
(197 |
) |
|
|
(149 |
) |
|
|
(90 |
) |
|
|
(196 |
) |
|
|
- |
|
|
Comprehensive income (loss) attributable to Annaly
|
|
$ |
(9,474 |
) |
|
$ |
(228,744 |
) |
|
$ |
92,707 |
|
|
$ |
514,627 |
|
|
$ |
(40,708 |
) |
| (1) |
Interest expense related to the Company’s interest rate swaps is recorded in Realized gains (losses) on interest rate swaps on the Consolidated Statements of Comprehensive Income (Loss). |
|
ANNALY CAPITAL MANAGEMENT, INC. AND SUBSIDIARIES
|
|
CONSOLIDATED STATEMENTS OF COMPREHENSIVE INCOME (LOSS)
|
|
(dollars in thousands, except per share data)
|
|
(Unaudited)
|
| |
|
|
|
|
|
|
| |
|
For the nine months
|
|
| |
|
September 30,
|
|
|
September 30,
|
|
| |
|
2015
|
|
|
2014
|
|
| |
|
|
|
|
|
|
|
Net interest income:
|
|
|
|
|
|
|
|
Interest income
|
|
$ |
1,594,310 |
|
|
$ |
1,984,503 |
|
|
Interest expense
|
|
|
352,789 |
|
|
|
378,147 |
|
|
Net interest income
|
|
|
1,241,521 |
|
|
|
1,606,356 |
|
| |
|
|
|
|
|
|
|
|
|
Realized and unrealized gains (losses):
|
|
|
|
|
|
|
|
|
|
Realized gains (losses) on interest rate swaps(1)
|
|
|
(465,008 |
) |
|
|
(650,452 |
) |
|
Realized gains (losses) on termination of interest rate swaps
|
|
|
(226,462 |
) |
|
|
(779,333 |
) |
|
Unrealized gains (losses) on interest rate swaps
|
|
|
(587,995 |
) |
|
|
(75,287 |
) |
|
Subtotal
|
|
|
(1,279,465 |
) |
|
|
(1,505,072 |
) |
|
Net gains (losses) on disposal of investments
|
|
|
58,246 |
|
|
|
90,296 |
|
|
Net gains (losses) on trading assets
|
|
|
(12,961 |
) |
|
|
(188,041 |
) |
|
Net unrealized gains (losses) on financial instruments measured at fair value through earnings
|
|
|
(40,466 |
) |
|
|
(56,652 |
) |
|
Impairment of goodwill
|
|
|
(22,966 |
) |
|
|
- |
|
|
Subtotal
|
|
|
(18,147 |
) |
|
|
(154,397 |
) |
|
Total realized and unrealized gains (losses)
|
|
|
(1,297,612 |
) |
|
|
(1,659,469 |
) |
| |
|
|
|
|
|
|
|
|
|
Other income (loss):
|
|
|
|
|
|
|
|
|
|
Investment advisory income
|
|
|
24,848 |
|
|
|
20,485 |
|
|
Dividend income from affiliate
|
|
|
8,636 |
|
|
|
21,141 |
|
|
Other income (loss)
|
|
|
(36,947 |
) |
|
|
(16,102 |
) |
|
Total other income (loss)
|
|
|
(3,463 |
) |
|
|
25,524 |
|
| |
|
|
|
|
|
|
|
|
|
General and administrative expenses:
|
|
|
|
|
|
|
|
|
|
Compensation and management fee
|
|
|
113,093 |
|
|
|
116,826 |
|
|
Other general and administrative expenses
|
|
|
39,311 |
|
|
|
34,058 |
|
|
Total general and administrative expenses
|
|
|
152,404 |
|
|
|
150,884 |
|
| |
|
|
|
|
|
|
|
|
|
Income (loss) before income taxes
|
|
|
(211,958 |
) |
|
|
(178,473 |
) |
|
Income taxes
|
|
|
(8,039 |
) |
|
|
5,534 |
|
|
Net income (loss)
|
|
|
(203,919 |
) |
|
|
(184,007 |
) |
|
Net income (loss) attributable to noncontrolling interest
|
|
|
(436 |
) |
|
|
- |
|
|
Net income (loss) attributable to Annaly
|
|
|
(203,483 |
) |
|
|
(184,007 |
) |
|
Dividends on preferred stock
|
|
|
53,976 |
|
|
|
53,976 |
|
|
Net income (loss) available (related) to common stockholders
|
|
$ |
(257,459 |
) |
|
$ |
(237,983 |
) |
| |
|
|
|
|
|
|
|
|
|
Net income (loss) per share available (related) to common stockholders:
|
|
|
|
|
|
|
|
|
|
Basic
|
|
$ |
(0.27 |
) |
|
$ |
(0.25 |
) |
|
Diluted
|
|
$ |
(0.27 |
) |
|
$ |
(0.25 |
) |
| |
|
|
|
|
|
|
|
|
|
Weighted average number of common shares outstanding:
|
|
|
|
|
|
|
|
|
|
Basic
|
|
|
947,732,735 |
|
|
|
947,513,514 |
|
|
Diluted
|
|
|
947,732,735 |
|
|
|
947,513,514 |
|
| |
|
|
|
|
|
|
|
|
|
Net income (loss)
|
|
$ |
(203,919 |
) |
|
$ |
(184,007 |
) |
|
Other comprehensive income (loss):
|
|
|
|
|
|
|
|
|
|
Unrealized gains (losses) on available-for-sale securities
|
|
|
116,154 |
|
|
|
1,872,427 |
|
|
Reclassification adjustment for net (gains) losses included in net income (loss)
|
|
|
(58,182 |
) |
|
|
(91,314 |
) |
|
Other comprehensive income (loss)
|
|
|
57,972 |
|
|
|
1,781,113 |
|
|
Comprehensive income (loss)
|
|
|
(145,947 |
) |
|
|
1,597,106 |
|
|
Comprehensive income (loss) attributable to noncontrolling interest
|
|
|
(436 |
) |
|
|
- |
|
|
Comprehensive income (loss) attributable to Annaly
|
|
$ |
(145,511 |
) |
|
$ |
1,597,106 |
|
| (1) |
Interest expense related to the Company’s interest rate swaps is recorded in Realized gains (losses) on interest rate swaps on the Consolidated Statements of Comprehensive Income (Loss). |
11
Exhibit 99.2
0 Third Quarter 2015 Supplemental Information November 4, 2015

1 1 Safe Harbor Notice This news release and our public documents to which we refer contain or incorporate by reference certain forward-looking statements which are based on various assumptions (some of which are beyond our control) and may be identified by reference to a future period or periods or by the use of forward-looking terminology, such as "may," "will," "believe," "expect," "anticipate," "continue," or similar terms or variations on those terms or the negative of those terms. Actual results could differ materially from those set forth in forward-looking statements due to a variety of factors, including, but not limited to, changes in interest rates; changes in the yield curve; changes in prepayment rates; the availability of mortgage-backed securities and other securities for purchase; the availability of financing and, if available, the terms of any financings; changes in the market value of our assets; changes in business conditions and the general economy; our ability to grow the commercial mortgage business; credit risks related to our investments in Agency CRT securities, residential mortgage-backed securities and related residential mortgage credit assets, commercial real estate assets and corporate debt; our ability to grow our residential mortgage credit business; our ability to consummate any contemplated investment opportunities; changes in government regulations affecting our business; our ability to maintain our qualification as a REIT for federal income tax purposes; and our ability to maintain our exemption from registration under the Investment Company Act of 1940, as amended. For a discussion of the risks and uncertainties which could cause actual results to differ from those contained in the forward-looking statements, see "Risk Factors" in our most recent Annual Report on Form 10-K and any subsequent Quarterly Reports on Form 10-Q. We do not undertake, and specifically disclaim any obligation, to publicly release the result of any revisions which may be made to any forward-looking statements to reflect the occurrence of anticipated or unanticipated events or circumstances after the date of such statements.
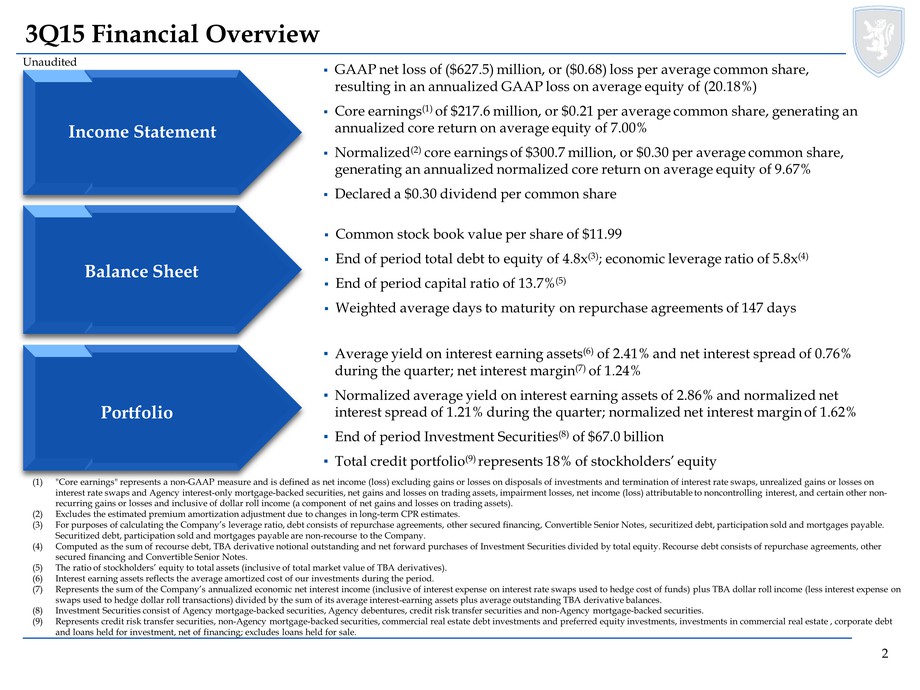
2 2 3Q15 Financial Overview (1)"Core earnings" represents a non-GAAP measure and is defined as net income (loss) excluding gains or losses on disposals of investments and termination of interest rate swaps, unrealized gains or losses on interest rate swaps and Agency interest-only mortgage-backed securities, net gains and losses on trading assets, impairment losses, net income (loss) attributable to noncontrolling interest, and certain other non-recurring gains or losses and inclusive of dollar roll income (a component of net gains and losses on trading assets). (2)Excludes the estimated premium amortization adjustment due to changes in long-term CPR estimates. (3)For purposes of calculating the Company’s leverage ratio, debt consists of repurchase agreements, other secured financing, Convertible Senior Notes, securitized debt, participation sold and mortgages payable. Securitized debt, participation sold and mortgages payable are non-recourse to the Company. (4)Computed as the sum of recourse debt, TBA derivative notional outstanding and net forward purchases of Investment Securities divided by total equity. Recourse debt consists of repurchase agreements, other secured financing and Convertible Senior Notes. (5)The ratio of stockholders’ equity to total assets (inclusive of total market value of TBA derivatives). (6)Interest earning assets reflects the average amortized cost of our investments during the period. (7)Represents the sum of the Company’s annualized economic net interest income (inclusive of interest expense on interest rate swaps used to hedge cost of funds) plus TBA dollar roll income (less interest expense on swaps used to hedge dollar roll transactions) divided by the sum of its average interest-earning assets plus average outstanding TBA derivative balances. (8)Investment Securities consist of Agency mortgage-backed securities, Agency debentures, credit risk transfer securities and non-Agency mortgage-backed securities. (9)Represents credit risk transfer securities, non-Agency mortgage-backed securities, commercial real estate debt investments and preferred equity investments, investments in commercial real estate , corporate debt and loans held for investment, net of financing; excludes loans held for sale. GAAP net loss of ($627.5) million, or ($0.68) loss per average common share, resulting in an annualized GAAP loss on average equity of (20.18%) Core earnings(1) of $217.6 million, or $0.21 per average common share, generating an annualized core return on average equity of 7.00% Normalized(2) core earnings of $300.7 million, or $0.30 per average common share, generating an annualized normalized core return on average equity of 9.67% Declared a $0.30 dividend per common share Common stock book value per share of $11.99 End of period total debt to equity of 4.8x(3); economic leverage ratio of 5.8x(4) End of period capital ratio of 13.7%(5) Weighted average days to maturity on repurchase agreements of 147 days ▪Average yield on interest earning assets(6) of 2.41% and net interest spread of 0.76% during the quarter; net interest margin(7) of 1.24% Normalized average yield on interest earning assets of 2.86% and normalized net interest spread of 1.21% during the quarter; normalized net interest margin of 1.62% End of period Investment Securities(8) of $67.0 billion Total credit portfolio(9) represents 18% of stockholders’ equity Income Statement Balance Sheet Portfolio Unaudited
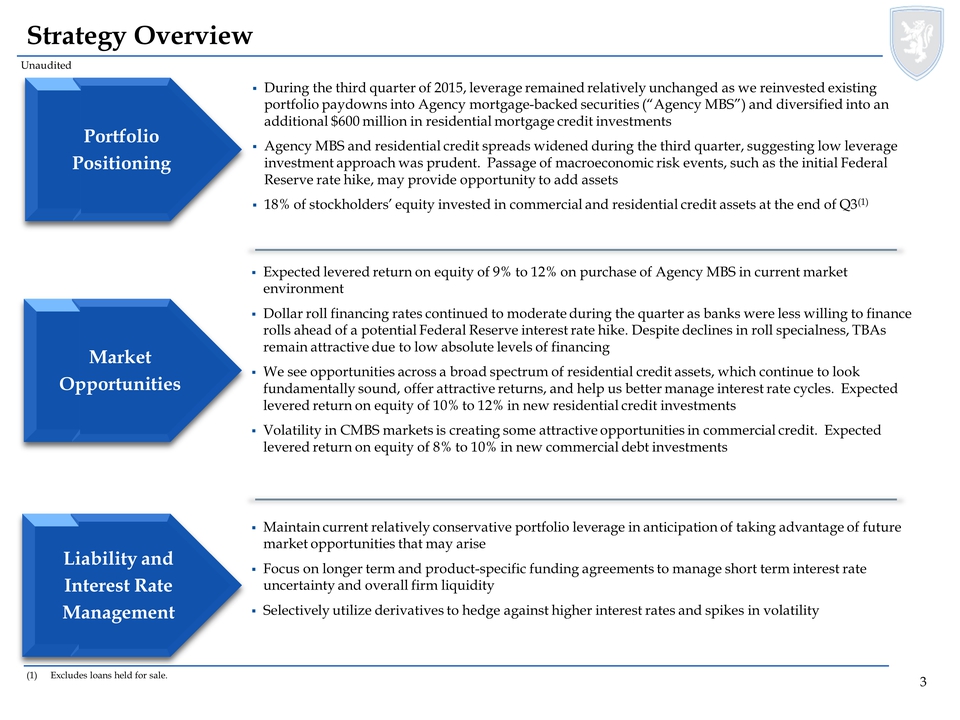
Strategy Overview Portfolio Positioning Market Opportunities Liability and Interest Rate Management Unaudited During the third quarter of 2015, leverage remained relatively unchanged as we reinvested existing portfolio paydowns into Agency mortgage-backed securities (“Agency MBS”) and diversified into an additional $600 million in residential mortgage credit investments Agency MBS and residential credit spreads widened during the third quarter, suggesting low leverage investment approach was prudent. Passage of macroeconomic risk events, such as the initial Federal Reserve rate hike, may provide opportunity to add assets 18% of stockholders’ equity invested in commercial and residential credit assets at the end of Q3(1) Expected levered return on equity of 9% to 12% on purchase of Agency MBS in current market environment Dollar roll financing rates continued to moderate during the quarter as banks were less willing to finance rolls ahead of a potential Federal Reserve interest rate hike. Despite declines in roll specialness, TBAs remain attractive due to low absolute levels of financing We see opportunities across a broad spectrum of residential credit assets, which continue to look fundamentally sound, offer attractive returns, and help us better manage interest rate cycles. Expected levered return on equity of 10% to 12% in new residential credit investments Volatility in CMBS markets is creating some attractive opportunities in commercial credit. Expected levered return on equity of 8% to 10% in new commercial debt investments Maintain current relatively conservative portfolio leverage in anticipation of taking advantage of future market opportunities that may arise Focus on longer term and product-specific funding agreements to manage short term interest rate uncertainty and overall firm liquidity Selectively utilize derivatives to hedge against higher interest rates and spikes in volatility
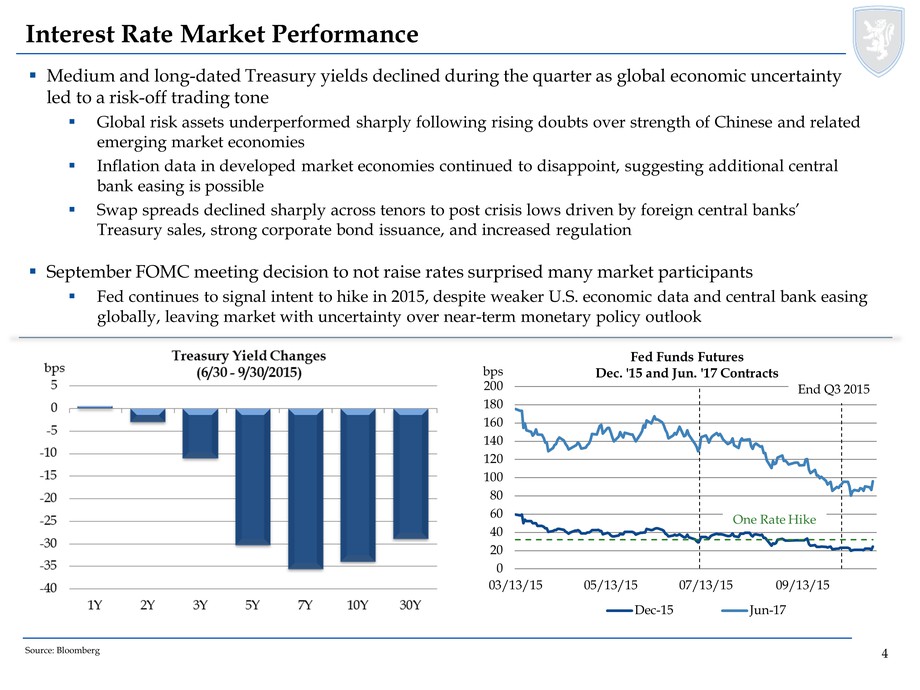
4 4 Interest Rate Market Performance Source: Bloomberg Medium and long-dated Treasury yields declined during the quarter as global economic uncertainty led to a risk-off trading tone Global risk assets underperformed sharply following rising doubts over strength of Chinese and related emerging market economies Inflation data in developed market economies continued to disappoint, suggesting additional central bank easing is possible Swap spreads declined sharply across tenors to post crisis lows driven by foreign central banks’ Treasury sales, strong corporate bond issuance, and increased regulation September FOMC meeting decision to not raise rates surprised many market participants Fed continues to signal intent to hike in 2015, despite weaker U.S. economic data and central bank easing globally, leaving market with uncertainty over near-term monetary policy outlook 0 20 40 60 80 100 120 140 160 180 200 03/13/15 05/13/15 07/13/15 09/13/15bps Fed Funds Futures Dec. '15 and Jun. '17 Contracts Dec-15 Jun-17End Q3 2015 One Rate Hike
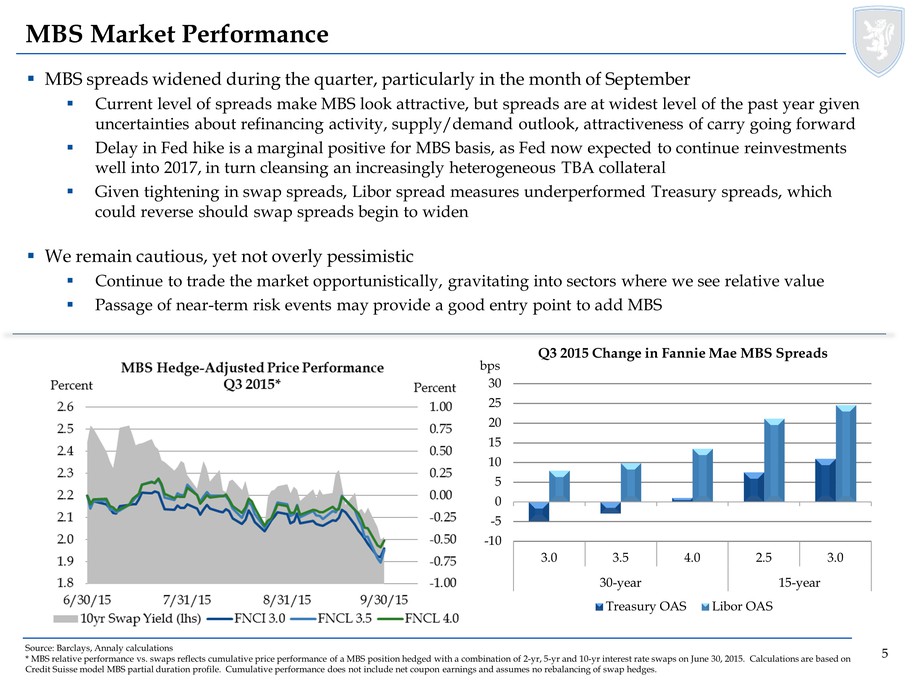
5 5 MBS Market Performance Source: Barclays, Annaly calculations * MBS relative performance vs. swaps reflects cumulative price performance of a MBS position hedged with a combination of 2-yr, 5-yr and 10-yr interest rate swaps on June 30, 2015. Calculations are based on Credit Suisse model MBS partial duration profile. Cumulative performance does not include net coupon earnings and assumes no rebalancing of swap hedges. MBS spreads widened during the quarter, particularly in the month of September Current level of spreads make MBS look attractive, but spreads are at widest level of the past year given uncertainties about refinancing activity, supply/demand outlook, attractiveness of carry going forward Delay in Fed hike is a marginal positive for MBS basis, as Fed now expected to continue reinvestments well into 2017, in turn cleansing an increasingly heterogeneous TBA collateral Given tightening in swap spreads, Libor spread measures underperformed Treasury spreads, which could reverse should swap spreads begin to widen We remain cautious, yet not overly pessimistic Continue to trade the market opportunistically, gravitating into sectors where we see relative value Passage of near-term risk events may provide a good entry point to add MBS -10 -5 0 5 10 15 20 25 30 3.0 3.5 4.0 2.5 3.0 30-year 15-yearbps Q3 2015 Change in Fannie Mae MBS Spreads Treasury OAS Libor OAS
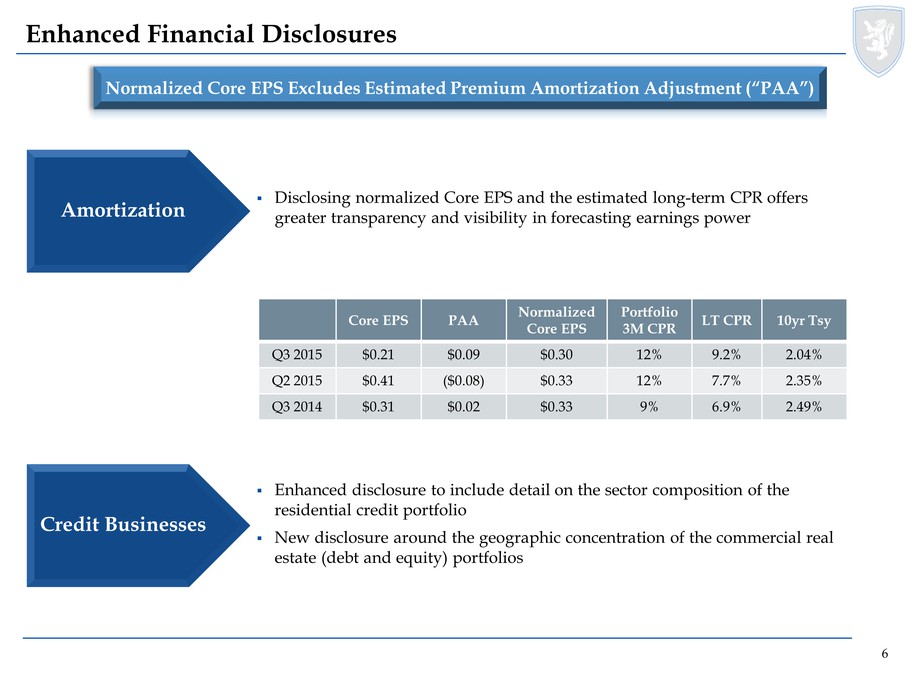
6 6 Enhanced Financial Disclosures Normalized Core EPS Excludes Estimated Premium Amortization Adjustment (“PAA”) Amortization Credit Businesses Disclosing normalized Core EPS and the estimated long-term CPR offers greater transparency and visibility in forecasting earnings power Enhanced disclosure to include detail on the sector composition of the residential credit portfolio New disclosure around the geographic concentration of the commercial real estate (debt and equity) portfolios
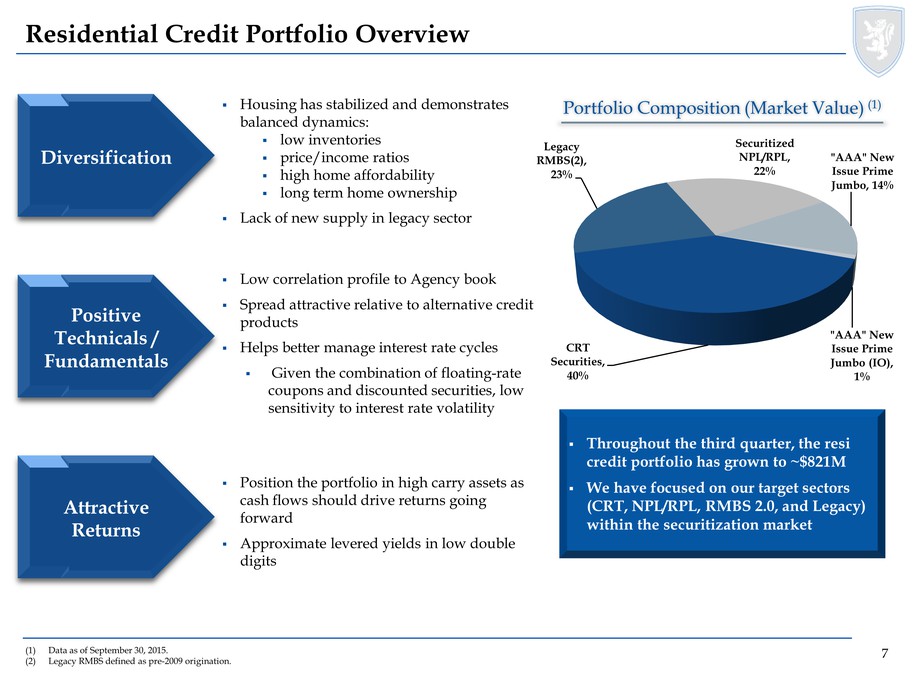
7 7 Residential Credit Portfolio Overview Portfolio Composition (Market Value) (1) Low correlation profile to Agency book Spread attractive relative to alternative credit products Helps better manage interest rate cycles Given the combination of floating-rate coupons and discounted securities, low sensitivity to interest rate volatility (1)Data as of September 30, 2015. (2)Legacy RMBS defined as pre-2009 origination. Housing has stabilized and demonstrates balanced dynamics: low inventories price/income ratios high home affordability long term home ownership Lack of new supply in legacy sector Throughout the third quarter, the resi credit portfolio has grown to ~$821M We have focused on our target sectors (CRT, NPL/RPL, RMBS 2.0, and Legacy) within the securitization market Position the portfolio in high carry assets as cash flows should drive returns going forward Approximate
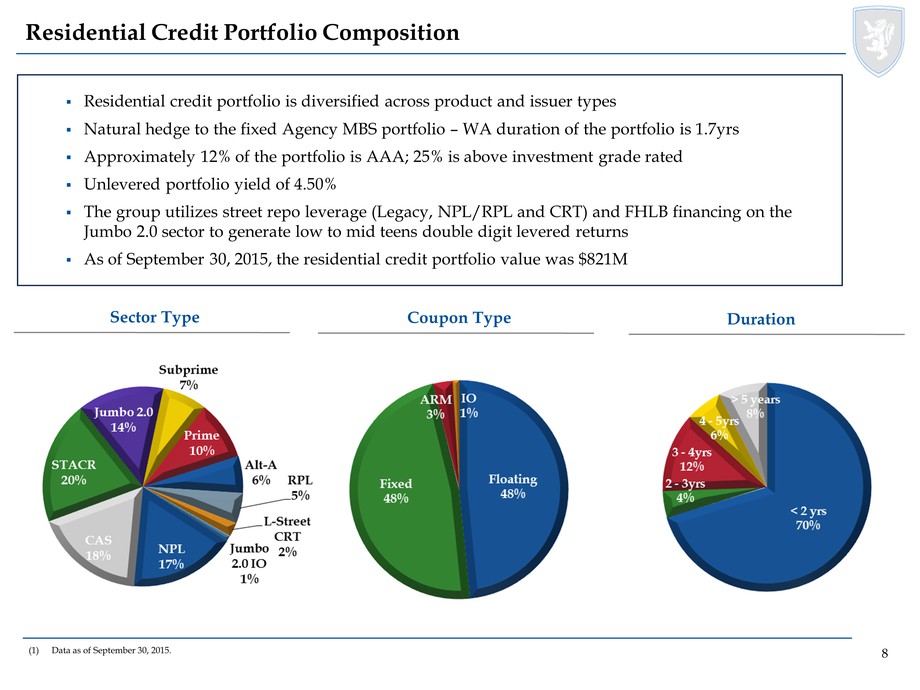
8 8 Residential Credit Portfolio Composition (1)Data as of September 30, 2015. Residential credit portfolio is diversified across product and issuer types Natural hedge to the fixed Agency MBS portfolio – WA duration of the portfolio is 1.7yrs Approximately 12% of the portfolio is AAA; 25% is above investment grade rated Unlevered portfolio yield of 4.50% The group utilizes street repo leverage (Legacy, NPL/RPL and CRT) and FHLB financing on the Jumbo 2.0 sector to generate low to mid teens double digit levered returns As of September 30, 2015, the residential credit portfolio value was $821M Sector Type Coupon Type Duration
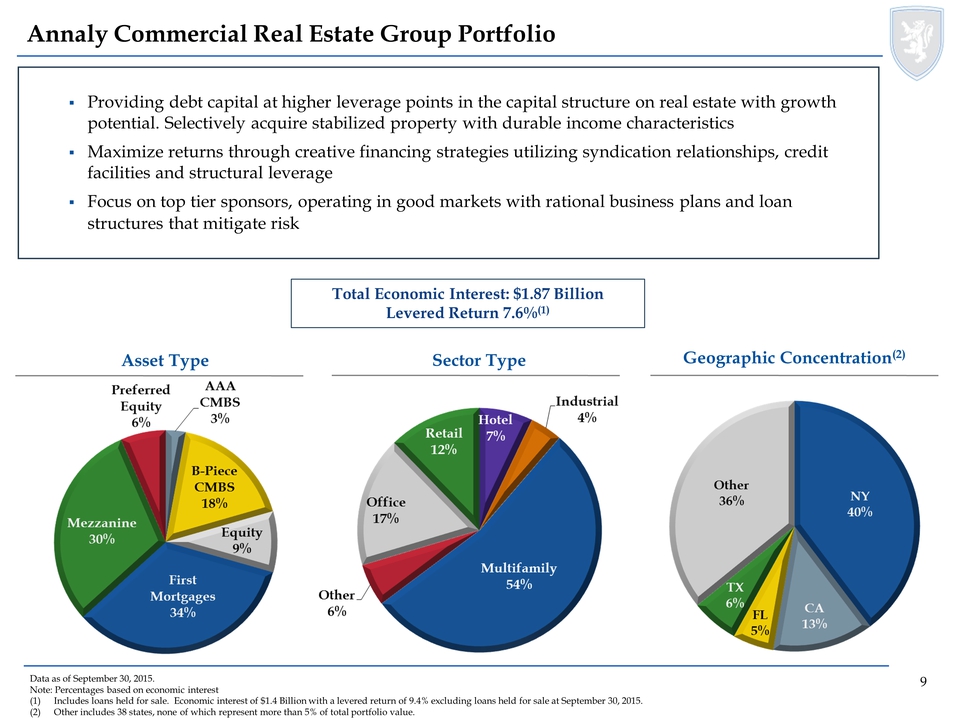
Annaly Commercial Real Estate Group Portfolio Data as of September 30, 2015. Note: Percentages based on economic interest (1) Includes loans held for sale. Economic interest of $1.4 Billion with a levered return of 9.4% excluding loans held for sale at September 30, 2015. (2) Other includes 38 states, none of which represent more than 5% of total portfolio value. Providing debt capital at higher leverage points in the capital structure on real estate with growth potential. Selectively acquire stabilized property with durable income characteristics Maximize returns through creative financing strategies utilizing syndication relationships, credit facilities and structural leverage Focus on top tier sponsors, operating in good markets with rational business plans and loan structures that mitigate risk $1.9 billion Asset Type Sector Type Geographic Concentration(2) Total Economic Interest: $1.87 Billion Levered Return 7.6%(1) Preferred Equity 6% Industrial 4% Mezzanine 30% B-Ouece /cN/bS 18% Equity 9% First Mortgages 34% Other 6% 36% 40% NY TX 6% FL 5% CA 13% Hotel 7% Retail 12% Multifamily 54%
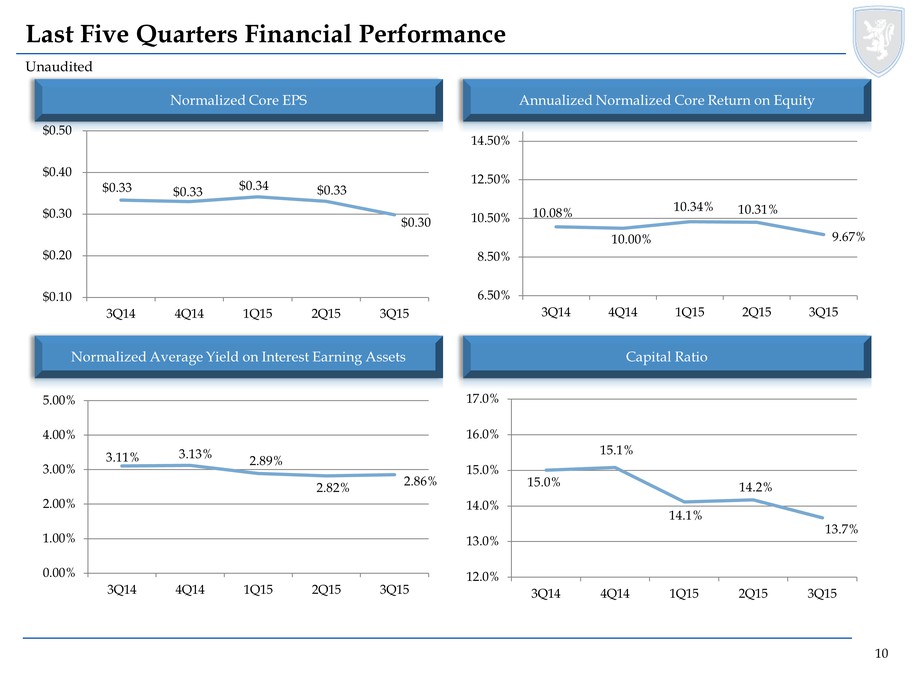
10 10 Last Five Quarters Financial Performance Unaudited Normalized Core EPS Annualized Normalized Core Return on Equity Normalized Average Yield on Interest Earning Assets Capital Ratio 15.0% 15.1% 14.1% 14.2% 13.7% 12.0% 13.0% 14.0% 15.0% 16.0% 17.0% 3Q14 4Q14 1Q15 2Q15 3Q15 $0.33 $0.33 $0.34 $0.33 $0.30 $0.10 $0.20 $0.30 $0.40 $0.50 3Q14 4Q14 1Q15 2Q15 3Q1510.08% 10.00% 10.34% 10.31% 9.67% 6.50% 8.50% 10.50% 12.50% 14.50% 3Q14 4Q14 1Q15 2Q15 3Q15 3.11% 3.13% 2.89% 2.82% 2.86% 0.00% 1.00% 2.00% 3.00% 4.00% 5.00% 3Q14 4Q14 1Q15 2Q15 3Q15
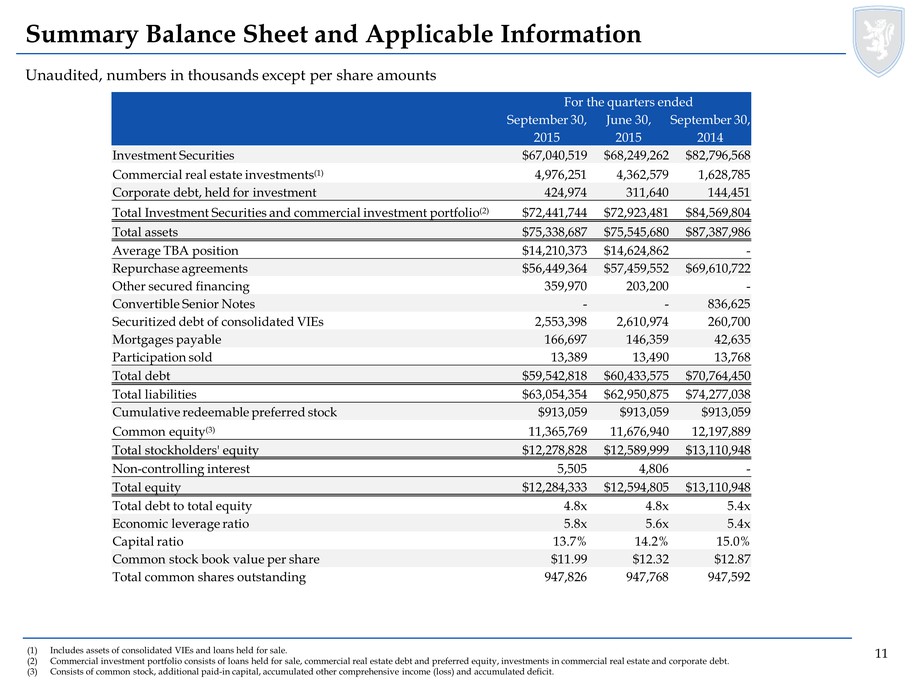
11 11 Summary Balance Sheet and Applicable Information Unaudited, numbers in thousands except per share amounts (1)Includes assets of consolidated VIEs and loans held for sale. (2)Commercial investment portfolio consists of loans held for sale, commercial real estate debt and preferred equity, investments in commercial real estate and corporate debt. (3)Consists of common stock, additional paid-in capital, accumulated other comprehensive income (loss) and accumulated deficit.
12 12 Summary Income Statement and Applicable Information Unaudited, dollars in thousands except per share amounts (1)Includes interest expense on interest rate swaps used to hedge cost of funds. Excludes interest expense on interest rate swaps used to hedge TBA dollar roll.
13 13 Components of Economic Net Interest Income Unaudited, dollars in thousands (1)Included within realized losses on interest rate swaps. Excludes interest expense on interest rate swaps used to hedge TBA dollar roll.
14 14 Change in Normalized Net Interest Margin Unaudited Change from 2Q15 to 3Q15 Note: Graph shows relative changes in contribution from 2Q15 to 3Q15. For example, TBA dollar roll income increased normalized net interest margin by 0.02% more in 3Q15 versus 2Q15. (1)Represents economic interest expense and interest expense on swaps used to hedge dollar roll transactions. 1.62% 1.67% 0.00% 0.25% 0.50% 0.75% 1.00% 1.25% 1.50% 1.75% 2.00% 2.25% 2.50% 2Q15 Normalized net interest margin Coupon on average interest-earning assets TBA dollar roll income Net normalized amortization of premiums Economic interest expense and other swaps expense(1) 3Q15 Normalized net interest margin (0.02%) (0.11%) 0.02% 0.06%

15 15 Change in Normalized Net Interest Spread Unaudited Change from 2Q15 to 3Q15 Note: Graph shows relative changes in contribution from 2Q15 to 3Q15. For example, coupon on average interest-earning assets increased normalized net interest spread by 0.06% more in 3Q15 versus 2Q15. (1)Includes interest expense on interest rate swaps used to hedge cost of funds. 1.21% 1.23% 0.00% 0.25% 0.50% 0.75% 1.00% 1.25% 1.50% 1.75% 2.00% 2Q15 Normalized net interest spread Coupon on average interest earning assets Net normalized amortization of premiums Average cost of interest bearing liabilities(1) 3Q15 Normalized net interest spread 0.06% (0.06%) (0.02%)
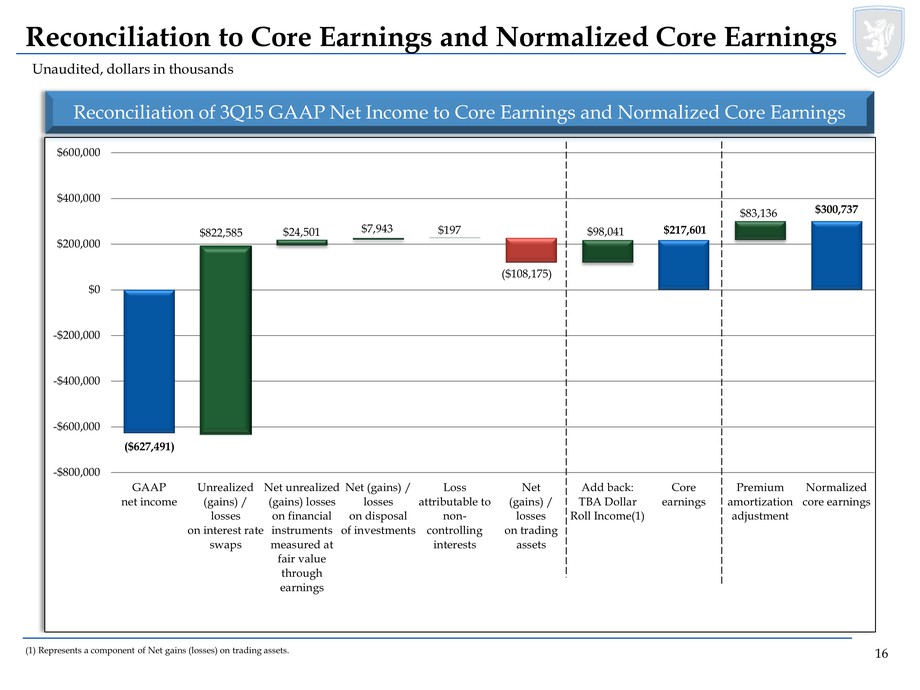
16 16 Reconciliation to Core Earnings and Normalized Core Earnings Unaudited, dollars in thousands Reconciliation of 3Q15 GAAP Net Income to Core Earnings and Normalized Core Earnings (1) Represents a component of Net gains (losses) on trading assets. $217,601 $300,737 ($627,491) -$800,000 -$600,000 -$400,000 -$200,000 $0 $200,000 $400,000 $600,000 GAAP net income Unrealized (gains) / losses on interest rate swaps Net unrealized (gains) losses on financial instruments measured at fair value through earnings Net (gains) / losses on disposal of investments Loss attributable to non- controlling interests Net (gains) / losses on trading assets Add back: TBA Dollar Roll Income(1) Core earnings Premium amortization adjustment Normalized core earnings ($108,175) $197 $822,585 $7,943 $83,136 $24,501 $98,041
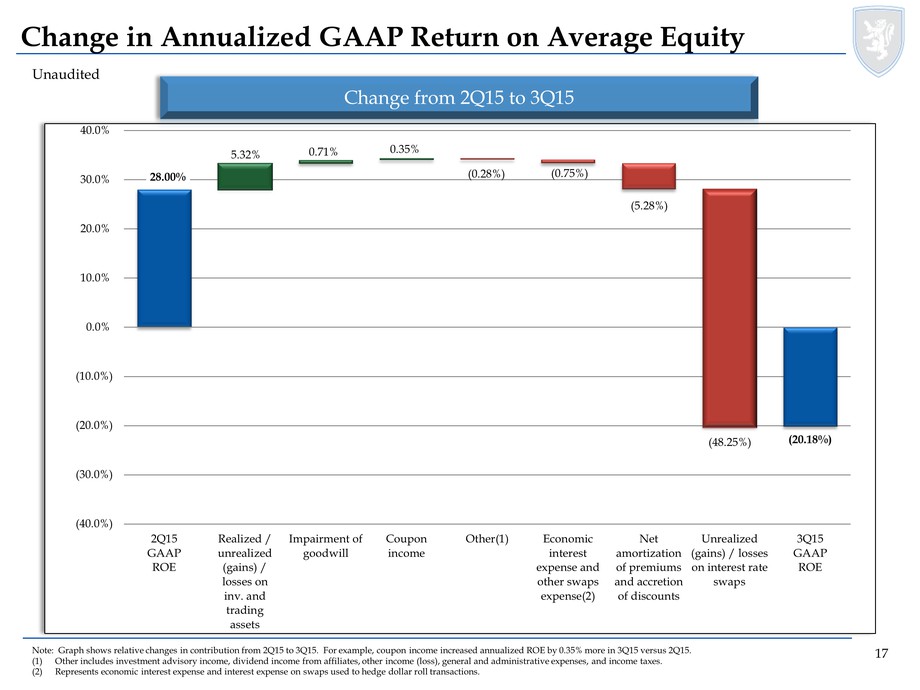
17 17 Change in Annualized GAAP Return on Average Equity Unaudited Change from 2Q15 to 3Q15 Note: Graph shows relative changes in contribution from 2Q15 to 3Q15. For example, coupon income increased annualized ROE by 0.35% more in 3Q15 versus 2Q15. (1)Other includes investment advisory income, dividend income from affiliates, other income (loss), general and administrative expenses, and income taxes. (2)Represents economic interest expense and interest expense on swaps used to hedge dollar roll transactions. (20.18%) 28.00% (40.0%) (30.0%) (20.0%) (10.0%) 0.0% 10.0% 20.0% 30.0% 40.0% 2Q15 GAAP ROE Realized / unrealized (gains) / losses on inv. and trading assets Impairment of goodwill Coupon income Other(1) Economic interest expense and other swaps expense(2) Net amortization of premiums and accretion of discounts Unrealized (gains) / losses on interest rate swaps 3Q15 GAAP ROE (0.75%) (0.28%) 0.35% 0.71% 5.32% 5.32% (48.25%) (5.28%)
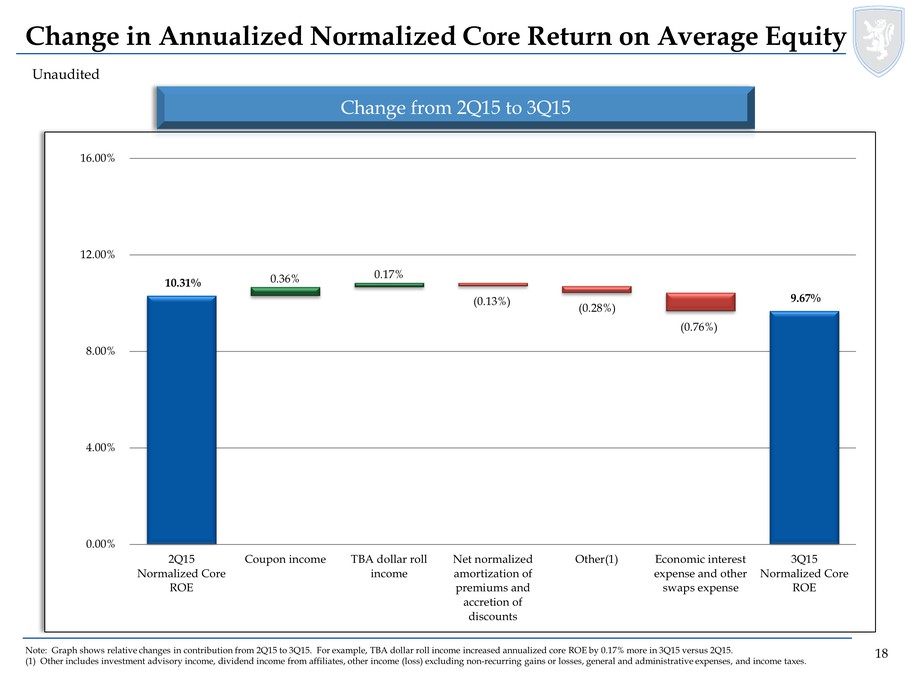
18 18 Change in Annualized Normalized Core Return on Average Equity Unaudited Change from 2Q15 to 3Q15 Note: Graph shows relative changes in contribution from 2Q15 to 3Q15. For example, TBA dollar roll income increased annualized core ROE by 0.17% more in 3Q15 versus 2Q15. (1) Other includes investment advisory income, dividend income from affiliates, other income (loss) excluding non-recurring gains or losses, general and administrative expenses, and income taxes. 9.67% 10.31% 0.00% 4.00% 8.00% 12.00% 16.00% 2Q15 Normalized Core ROE Coupon income TBA dollar roll income Net normalized amortization of premiums and accretion of discounts Other(1) Economic interest expense and other swaps expense 3Q15 Normalized Core ROE 0.17% (0.76%) (0.28%) (0.13%) 0.36%
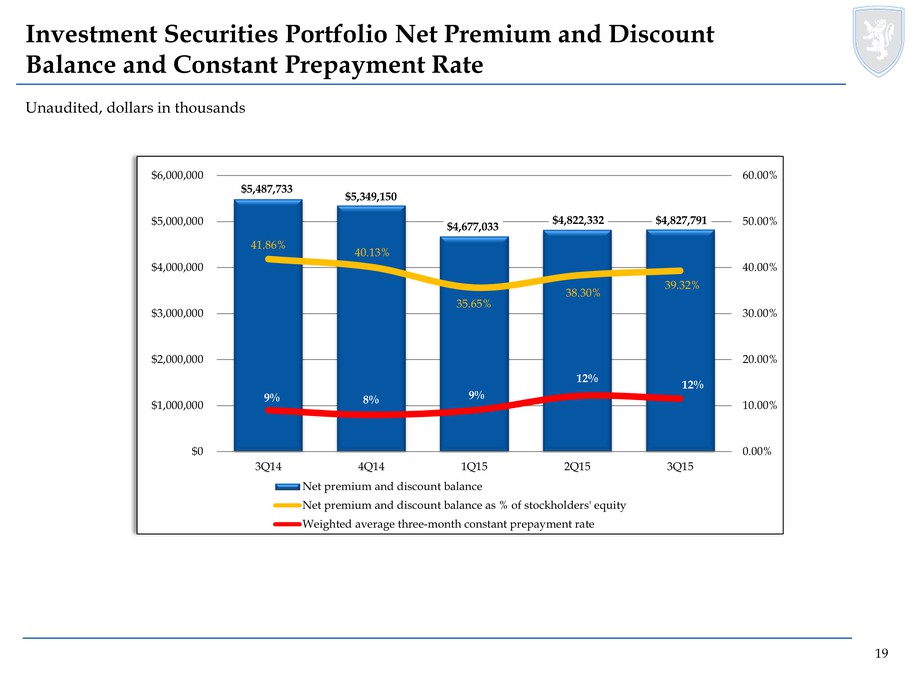
19 19 Investment Securities Portfolio Net Premium and Discount Balance and Constant Prepayment Rate Unaudited, dollars in thousands $5,487,733 $5,349,150 $4,677,033 $4,822,332 $4,827,791 41.86% 40.13% 35.65% 38.30% 39.32% 9% 8% 9% 12% 12% 0.00% 10.00% 20.00% 30.00% 40.00% 50.00% 60.00% $0 $1,000,000 $2,000,000 $3,000,000 $4,000,000 $5,000,000 $6,000,000 3Q14 4Q14 1Q15 2Q15 3Q15 Net premium and discount balance Net premium and discount balance as % of stockholders' equity Weighted average three-month constant prepayment rate
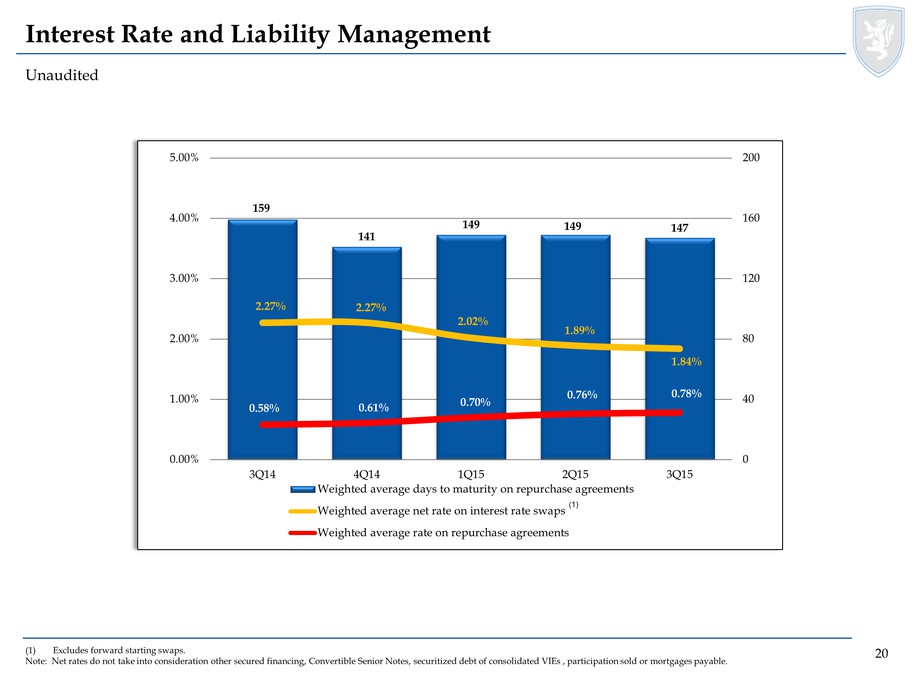
20 20 Interest Rate and Liability Management Unaudited (1) Excludes forward starting swaps. Note: Net rates do not take into consideration other secured financing, Convertible Senior Notes, securitized debt of consolidated VIEs , participation sold or mortgages payable. (1) 159 141 149 149 147 2.27% 2.27% 2.02% 1.89% 1.84% 0.58% 0.61% 0.70% 0.76% 0.78% 0 40 80 120 160 200 0.00% 1.00% 2.00% 3.00% 4.00% 5.00% 3Q14 4Q14 1Q15 2Q15 3Q15 Weighted average days to maturity on repurchase agreements Weighted average net rate on interest rate swaps Weighted average rate on repurchase agreements
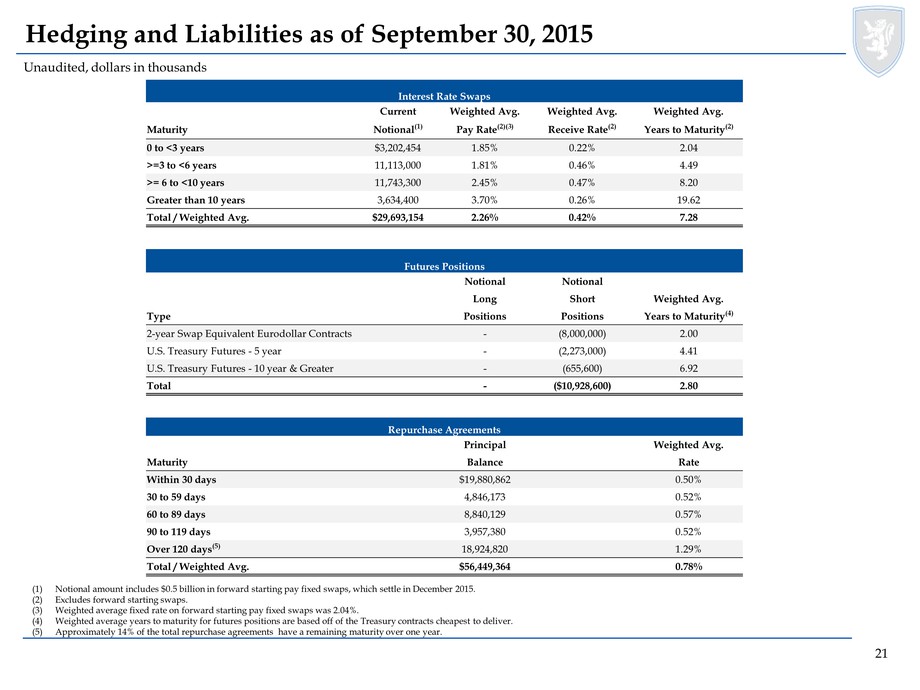
21 21 Hedging and Liabilities as of September 30, 2015 Unaudited, dollars in thousands (1)Notional amount includes $0.5 billion in forward starting pay fixed swaps, which settle in December 2015. (2)Excludes forward starting swaps. (3)Weighted average fixed rate on forward starting pay fixed swaps was 2.04%. (4)Weighted average years to maturity for futures positions are based off of the Treasury contracts cheapest to deliver. (5)Approximately 14% of the total repurchase agreements have a remaining maturity over one year.
22 22 Investment Securities and TBA Derivative Overview as September 30, 2015
23 23 Investment Securities and TBA Derivative Overview as of September 30, 2015 (cont’d) Unaudited, dollars in thousands
24 Quarter-Over-Quarter Interest Rate and MBS Spread Sensitivity Unaudited (1)Scenarios include Investment Securities and derivative instruments. (2)NAV represents book value of common equity. Assumptions: The interest rate sensitivity and spread sensitivity are based on the portfolios as of September 30, 2015 and June 30, 2015 The interest rate sensitivities reflect instantaneous parallel shifts in rates The spread sensitivity shifts MBS spreads instantaneously and reflects exposure to MBS basis risk All tables assume no active management of the portfolio in response to rate or spread changes
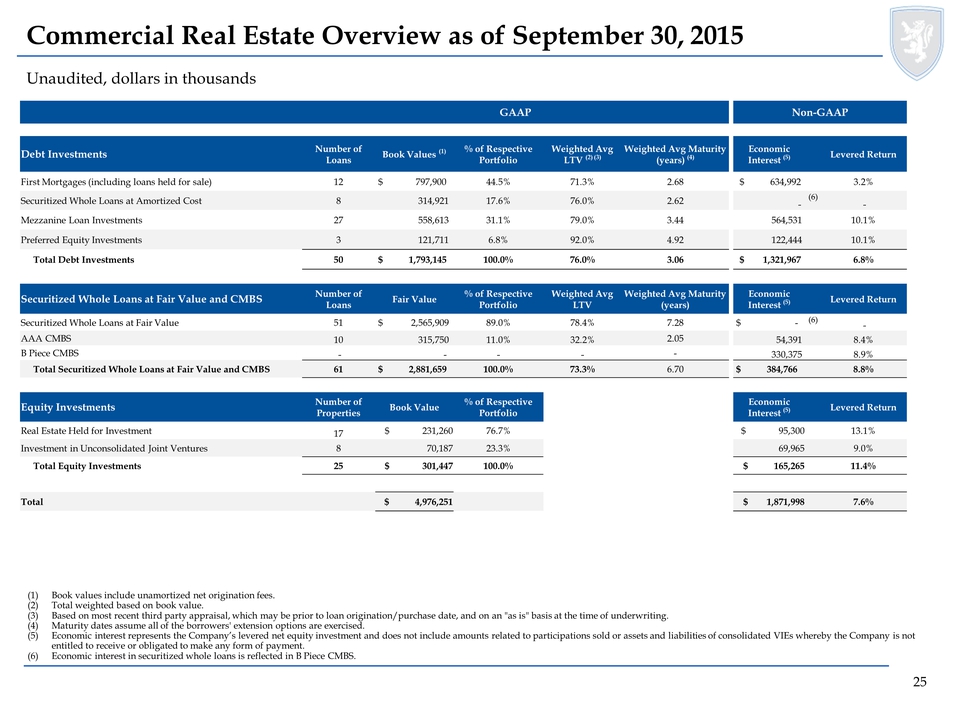
Commercial Real Estate Overview as of September 30, 2015 (1) Book values include unamortized net origination fees. (2) Total weighted based on book value. (3) Based on most recent third party appraisal, which may be prior to loan origination/purchase date, and on an "as is" basis at the time of underwriting. (4) Maturity dates assume all of the borrowers' extension options are exercised. (5) Economic interest represents the Company’s levered net equity investment and does not include amounts related to participations sold or assets and liabilities of consolidated VIEs whereby the Company is not entitled to receive or obligated to make any form of payment. (6) Economic interest in securitized whole loans is reflected in B Piece CMBS. GAAP Non-GAAP Debt Investments Number of Loans Book Values (1) % of Respective Portfolio Weighted Avg LTV (2) (3) Weighted Avg Maturity (years) (4) Economic Interest (5) Levered Return First Mortgages (including loans held for sale) 12 $ 797,900 44.5% 71.3% 2.68 $ 634,992 3.2% Securitized Whole Loans at Amortized Cost 8 314,921 17.6% 76.0% 2.62 - (6) - Mezzanine Loan Investments 27 558,613 31.1% 79.0% 3.44 564,531 10.1% Preferred Equity Investments 3 121,711 6.8% 92.0% 4.92 122,444 10.1% Total Debt Investments 50 $ 1,793,145 100.0% 76.0% 3.06 $ 1,321,967 6.8% Securitized Whole Loans at Fair Value and CMBS Number of Loans Fair Value % of Respective Portfolio Weighted Avg LTV Weighted Avg Maturity (years) Economic Interest (5) Levered Return Securitized Whole Loans at Fair Value 51 $ 2,565,909 89.0% 78.4% 7.28 $ - (6) - AAA CMBS 10 315,750 11.0% 32.2% 2.05 54,391 8.4% B Piece CMBS - - - - - 330,375 8.9% Total Securitized Whole Loans at Fair Value and CMBS 61 $ 2,881,659 100.0% 73.3% 6.70 $ 384,766 8.8% Equity Investments Number of Properties Book Value % of Respective Portfolio Economic Interest (5) Levered Return Real Estate Held for Investment 17 $ 231,260 76.7% $ 95,300 13.1% Investment in Unconsolidated Joint Ventures 8 70,187 23.3% 69,965 9.0% Total Equity Investments 25 $ 301,447 100.0% $ 165,265 11.4% Total $ 4,976,251 $ 1,871,998 7.6% 25
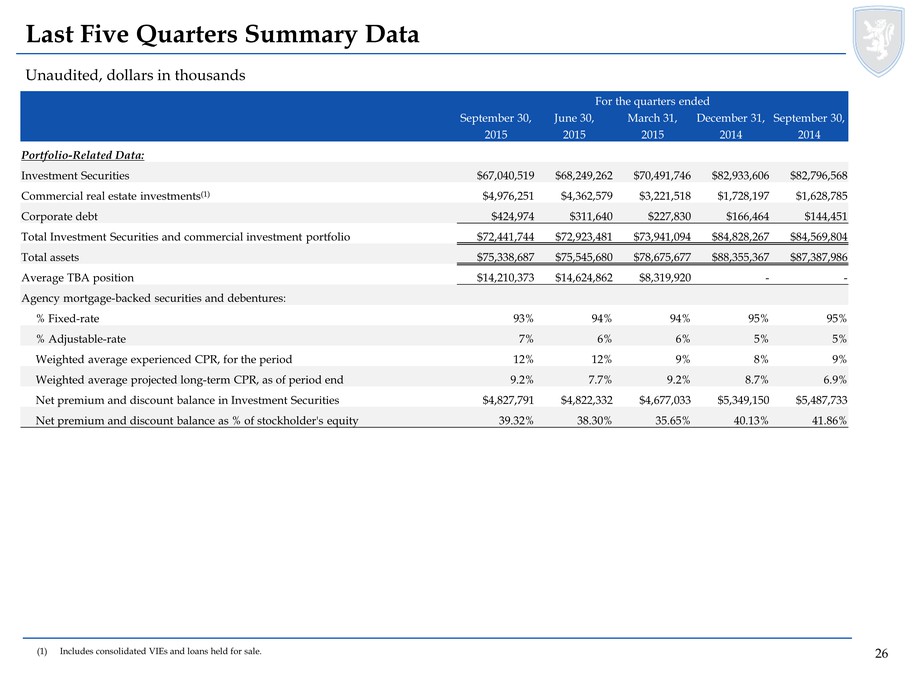
6 26 Last Five Quarters Summary Data Unaudited, dollars in thousands (1)Includes consolidated VIEs and loans held for sale.
2 27 27 Last Five Quarters Summary Data (cont’d) Unaudited, dollars in thousands except per share amounts (1)Measures total notional balances of interest rate swaps, interest rate swaptions and futures relative to repurchase agreements and TBA notional outstanding. (2)Excludes forward starting swaps. (3)Weighted average fixed rate on forward starting pay fixed swaps was 2.04%, 1.77%, 1.88%, 3.25% and 3.24% as of September 30, 2015, June 30, 2015, March 31, 2015, December 31, 2014 and September 30, 2014, respectively.
28 28 Last Five Quarters Summary Data (cont’d)
Annaly Capital Management (NYSE:NLY)
Historical Stock Chart
From Mar 2024 to Apr 2024

Annaly Capital Management (NYSE:NLY)
Historical Stock Chart
From Apr 2023 to Apr 2024
