UNITED STATES
SECURITIES AND EXCHANGE COMMISSION
Washington, D.C. 20549
FORM 8-K
Current Report
Pursuant
to Section 13 or 15(d)
of the Securities Exchange Act of 1934
Date of Report (Date of earliest event reported): February 11, 2016
MOLINA HEALTHCARE, INC.
(Exact name of registrant as specified in its charter)
|
|
|
|
|
| Delaware |
|
1-31719 |
|
13-4204626 |
| (State of incorporation) |
|
(Commission
File Number) |
|
(I.R.S. Employer
Identification Number) |
200 Oceangate, Suite 100, Long Beach, California 90802
(Address of principal executive offices)
Registrant’s telephone number, including area code: (562) 435-3666
Check the appropriate box below if the Form 8-K filing is intended to simultaneously satisfy the filing obligation of the registrant under any of the
following provisions:
| |
¨ |
Written communications pursuant to Rule 425 under the Securities Act (17 CFR 230.425) |
| |
¨ |
Soliciting material pursuant to Rule 14a-12 under the Exchange Act (17 CFR 240.14a-12) |
| |
¨ |
Pre-commencement communications pursuant to Rule 14d-2(b) under the Exchange Act (17 CFR 240.14d-2(b)) |
| |
¨ |
Pre-commencement communications pursuant to Rule 13e-4(c) under the Exchange Act (17 CFR 240.13e-4(c)) |
| Item 7.01. |
Regulation FD Disclosure. |
On February 11, 2016, the Company issued a press release providing its
fiscal year 2016 outlook and guidance. The full text of the press release is attached as Exhibit 99.1 to this report. The information contained in the websites cited in the press release is not part of this report.
In addition, on February 11, 2016, the Company presented and webcast certain slides as part of the Company’s presentation at its Investor
Day Conference held in New York City. A copy of the Company’s complete slide presentation is included as Exhibit 99.2 to this report. An audio and slide replay of the live webcast of the Company’s Investor Day presentation will be
available for 30 days from the date of the presentation at the Company’s website, www.molinahealthcare.com, or at www.earnings.com. The information contained in such websites is not part of this current report.
The information in this Form 8-K current report and the exhibits attached hereto shall not be deemed to be “filed” for purposes of Section 18
of the Securities Exchange Act of 1934 or otherwise subject to the liabilities of that section, nor shall it be deemed incorporated by reference in any filing under the Securities Act of 1933 or the Securities Exchange Act of 1934, except as
expressly set forth by specific reference in such a filing.
| Item 9.01. |
Financial Statements and Exhibits. |
|
|
|
| Exhibit
No. |
|
Description |
|
|
| 99.1 |
|
Press release of Molina Healthcare, Inc. issued February 11, 2016. |
|
|
| 99.2 |
|
Slide presentation given at the Investor Day Conference of Molina Healthcare, Inc. on February 11, 2016. |
SIGNATURE
Pursuant to the requirements of the Securities Exchange Act of 1934, the registrant has duly caused this report to be signed on its behalf by
the undersigned hereunto duly authorized.
|
|
|
|
|
|
|
MOLINA HEALTHCARE, INC. |
|
|
|
| Date: February 11, 2016 |
|
By: |
|
/s/ Jeff D. Barlow |
|
|
|
|
Jeff D. Barlow |
|
|
|
|
Chief Legal Officer and Secretary |
EXHIBIT INDEX
|
|
|
| Exhibit
No. |
|
Description |
|
|
| 99.1 |
|
Press release of Molina Healthcare, Inc. issued February 11, 2016. |
|
|
| 99.2 |
|
Slide presentation given at the Investor Day Conference of Molina Healthcare, Inc. on February 11, 2016. |
Exhibit 99.1

News Release
Contact:
Juan José Orellana
Investor Relations
562-435-3666, ext. 111143
MOLINA HEALTHCARE
PROVIDES FISCAL YEAR 2016
OUTLOOK AND GUIDANCE
LONG BEACH, California (February 11, 2016) – Molina Healthcare, Inc. (NYSE:MOH) today announced that it is providing its outlook and guidance for
fiscal year 2016.
The following table presents the Company’s outlook for fiscal year 2016: (1)
|
|
|
|
|
| Premium Revenue |
|
$ |
15.7B |
|
| Health Insurer Fee Revenue (2) |
|
$ |
335M |
|
| Premium Tax Revenue |
|
$ |
450M |
|
| Service Revenue |
|
$ |
550M |
|
| Investment and Other Income |
|
$ |
40M |
|
|
|
|
|
|
| Total Revenue |
|
$ |
17.0B |
|
|
|
|
|
|
| Total Medical Care Costs |
|
$ |
13.8B |
|
| Medical Care Ratio (3) |
|
|
88.2% |
|
| Total Cost of Service Revenue |
|
$ |
490M |
|
|
|
|
|
|
| General & Administrative Expenses |
|
$ |
1.4B |
|
| G&A Ratio (4) |
|
|
8.0% |
|
| Premium Tax Expense |
|
$ |
450M |
|
| Health Insurer Fee Expense |
|
$ |
220M |
|
| Depreciation & Amortization |
|
$ |
140M |
|
| Interest and Other Expense |
|
$ |
100M |
|
| Income Before Income Taxes |
|
$ |
460M |
|
| EBITDA (5) |
|
$ |
720M |
|
| Effective Tax Rate |
|
|
56% |
|
| After Tax Margin |
|
|
1.2% |
|
| Diluted Shares |
|
|
58M |
|
| Diluted EPS |
|
$ |
3.50 |
|
| Adjusted net income per share
(5) |
|
$ |
3.86 |
|
| (1) |
All amounts are estimates; actual results may differ materially. See our risk factors as discussed in our Form 10-K and other filings. |
| (2) |
Outlook assumes full reimbursement of the Health Insurer Fee and related tax effects in 2016. |
| (3) |
Medical Care Ratio represents Medical Care Costs as a percentage of Premium Revenue. |
| (4) |
G&A Ratio computed as a percentage of Total Revenue. |
| (5) |
See reconciliation of non-GAAP financial measure on next page. |
-MORE-
MOH Provides Fiscal Year 2016 Outlook and Guidance
Page 2
February 11, 2016
The Company uses two non-GAAP financial measures as supplemental metrics in evaluating its financial performance, making financing and business decisions, and
forecasting and planning for future periods. For these reasons, management believes such measures are useful supplemental measures to investors in comparing the Company’s performance to the performance of other public companies in the health
care industry. These non-GAAP financial measures should be considered as supplements to, and not as substitutes for or superior to, GAAP measures.
The
first of these non-GAAP measures is earnings before interest, taxes, depreciation and amortization (EBITDA). The following table reconciles net income, which the Company believes to be the most comparable GAAP measure, to EBITDA:(1)
|
|
|
|
|
| |
|
2016
Outlook |
|
| Net income |
|
$ |
202M |
|
| Adjustments: |
|
|
|
|
| Depreciation, and amortization of intangible assets and capitalized software |
|
$ |
161M |
|
| Interest expense |
|
$ |
100M |
|
| Income tax expense |
|
$ |
257M |
|
|
|
|
|
|
| EBITDA |
|
$ |
720M |
|
|
|
|
|
|
The second of these non-GAAP measures is adjusted net income (including adjusted net income per diluted share). The Company
believes that this non-GAAP financial measure helps investors better understand the impact that acquisitions have on our earnings, exclusive of non-cash charges. Effective as of January 1, 2016, the Company will no longer exclude amortization of
convertible notes and lease financing obligations from its presentation of adjusted net income (and adjusted net income per share). The Company made this change because various capital transactions that it completed in 2015 reduced the
Company’s relative reliance on convertible notes and lease financing as sources of capital. The Company believes that this change will enhance the comparability of this non-GAAP measure with the corresponding non-GAAP measure used by the
Company’s competitors. The following table reconciles net income, which the Company believes to be the most comparable GAAP measure, to adjusted net income:(1) (2)
|
|
|
|
|
|
|
|
|
| |
|
2016 Outlook |
|
| |
|
Dollars |
|
|
Per Share |
|
| Net income |
|
$ |
202M |
|
|
$ |
3.50 |
|
| Adjustments, net of tax: |
|
|
|
|
|
|
|
|
| Amortization of intangible assets |
|
|
21M |
|
|
|
0.36 |
|
|
|
|
|
|
|
|
|
|
| Adjusted net income |
|
$ |
223M |
|
|
$ |
3.86 |
|
|
|
|
|
|
|
|
|
|
| (1) |
All amounts are estimates and subject to change. |
| (2) |
Computation assumes 58 million diluted weighted average shares outstanding. |
2016 Business Outlook and
Investor Meeting
As has been the Company’s past practice, it will discuss its 2016 business outlook and strategy at its Investor Day Conference
webcast and presentation to be held on February 11, 2016, at the Le Parker Meridien Hotel in New York City from 12:30 p.m. to 4:30 p.m. Eastern Time. The Company will webcast the presentations offered by its management team, which will be
followed by question-and-answer sessions. A 30-day online replay of the Investor Day meeting will be available approximately one hour following the conclusion of the live webcast. A link to this webcast can be found on the Company’s website at
molinahealthcare.com.
-MORE-
MOH Provides Fiscal Year 2016 Outlook and Guidance
Page 3
February 11, 2016
About Molina Healthcare
Molina Healthcare, Inc., a
FORTUNE 500 company, provides managed health care services under the Medicaid and Medicare programs and through the state insurance marketplaces. Through our locally operated health plans in 11 states across the nation and in the Commonwealth of
Puerto Rico, Molina currently serves approximately 3.5 million members. Dr. C. David Molina founded our company in 1980 as a provider organization serving low-income families in Southern California. Today, we continue his mission of
providing high quality and cost-effective health care to those who need it most. For more information about Molina Healthcare, please visit our website at molinahealthcare.com.
Safe Harbor Statement under the Private Securities Litigation Reform Act of 1995: This earnings release contains “forward-looking
statements” regarding the Company’s outlook and financial guidance for fiscal year 2016. Actual results could differ materially from the 2016 financial guidance due to numerous known and unknown risks and uncertainties. Those known risks
and uncertainties include, but are not limited, to the following:
| • |
|
uncertainties and evolving market and provider economics associated with the implementation of the Affordable Care Act, the Medicaid expansion, the insurance marketplaces, the effect of various implementing
regulations, and uncertainties regarding the Medicare-Medicaid dual eligible demonstration programs in California, Illinois, Michigan, Ohio, South Carolina, and Texas; |
| • |
|
management of our medical costs, including seasonal flu patterns and rates of utilization that are consistent with our expectations, and our ability to reduce over time the high medical costs commonly associated with
new patient populations; |
| • |
|
federal or state medical cost expenditure floors, administrative cost and profit ceilings, premium stabilization programs, profit sharing arrangements, and conflicting interpretations thereof; |
| • |
|
the interpretation and implementation of at-risk premium rules regarding the achievement of certain quality measures; |
| • |
|
cyber-attacks or other privacy or data security incidents resulting in an inadvertent unauthorized disclosure of protected health information; |
| • |
|
the success of our new health plan in Puerto Rico, including the successful resolution of the Puerto Rico debt crisis and the payment of all amounts due under our Medicaid contract; |
| • |
|
specialty drugs or generic drugs that are exorbitantly priced but not factored into the calculation of our capitated rates; |
| • |
|
significant budget pressures on state governments and their potential inability to maintain current rates, to implement the rate increases we expect and project for 2016, or to maintain existing benefit packages or
membership eligibility thresholds or criteria, including the resolution of the Illinois budget impasse and continued payment of our Illinois health plan; |
| • |
|
the accurate estimation of incurred but not reported or paid medical costs across our health plans; |
| • |
|
retroactive adjustments to premium revenue or accounting estimates which require adjustment based upon subsequent developments; |
| • |
|
efforts by states to recoup previously paid amounts; |
| • |
|
the success of our efforts to retain existing government contracts and to obtain new government contracts in connection with state requests for proposals (RFPs) in both existing and new states; |
| • |
|
the continuation and renewal of the government contracts of both our health plans and Molina Medicaid Solutions and the terms under which such contracts are renewed; |
| • |
|
complications, member confusion, or enrollment backlogs related to the annual renewal of Medicaid coverage; |
| • |
|
government audits and reviews, and any fine, enrollment freeze, or monitoring program that may result therefrom; |
| • |
|
changes with respect to our provider contracts and the loss of providers; |
| • |
|
approval by state regulators of dividends and distributions by our health plan subsidiaries; |
| • |
|
changes in funding under our contracts as a result of regulatory changes, programmatic adjustments, or other reforms; |
| • |
|
high dollar claims related to catastrophic illness; |
| • |
|
the favorable resolution of litigation, arbitration, or administrative proceedings; |
| • |
|
the relatively small number of states in which we operate health plans; |
| • |
|
the effect on our Los Angeles County subcontract of Centene’s acquisition of Health Net; |
| • |
|
the availability of adequate financing on acceptable terms to fund and capitalize our expansion and growth, repay our outstanding indebtedness at maturity and meet our liquidity needs, including the interest expense
and other costs associated with such financing; |
| • |
|
the failure of a state in which we operate to renew its federal Medicaid waiver; |
| • |
|
changes generally affecting the managed care or Medicaid management information systems industries; |
| • |
|
increases in government surcharges, taxes, and assessments; |
| • |
|
newly emergent viruses or widespread epidemics, including the Zika virus, and associated public alarm; |
| • |
|
changes in general economic conditions, including unemployment rates; |
| • |
|
the sufficiency of our funds, on hand to pay the amounts due upon conversion of our outstanding notes; |
| • |
|
increasing competition and consolidation in the Medicaid industry; |
and numerous other risks,
including those discussed under Item 1A in the Company’s annual report on Form 10-K, as well as the risk factors and cautionary statements in the Company’s other periodic reports and filings with the Securities and Exchange
Commission. These reports can be accessed under the investor relations tab of the Company’s website or on the SEC’s website at sec.gov. Given these risks and uncertainties, we can give no assurances that the
Company’s 2016 projections or other forward-looking statements will prove to be accurate, or that any other results or events projected or contemplated by the Company’s forward-looking statements will in fact occur, and we caution
investors not to place undue reliance on these statements. All forward-looking statements in this release represent the Company’s judgment as of February 11, 2016, and we disclaim any obligation to update any forward-looking statements to
conform the statement to actual results or changes in the Company’s expectations.
-END-
Exhibit 99.2

2016A Investor Day February 11, 2016 / New York, New York
Cautionary
Statement Safe Harbor Statement under the Private Securities Litigation Reform Act of 1995: This slide presentation and our accompanying oral remarks contain numerous “forward-looking statements” regarding, without limitation: our
financial outlook and business expectations for 2016; expected rate changes in 2016; the integration of, and the achievement of expected revenues from our acquisitions; growth in our marketplace membership, including provider economics and risk
adjustment estimates associated with the marketplaces; care integration and care management; expected RFP opportunities and the success of our responses; our growth and acquisition strategy; and various other matters. All of our forward-looking
statements are subject to numerous risks, uncertainties, and other factors that could cause our actual results to differ materially from those projected in each forward-looking statement. Anyone viewing or listening to this presentation is urged to
read the risk factors and cautionary statements found under Item 1A in our annual report on Form 10-K, as well as the risk factors and cautionary statements in our quarterly reports on Form 10-Q, in our current reports on Form 8-K, and in our other
filings with the Securities and Exchange Commission and available for viewing on our website at sec.gov. Except to the extent required by federal securities laws, we do not undertake to address or update forward-looking statements in future filings
or communications regarding our business or operating results. 2 2016 MOLINA HEALTHCARE, INC.
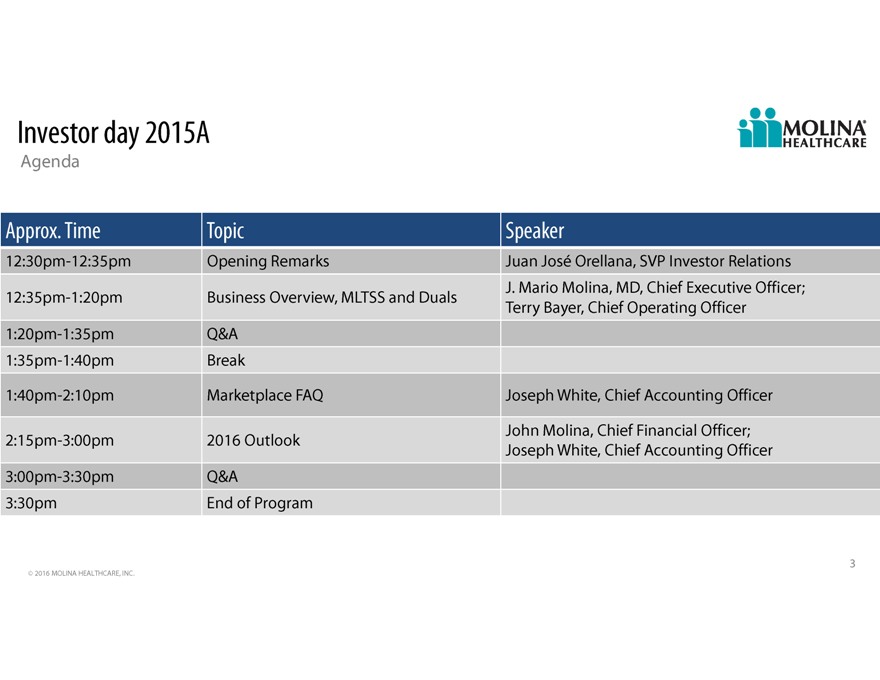
Investor
day 2015A Agenda Approx. Time Topic Speaker 12:30pm-12:35pm Opening Remarks Juan Jos Orellana, SVP Investor Relations J. Mario Molina, MD, Chief Executive Officer; 12:35pm-1:20pm Business Overview, MLTSS and Duals Terry Bayer, Chief Operating
Officer 1:20pm-1:35pm Q&A 1:35pm-1:40pm Break 1:40pm-2:10pm Marketplace FAQ Joseph White, Chief Accounting Officer John Molina, Chief Financial Officer; 2:15pm-3:00pm 2016 Outlook Joseph White, Chief Accounting Officer 3:00pm-3:30pm Q&A
3:30pm End of Program 3 2016 MOLINA HEALTHCARE, INC.

2016A
Investor Day Business Overview J. Mario Molina, M.D., President & Chief Executive Officer February 11, 2016 / New York, New York

Our
mission To provide quality health care to people receiving government assistance 5 2016 MOLINA HEALTHCARE, INC.
Our values
We strive to be an exemplary organization. These are our values: Caring Thrifty Enthusiastic Respectful Focused Value Feedback Accountable We sustain our mission by being profitable. We are one Molina. 6 2016 MOLINA HEALTHCARE, INC.
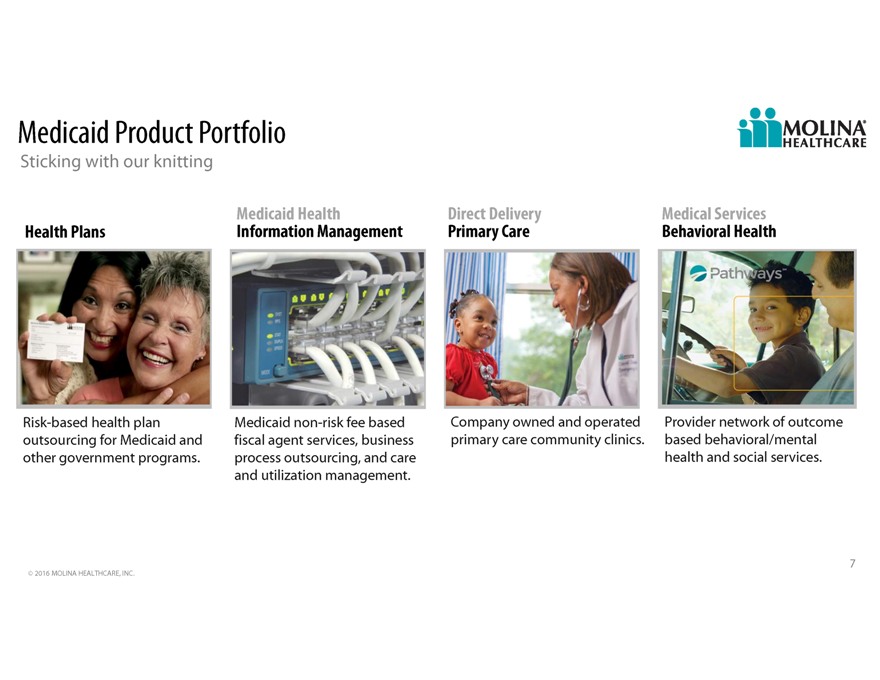
Medicaid
Product Portfolio Sticking with our knitting Medicaid Health Direct Delivery Medical Services Health Plans Information Management Primary Care Behavioral Health Risk-based health plan Medicaid non-risk fee based Company owned and operated Provider
network of outcome outsourcing for Medicaid and fiscal agent services, business primary care community clinics. based behavioral/mental other government programs. process outsourcing, and care health and social services. and utilization management.
7 2016 MOLINA HEALTHCARE, INC.
Our
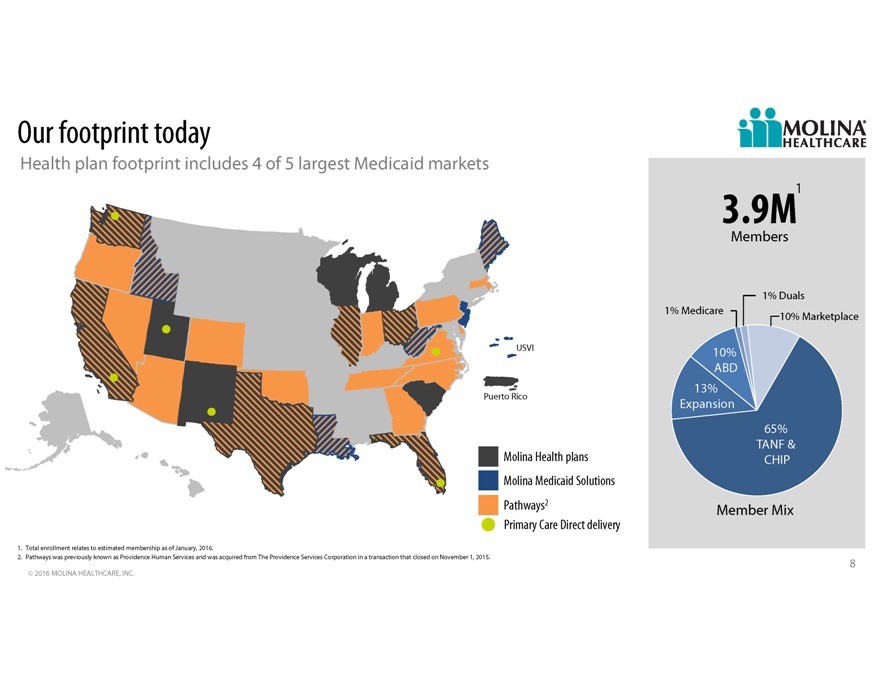
footprint today Health plan footprint includes 4 of 5 largest Medicaid markets 3.9M1 Members 1% Duals 1% Medicare 10% Marketplace USVI 10% ABD 13% Puerto Rico Expansion 65% TANF & Molina Health plans CHIP Molina Medicaid Solutions Pathways2
Member Mix Primary Care Direct delivery 1. Total enrollment relates to estimated membership as of January, 2016. 2. Pathways was previously known as Providence Human Services and was acquired from The Providence Services Corporation in a transaction
that closed on November 1, 2015. 8 2016 MOLINA HEALTHCARE, INC.
2015 was a
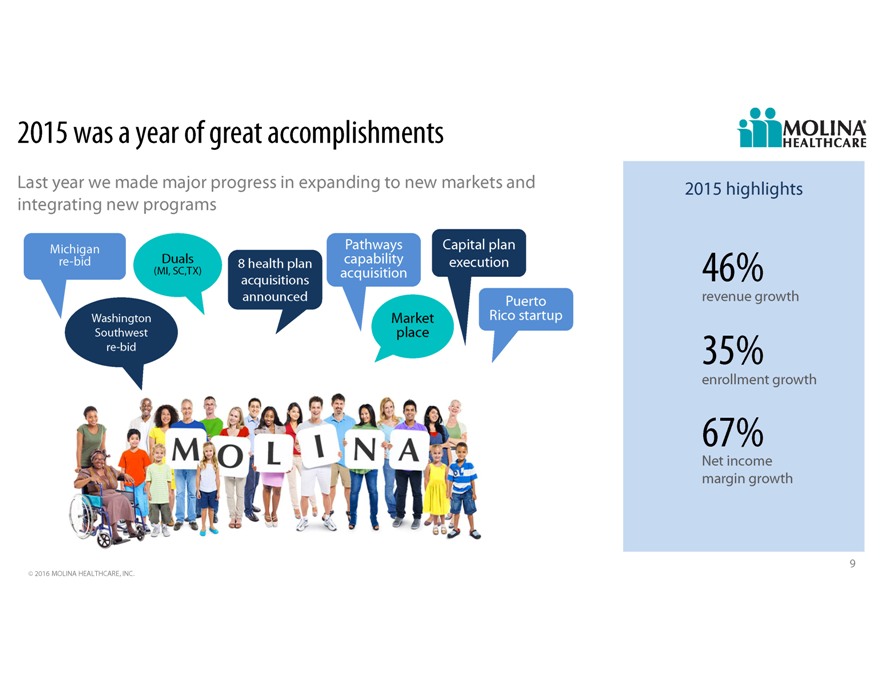
year of great accomplishments Last year we made major progress in expanding to new markets and 2015 highlights integrating new programs Michigan Pathways Capital plan re-bid Duals 8 health plan capability execution (MI, SC,TX) acquisition 46%
acquisitions announced Puerto revenue growth Washington Market Rico startup Southwest place re-bid 35% enrollment growth 67% Net income margin growth 9 2016 MOLINA HEALTHCARE, INC.
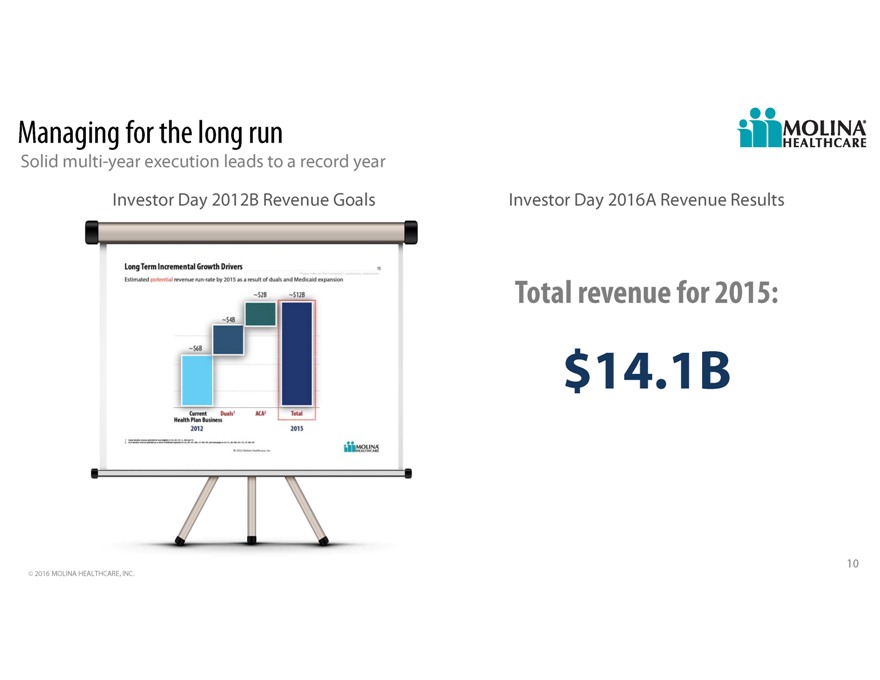
Managing
for the long run Solid multi-year execution leads to a record year Investor Day 2012B Revenue Goals Investor Day 2016A Revenue Results Total revenue for 2015: $14.1B 10 2016 MOLINA HEALTHCARE, INC.
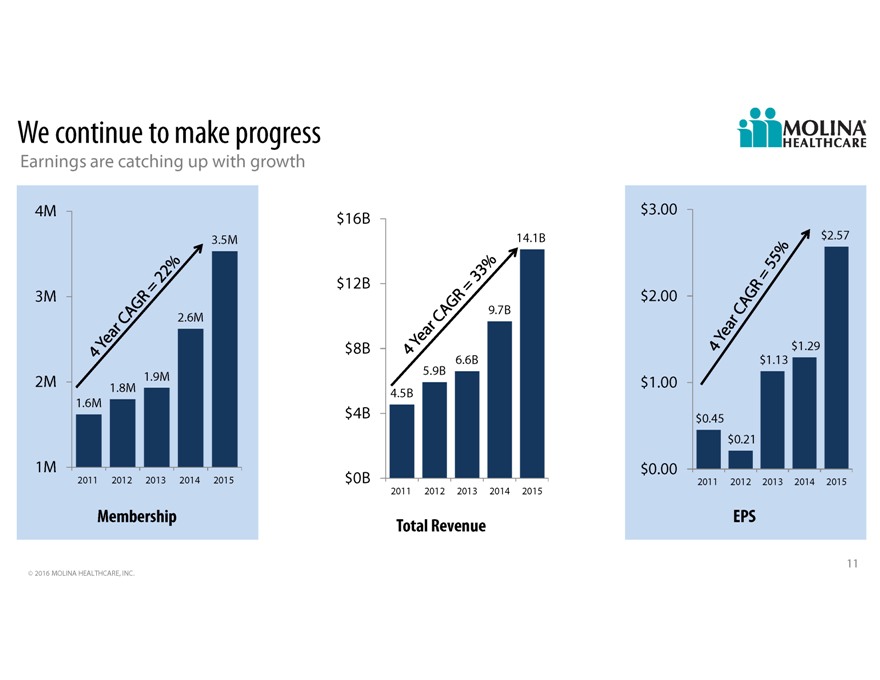
We
continue to make progress Earnings are catching up with growth 4M $ 3.00 $16B 3.5M 14.1B $2.57 $12B 3M $ 2.00 9.7B 2.6M $8B $1.29 6.6B $1.13 1.9M 5.9B 2M 1.8M $ 1.00 4.5B 1.6M $4B $ 0.45 $0.21 1M $ 0.00 2011 2012 2013 2014 2015 $0B 2011 2012 2013
2014 2015 2011 2012 2013 2014 2015 Membership EPS Total Revenue 11 2016 MOLINA HEALTHCARE, INC.
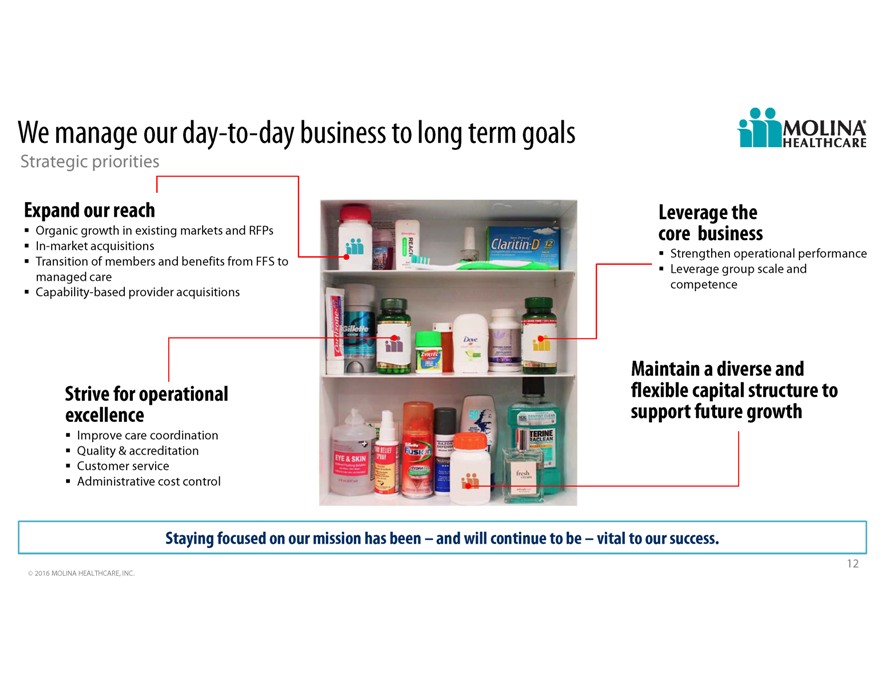
We manage
our day-to-day business to long term goals Strategic priorities Expand our reach Leverage the Organic growth in existing markets and RFPs core business In-market acquisitions Strengthen operational performance Transition of members and benefits from
FFS to Leverage group scale and managed care Capability-based provider acquisitions competence Maintain a diverse and Strive for operational flexible capital structure to excellence support future growth Improve care coordination Quality &
accreditation Customer service Administrative cost control Staying focused on our mission has been and will continue to be vital to our success. 12 2016 MOLINA HEALTHCARE, INC.
Our
strategy positions us well to respond to major trends 1. Long Term Care Services are a managed care opportunity 2. States continue to expand Medicaid 3. Home and Community Based Service (HCBS) costs continue to increase 4. Integration of medical and
behavioral health 5. Social determinants of health 13 2016 MOLINA HEALTHCARE, INC.
How will
we continue to grow Organic growth in existing markets and RFPs In-market acquisitions Marketplace Transition of members and benefits from FFS to managed care Capability-based provider acquisitions 14 2016 MOLINA HEALTHCARE, INC.
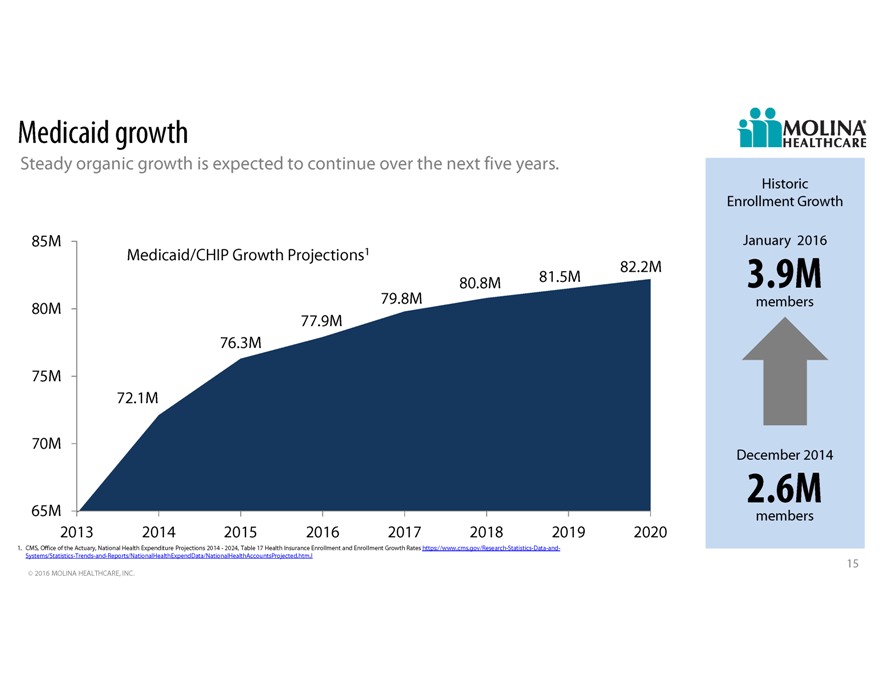
Medicaid
growth Steady organic growth is expected to continue over the next five years. Historic Enrollment Growth 136k 85M January 2016 Medicaid/CHIP Growth Projections1 82.2M 80.8M 81.5M 3.9M 80M 53k 79.8M members 77.9M 66k 76.3M 21k 135k 75M 72.1M 64k 70M
December 2014 2.6M 65M members 2013 2014 2015 2016 2017 2018 2019 2020 1. CMS, Office of the Actuary, National Health Expenditure Projections 2014 - 2024, Table 17 Health Insurance Enrollment and Enrollment Growth Rates
https://www.cms.gov/Research-Statistics-Data-and- Systems/Statistics-Trends-and-Reports/NationalHealthExpendData/NationalHealthAccountsProjected.htm.l 15 2016 MOLINA HEALTHCARE, INC.
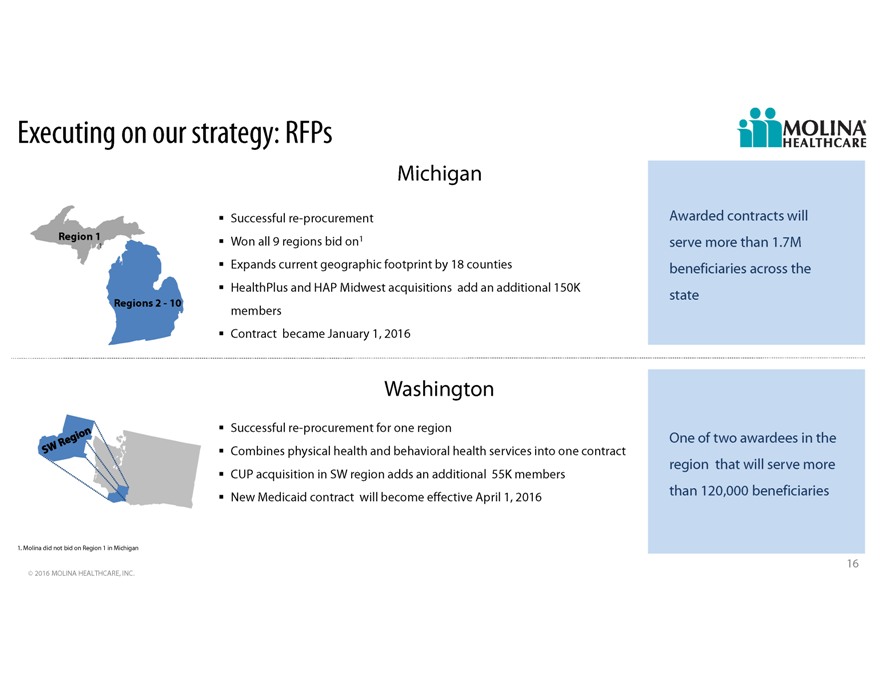
Executing
on our strategy: RFPs Michigan Successful re-procurement Awarded contracts will Region 1 1 Won all 9 regions bid on1 serve more than 1.7M Expands current geographic footprint by 18 counties beneficiaries across the HealthPlus and HAP Midwest
acquisitions add an additional 150K state Regions 2 - 10 members Contract became January 1, 2016 Washington Successful re-procurement for one region One of two awardees in the Combines physical health and behavioral health services into one contract
region that will serve more CUP acquisition in SW region adds an additional 55K members New Medicaid contract will become effective April 1, 2016 than 120,000 beneficiaries 1. Molina did not bid on Region 1 in Michigan 16 2016 MOLINA HEALTHCARE,
INC.
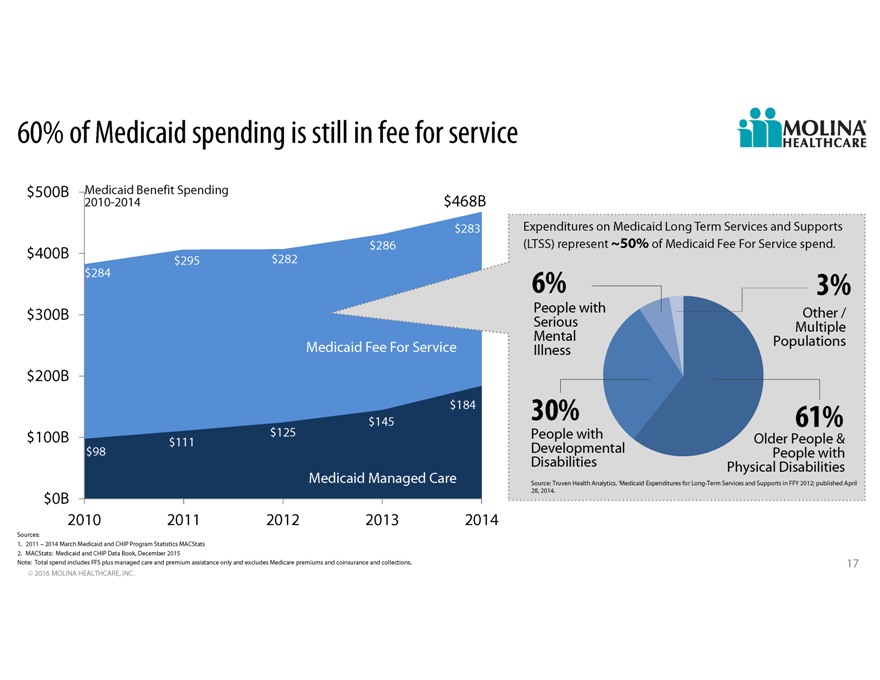
60% of
Medicaid spending is still in fee for service $500B Medicaid Benefit Spending 2010-2014 $468B $283 Expenditures on Medicaid Long Term Services and Supports $286(LTSS) represent 50% of Medicaid Fee For Service spend. $400B $295 $282 $284 6% 3% $300B
People with Other / Serious Multiple Mental Populations Medicaid Fee For Service Illness $200B $184 $145 30% 61% $100B $125 People with Older People & $111 Developmental $98 People with Disabilities Physical Disabilities Medicaid Managed Care
Source: Truven Health Analytics. Medicaid Expenditures for Long-Term Services and Supports in FFY 2012; published April 28, 2014. $0B 2010 2011 2012 2013 2014 Sources: 1. 2011 2014 March Medicaid and CHIP Program Statistics MACStats 2. MACStats:
Medicaid and CHIP Data Book, December 2015 Note: Total spend includes FFS plus managed care and premium assistance only and excludes Medicare premiums and coinsurance and collections. 17 2016 MOLINA HEALTHCARE, INC.
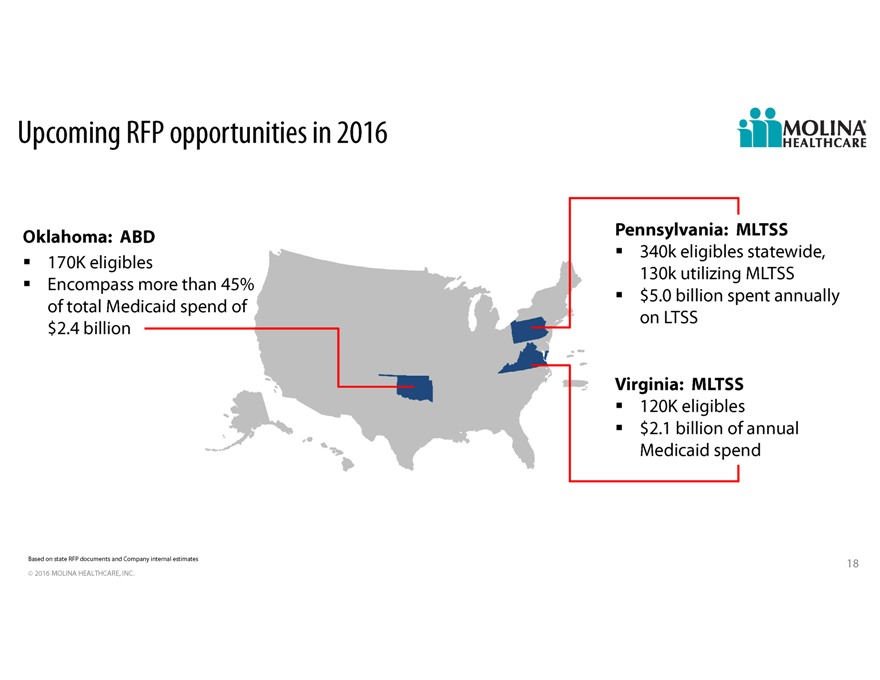
Upcoming
RFP opportunities in 2016 Oklahoma: ABD Pennsylvania: MLTSS 170K eligibles 340k eligibles statewide, Encompass more than 45% 130k utilizing MLTSS $5.0 billion spent annually of total Medicaid spend of on LTSS $2.4 billion Virginia: MLTSS 120K
eligibles $2.1 billion of annual Medicaid spend Based on state RFP documents and Company internal estimates 18 2016 MOLINA HEALTHCARE, INC.
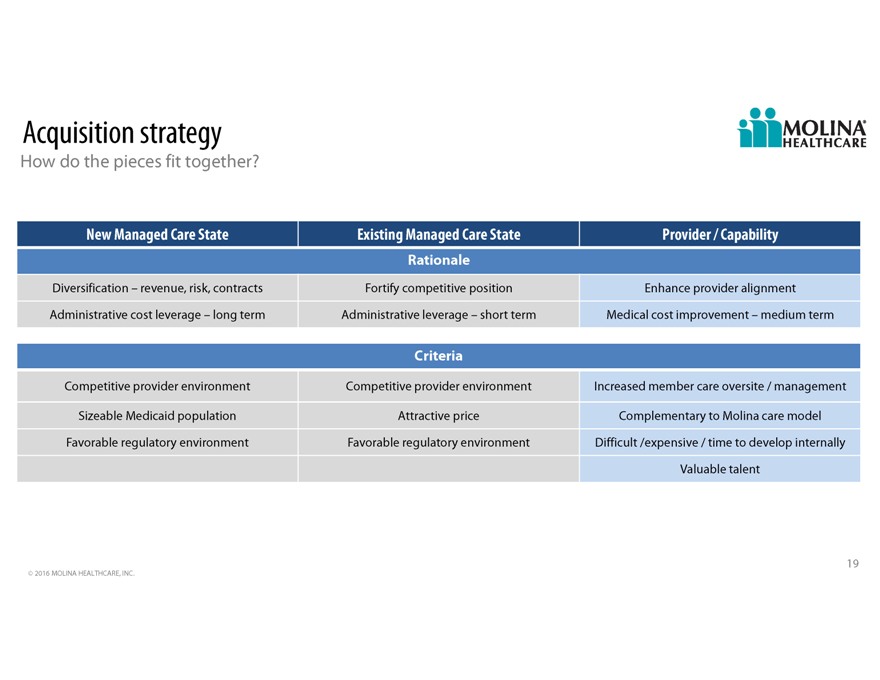
Acquisition strategy How do the pieces fit together New Managed Care State Existing Managed Care State Provider /
Capability Rationale Diversification revenue, risk, contracts Fortify competitive position Enhance provider alignment Administrative cost leverage long term Administrative leverage short term Medical cost improvement medium term Criteria Competitive
provider environment Competitive provider environment Increased member care oversite / management Sizeable Medicaid population Attractive price Complementary to Molina care model Favorable regulatory environment Favorable regulatory environment
Difficult /expensive / time to develop internally Valuable talent 19 2016 MOLINA HEALTHCARE, INC.
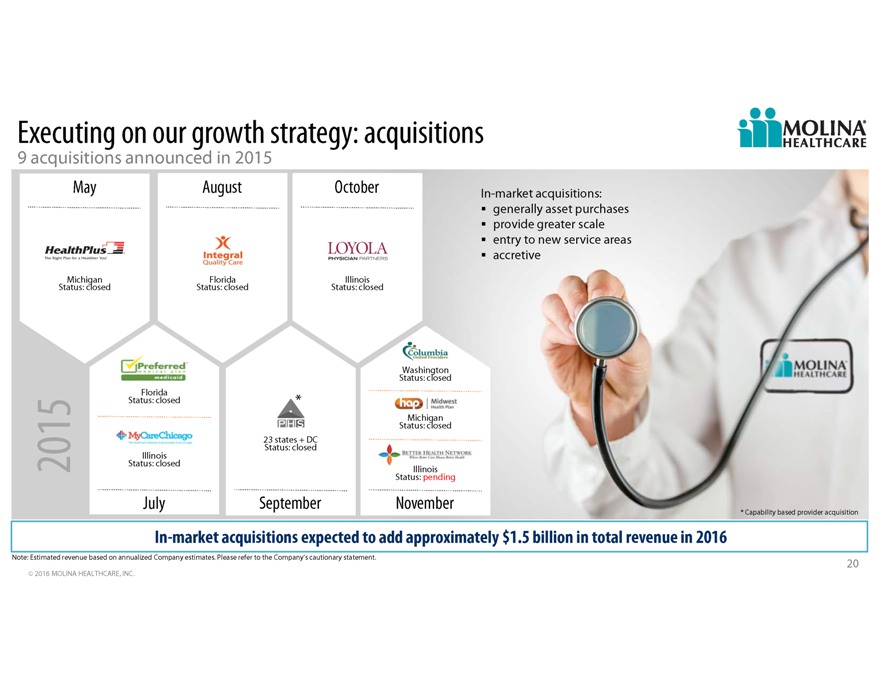
Executing
on our growth strategy: acquisitions 9 acquisitions announced in 2015 May August October In-market acquisitions: generally asset purchases provide greater scale entry to new service areas accretive Michigan Florida Illinois Status: closed Status:
closed Status: closed Washington Status: closed Florida Status: closed* Michigan Status: closed 23 states + DC Status: closed Illinois Status: closed 2015 Illinois Status: pending July September November * Capability based provider acquisition
In-market acquisitions expected to add approximately $1.5 billion in total revenue in 2016 Note: Estimated revenue based on annualized Company estimates. Please refer to the Companys cautionary statement. 20 2016 MOLINA HEALTHCARE, INC.
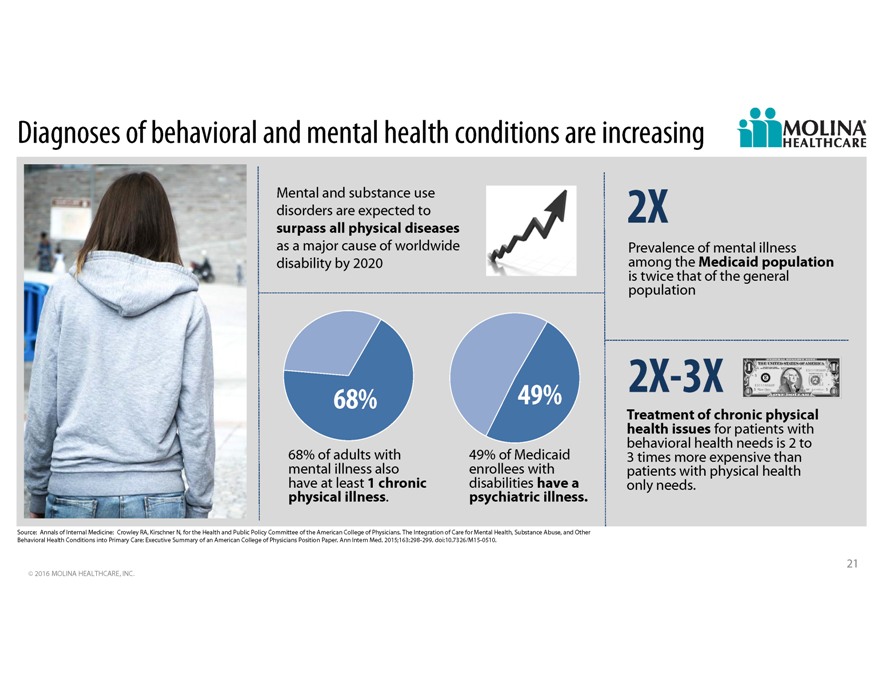
Diagnoses
of behavioral and mental health conditions are increasing Mental and substance use disorders are expected to 2X surpass all physical diseases as a major cause of worldwide Prevalence of mental illness disability by 2020 among the Medicaid population
is twice that of the general population 68% 49% 2X-3X Treatment of chronic physical health issues for patients with behavioral health needs is 2 to 68% of adults with 49% of Medicaid 3 times more expensive than mental illness also enrollees with
patients with physical health have at least 1 chronic disabilities have a only needs. physical illness. psychiatric illness. Source: Annals of Internal Medicine: Crowley RA, Kirschner N, for the Health and Public Policy Committee of the American
College of Physicians. The Integration of Care for Mental Health, Substance Abuse, and Other Behavioral Health Conditions into Primary Care: Executive Summary of an American College of Physicians Position Paper. Ann Intern Med. 2015;163:298-299.
doi:10.7326/M15-0510. 21 2016 MOLINA HEALTHCARE, INC.
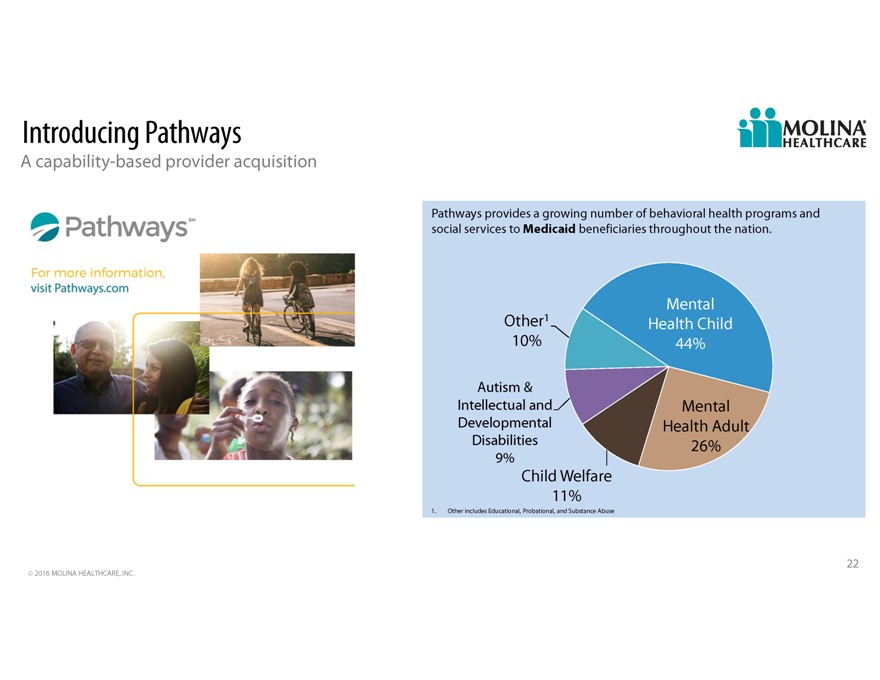
Introducing Pathways A capability-based provider acquisition Pathways provides a growing number of behavioral health
programs and social services to Medicaid beneficiaries throughout the nation. Mental Other1 Health Child 10% 44% Autism & Intellectual and Mental Developmental Health Adult Disabilities 26% 9% Child Welfare 11% 1. Other includes Educational,
Probational, and Substance Abuse 22 2016 MOLINA HEALTHCARE, INC.
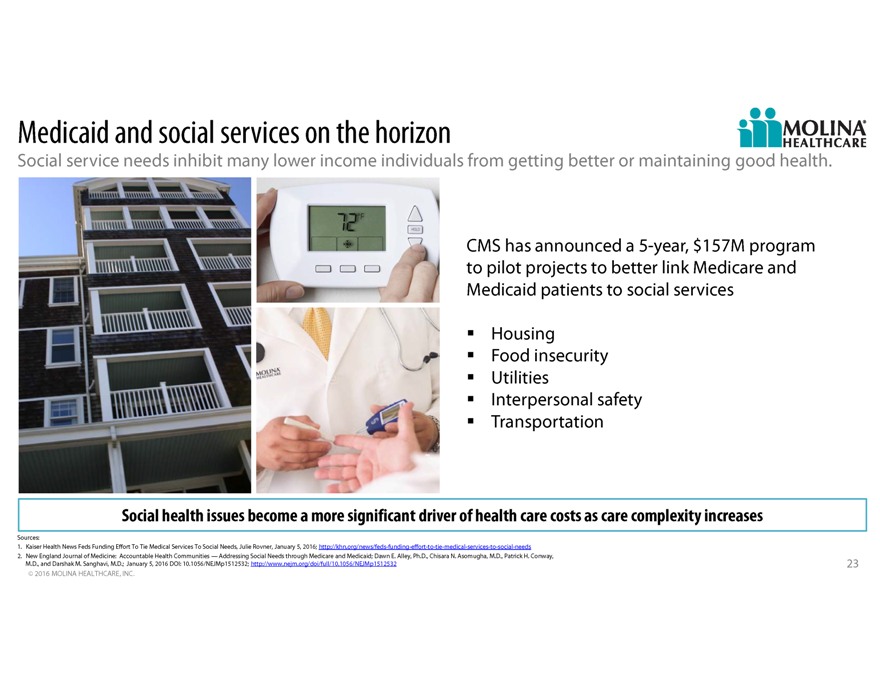
Medicaid
and social services on the horizon Social service needs inhibit many lower income individuals from getting better or maintaining good health. CMS has announced a 5-year, $157M program to pilot projects to better link Medicare and Medicaid patients
to social services Housing Food insecurity Utilities Interpersonal safety Transportation Social health issues become a more significant driver of health care costs as care complexity increases Sources: 1. Kaiser Health News Feds Funding Effort To
Tie Medical Services To Social Needs, Julie Rovner, January 5, 2016; http://khn.org/news/feds-funding-effort-to-tie-medical-services-to-social-needs 2. New England Journal of Medicine: Accountable Health Communities Addressing Social Needs through
Medicare and Medicaid; Dawn E. Alley, Ph.D., Chisara N. Asomugha, M.D., Patrick H. Conway, M.D., and Darshak M. Sanghavi, M.D.; January 5, 2016 DOI: 10.1056/NEJMp1512532; http://www.nejm.org/doi/full/10.1056/NEJMp1512532 23 2016 MOLINA HEALTHCARE,
INC.
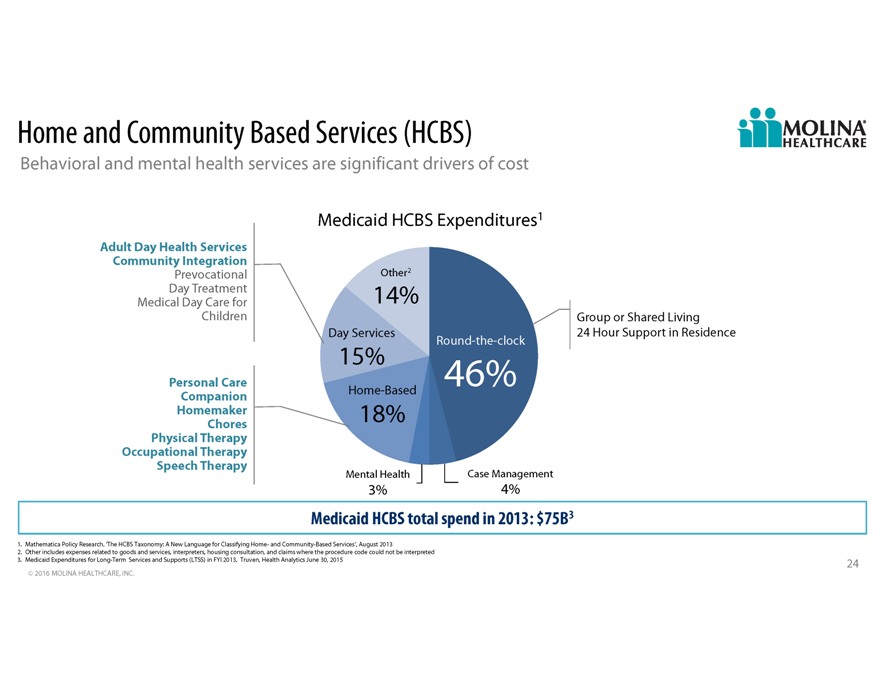
Home and
Community Based Services (HCBS) Behavioral and mental health services are significant drivers of cost Medicaid HCBS Expenditures1 Adult Day Health Services Community Integration Prevocational Other2 Day Treatment 14% Medical Day Care for Children
Group or Shared Living Day Services 24 Hour Support in Residence Round-the-clock 15% Personal Care 46% Companion Home-Based Homemaker 18% Chores Physical Therapy Occupational Therapy Speech Therapy Mental Health Case Management 3% 4% Medicaid HCBS
total spend in 2013: $75B3 1. Mathematica Policy Research. The HCBS Taxonomy: A New Language for Classifying Home- and Community-Based Services, August 2013 2. Other includes expenses related to goods and services, interpreters, housing
consultation, and claims where the procedure code could not be interpreted 3. Medicaid Expenditures for Long-Term Services and Supports (LTSS) in FYI 2013. Truven, Health Analytics June 30, 2015 24 2016 MOLINA HEALTHCARE, INC.
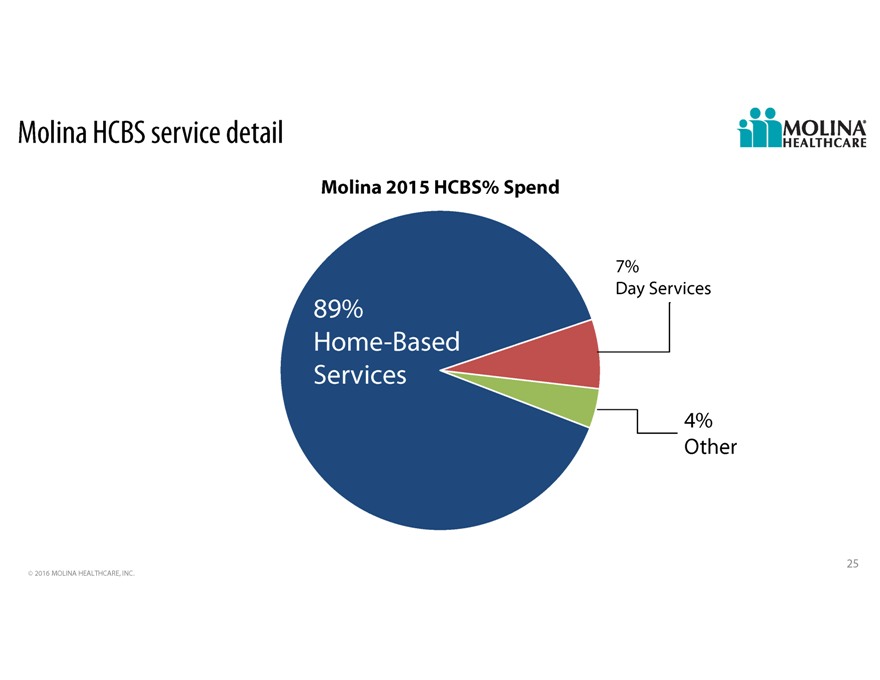
Molina
HCBS service detail Molina 2015 HCBS% Spend 7% Day Services 89% Home -Based Services 4% Other 25 2016 MOLINA HEALTHCARE, INC.
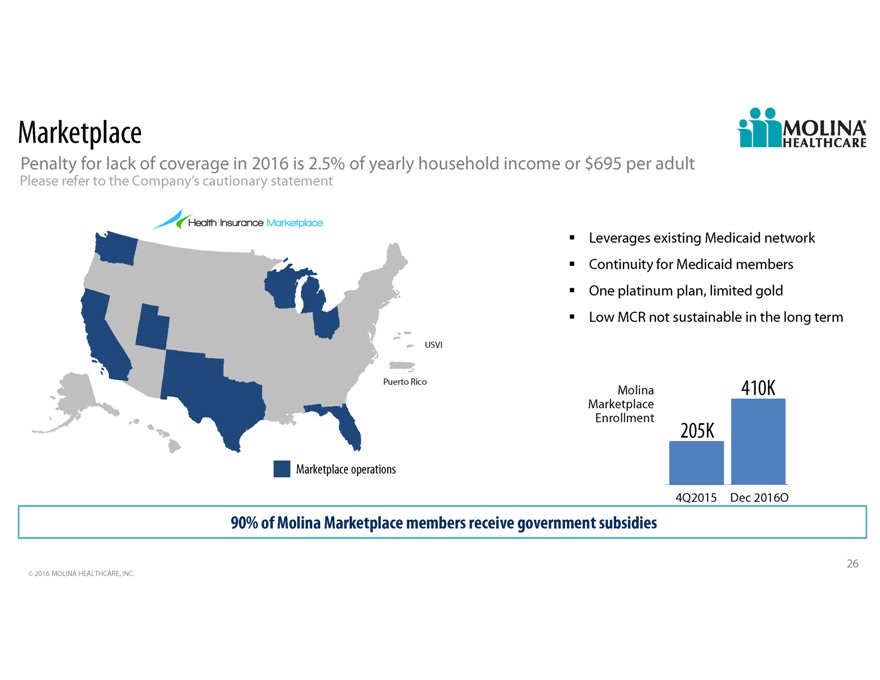
Marketplace Penalty for lack of coverage in 2016 is 2.5% of yearly household income or $695 per adult Please refer to the
Companys cautionary statement Leverages existing Medicaid network Continuity for Medicaid members One platinum plan, limited gold Low MCR not sustainable in the long term USVI Puerto Rico Molina 410K Marketplace Enrollment 205K Marketplace
operations 4Q2015 Dec 2016O 90% of Molina Marketplace members receive government subsidies 26 2016 MOLINA HEALTHCARE, INC.
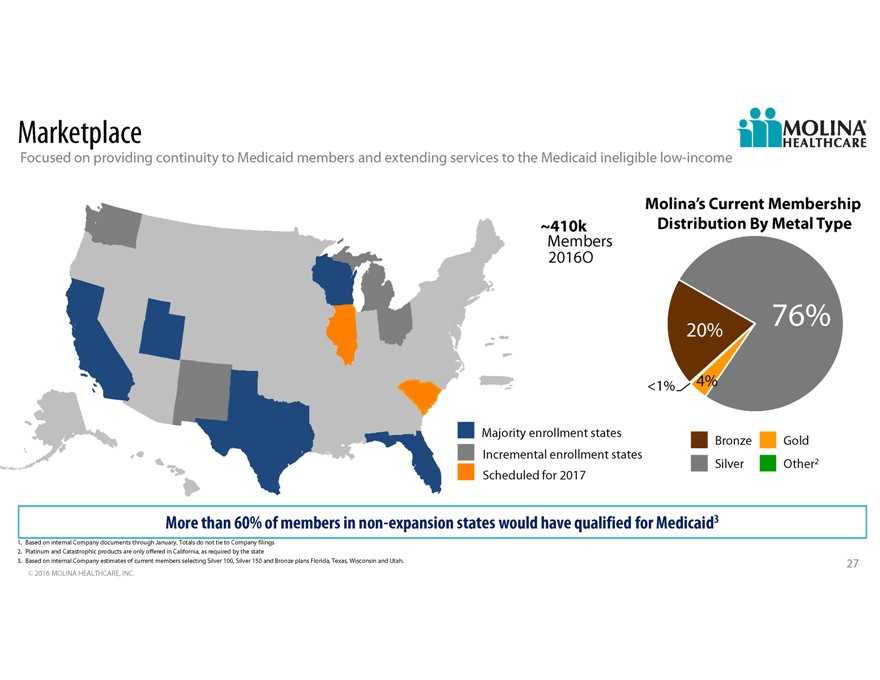
Marketplace Focused on providing continuity to Medicaid members and extending services to the Medicaid ineligible
low-income Molinas Current Membership 410k Distribution By Metal Type Members 2016O 20% 76% <1% 4% Majority enrollment states Bronze Gold Incremental enrollment states Silver Other2 Scheduled for 2017 More than 60% of members in non-expansion
states would have qualified for Medicaid3 1. Based on internal Company documents through January. Totals do not tie to Company filings 2. Platinum and Catastrophic products are only offered in California, as required by the state 3. Based on
internal Company estimates of current members selecting Silver 100, Silver 150 and Bronze plans Florida, Texas, Wisconsin and Utah. 27 2016 MOLINA HEALTHCARE, INC.
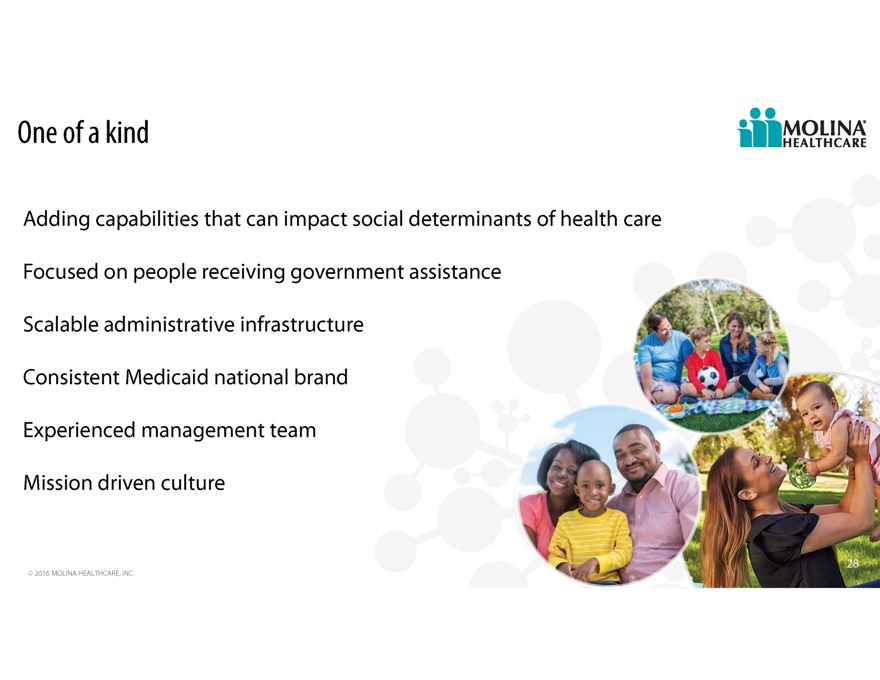
One of a
kind Adding capabilities that can impact social determinants of health care Focused on people receiving government assistance Scalable administrative infrastructure Consistent Medicaid national brand Experienced management team Mission driven
culture 28 2016 MOLINA HEALTHCARE, INC.

2016A
Investor Day MLTSS and Duals Terry Bayer, Chief Operating Officer February 11, 2016 / New York, New York
True
Molina Story Vickie https://www.youtube.com/watchv=oPFB0Sxq_lA 30 2016 MOLINA HEALTHCARE, INC.
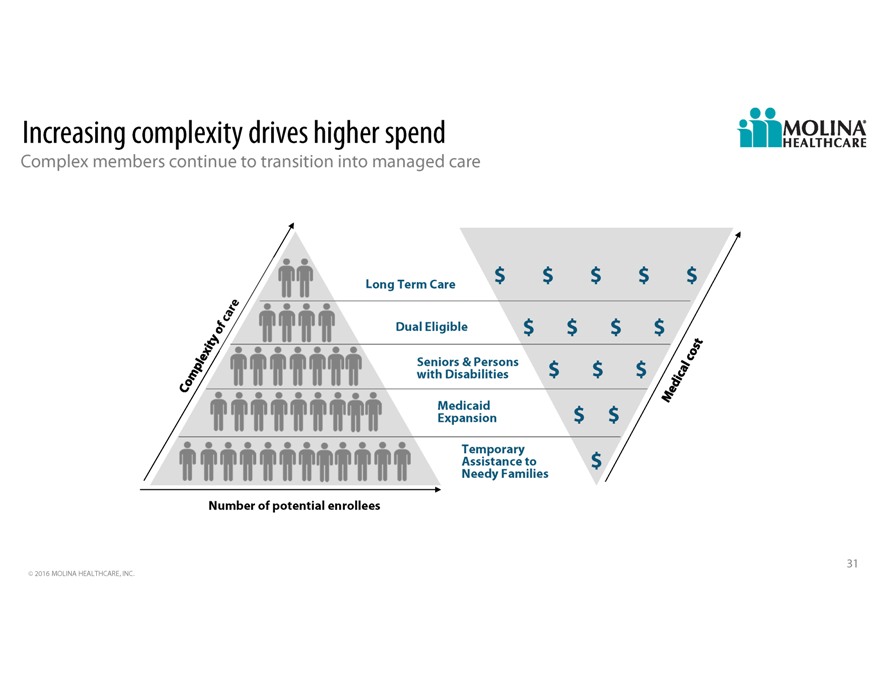
Increasing
complexity drives higher spend Complex members continue to transition into managed care Long Term Care $ $ $ $ $ Dual Eligible $ $ $ $ Seniors & Persons with Disabilities $ $ $ Medicaid Expansion $ $ Temporary Assistance to $ Needy Families
Number of potential enrollees 31 2016 MOLINA HEALTHCARE, INC.
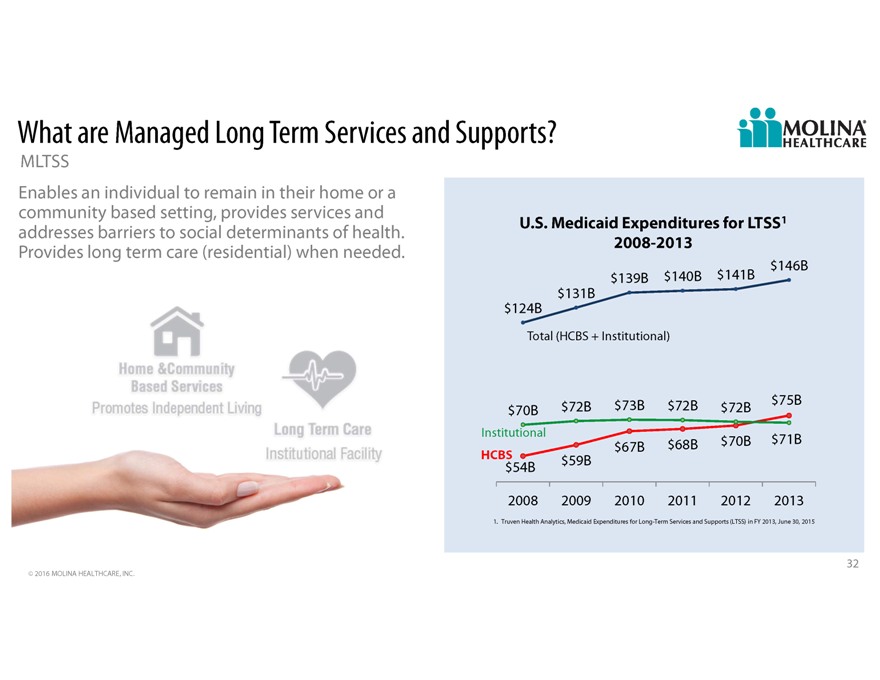
What are
Managed Long Term Services and Supports MLTSS Enables an individual to remain in their home or a community based setting, provides services and addresses barriers to social determinants of health. U.S. Medicaid Expenditures for LTSS1 Provides long
term care (residential) when needed. 2008-2013 $146B $139B $140B $141B $131B $124B Total (HCBS + Institutional) $72B $73B $72B $75B $70B $72B Institutional $67B $68B $70B $71B HCBS $59B $54B 2008 2009 2010 2011 2012 2013 1. Truven Health Analytics,
Medicaid Expenditures for Long-Term Services and Supports (LTSS) in FY 2013, June 30, 2015 32 2016 MOLINA HEALTHCARE, INC.
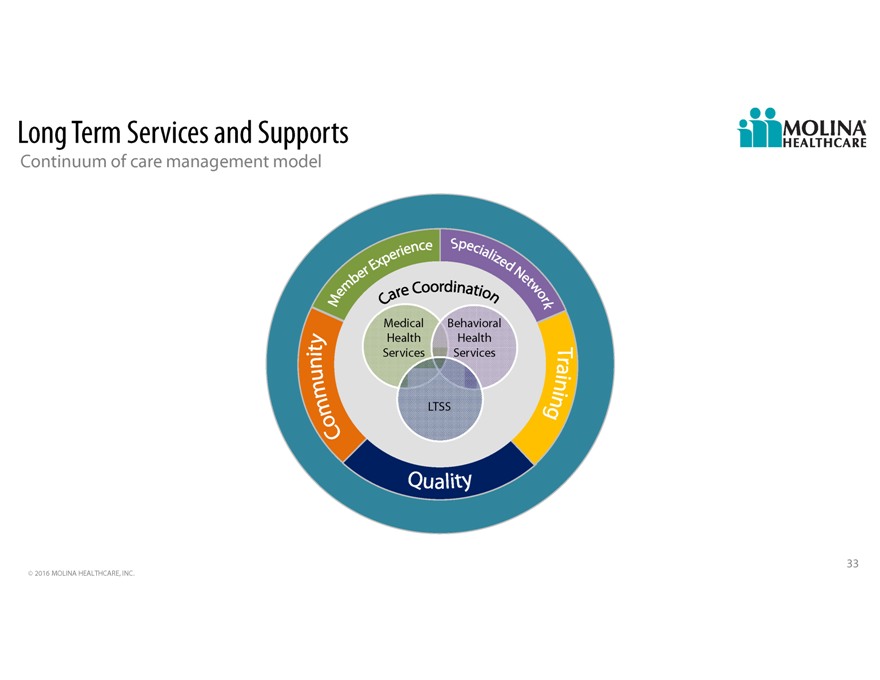
Long Term
Services and Supports Continuum of care management model Medical Behavioral Health Health Services Services LTSS 33 2016 MOLINA HEALTHCARE, INC.
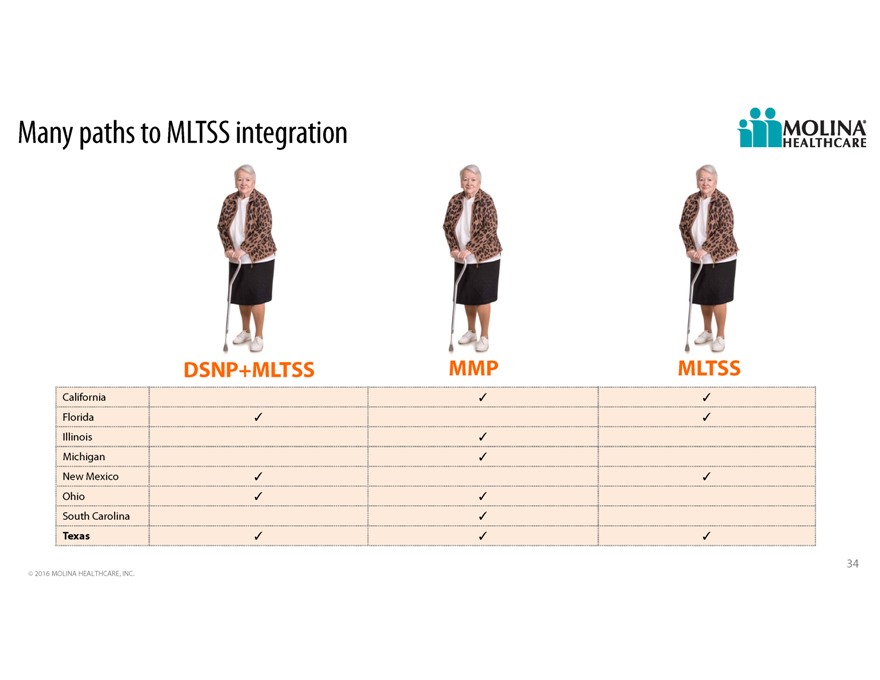
Many paths
to MLTSS integration DSNP+MLTSS MMP MLTSS California Florida Illinois Michigan New Mexico Ohio South Carolina Texas 34 2016 MOLINA HEALTHCARE, INC.
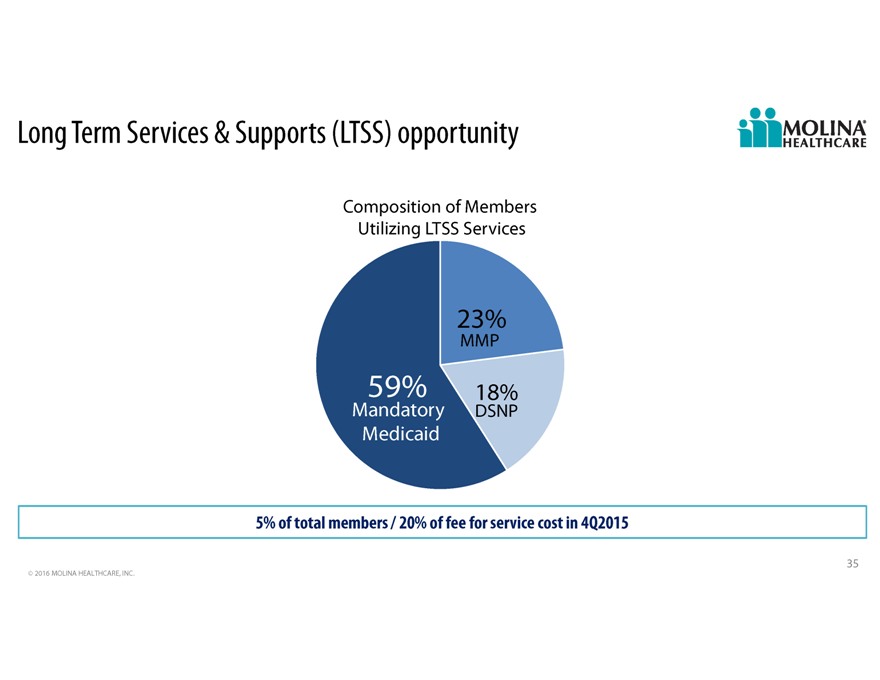
Long Term
Services & Supports (LTSS) opportunity Composition of Members Utilizing LTSS Services 23% MMP 59% 18% Mandatory DSNP Medicaid 5% of total members / 20% of fee for service cost in 4Q2015 35 2016 MOLINA HEALTHCARE, INC.
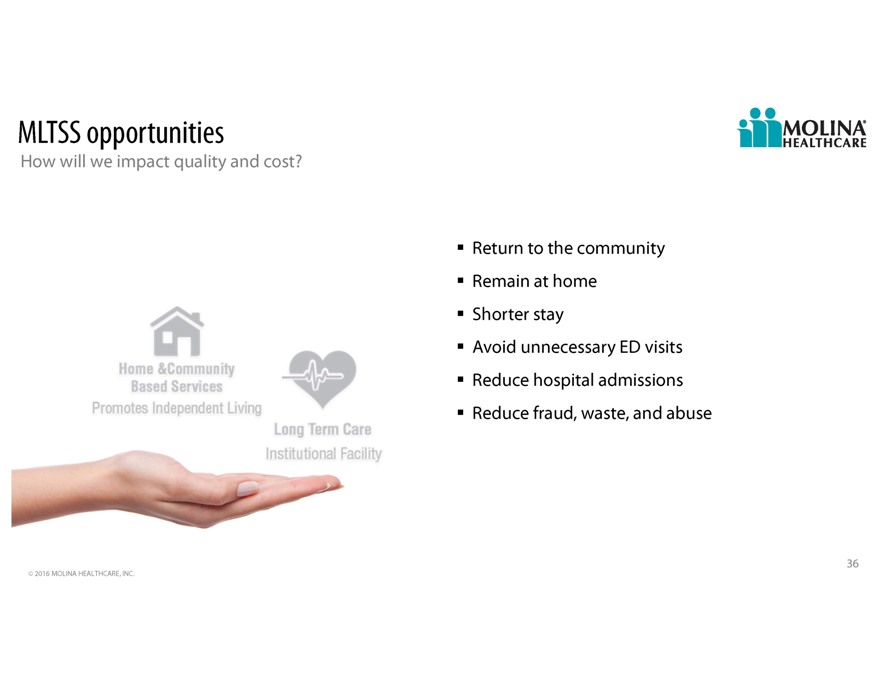
MLTSS
opportunities How will we impact quality and cost Return to the community Remain at home Shorter stay Avoid unnecessary ED visits Reduce hospital admissions Reduce fraud, waste, and abuse 36 2016 MOLINA HEALTHCARE, INC.
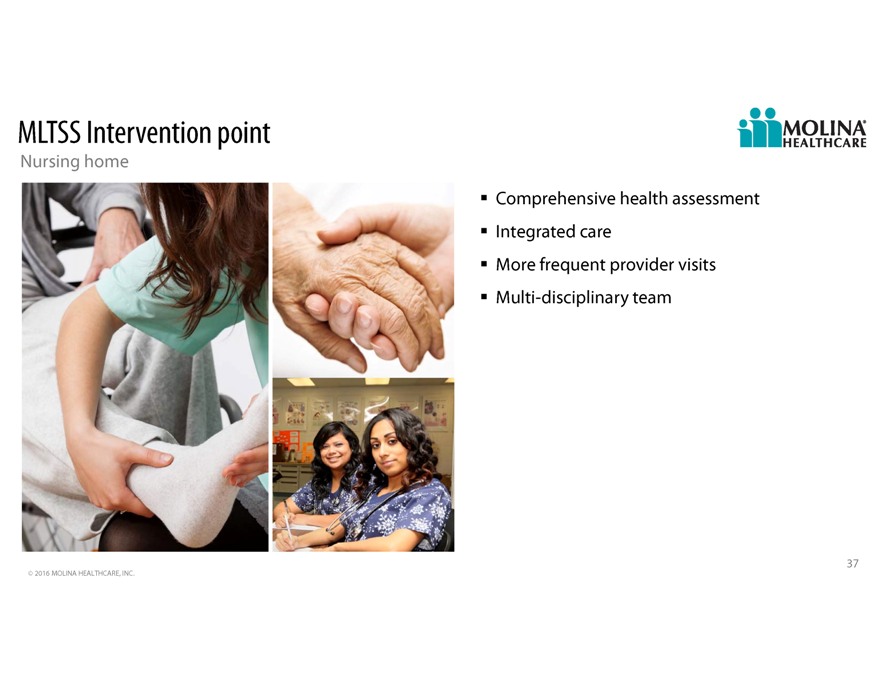
MLTSS
Intervention point Nursing home Comprehensive health assessment Integrated care More frequent provider visits Multi-disciplinary team 37 2016 MOLINA HEALTHCARE, INC.
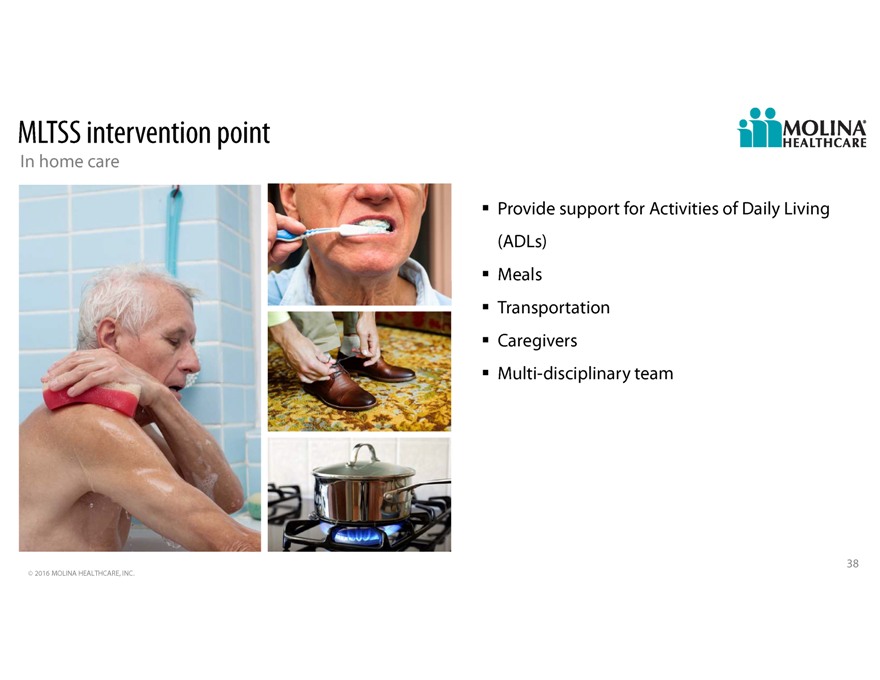
MLTSS
intervention point In home care Provide support for Activities of Daily Living (ADLs) Meals Transportation Caregivers Multi-disciplinary team 38 2016 MOLINA HEALTHCARE, INC.
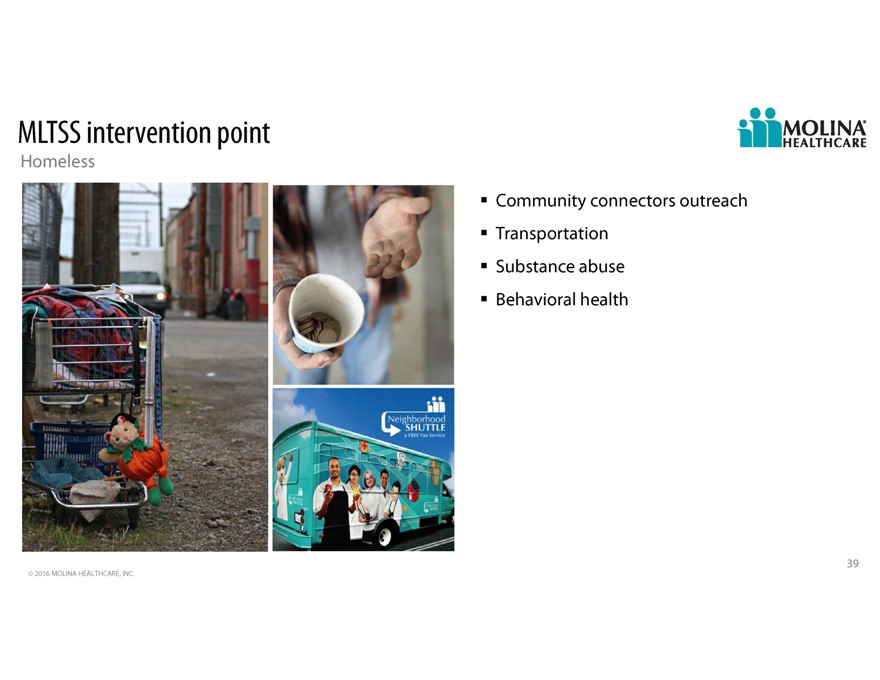
MLTSS
intervention point Homeless Community connectors outreach Transportation Substance abuse Behavioral health 39 2016 MOLINA HEALTHCARE, INC.

Shift from
inpatient care to home-based outpatient care 40 2016 MOLINA HEALTHCARE, INC.
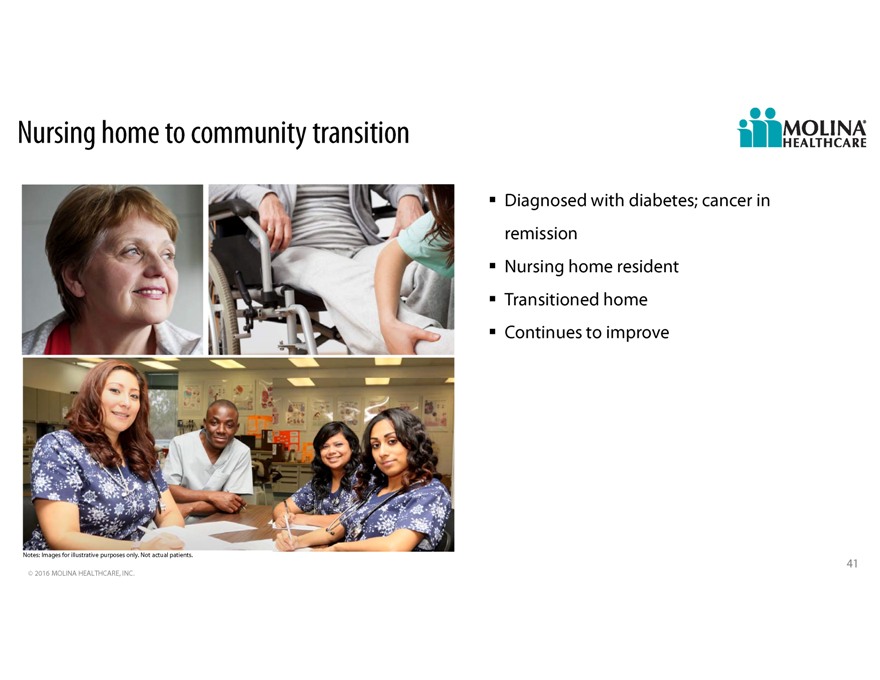
Nursing
home to community transition Diagnosed with diabetes; cancer in remission Nursing home resident Transitioned home Continues to improve Notes: Images for illustrative purposes only. Not actual patients. 41 2016 MOLINA HEALTHCARE, INC.
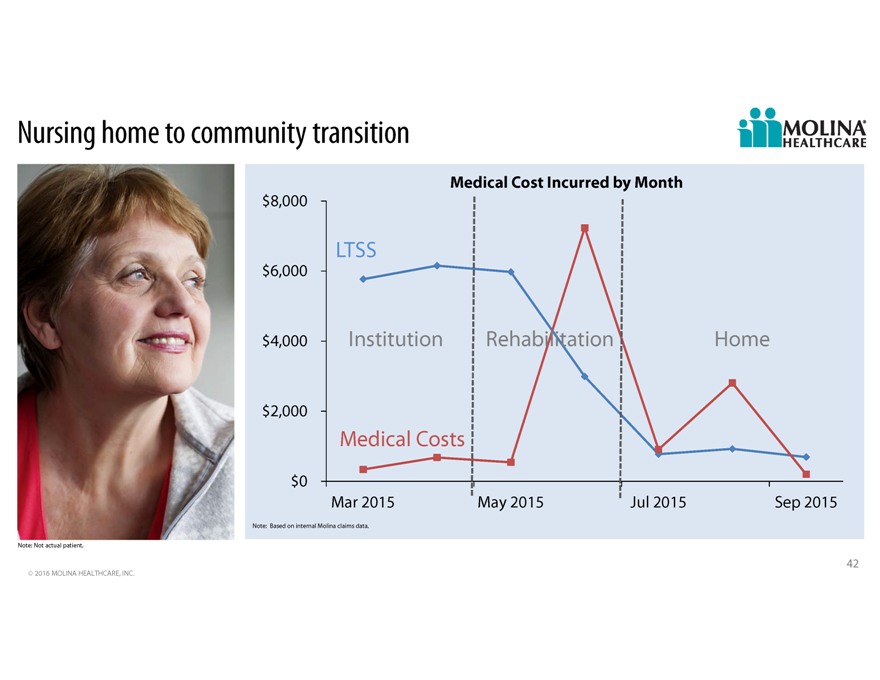
Nursing
home to community transition Medical Cost Incurred by Month $8,000 LTSS $6,000 $4,000 Institution Rehabilitation Home $2,000 Medical Costs $0 Mar 2015 May 2015 Jul 2015 Sep 2015 Note: Based on internal Molina claims data. Note: Not actual patient.
42 2016 MOLINA HEALTHCARE, INC.
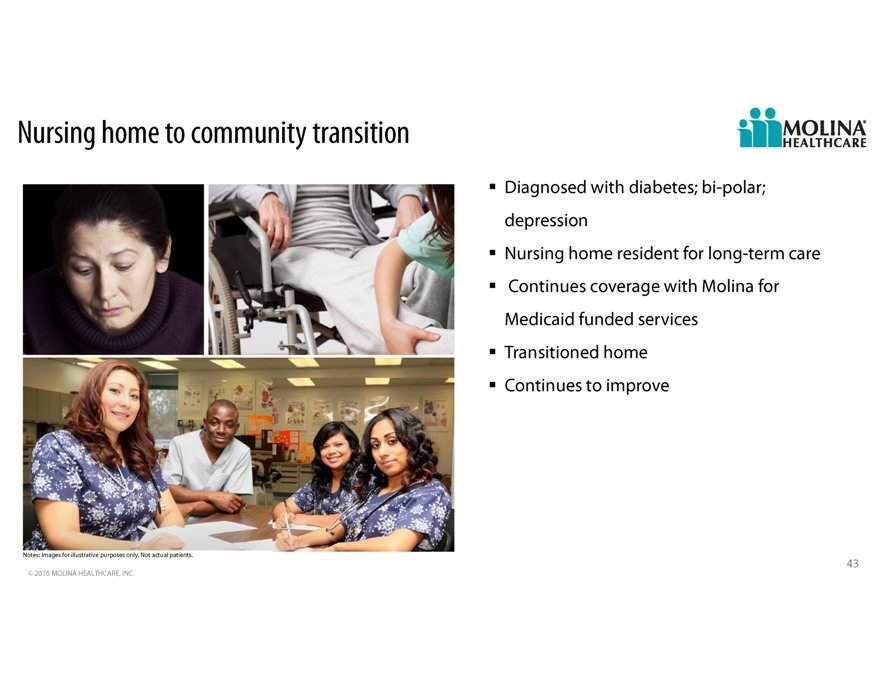
Nursing
home to community transition Diagnosed with diabetes; bi-polar; depression Nursing home resident for long-term care Continues coverage with Molina for Medicaid funded services Transitioned home Continues to improve Notes: Images for illustrative
purposes only. Not actual patients. 43 2016 MOLINA HEALTHCARE, INC.
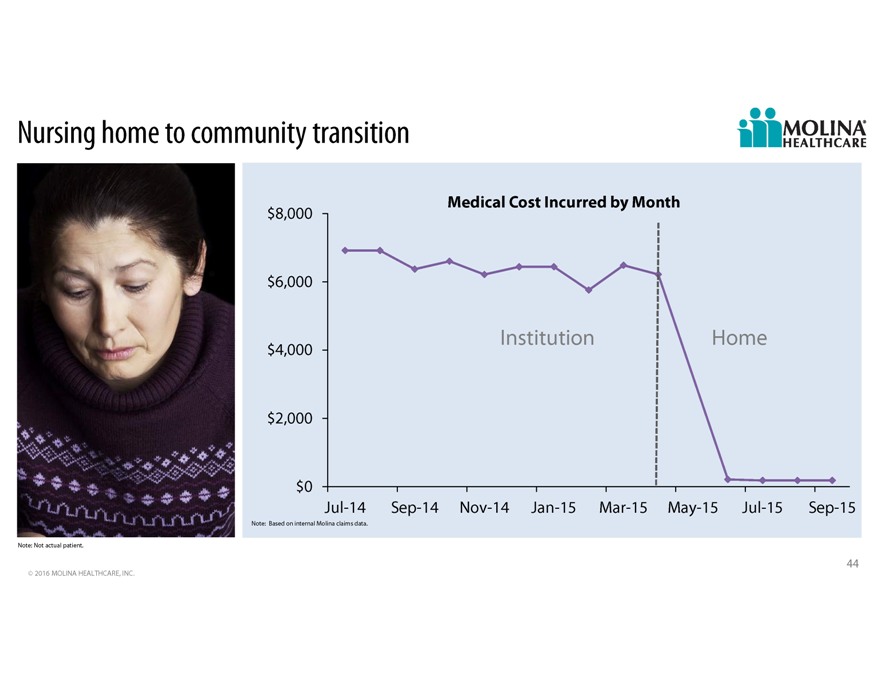
Nursing
home to community transition Medical Cost Incurred by Month $8,000 $6,000 Institution Home $4,000 $2,000 $0 Jul-14 Sep-14 Nov-14 Jan-15 Mar-15 May-15 Jul-15 Sep-15 Note: Based on internal Molina claims data. Note: Not actual patient. 44 2016 MOLINA
HEALTHCARE, INC.

Q&A 45

2016A
Investor Day Marketplace FAQ Joseph White, Chief Accounting Officer February 11, 2016 / New York, New York
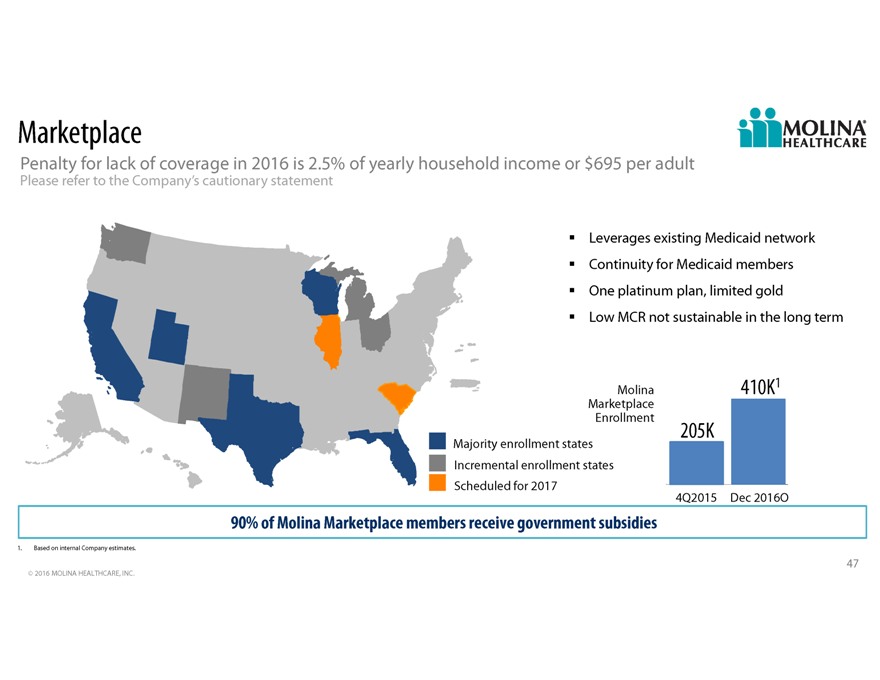
Marketplace Penalty for lack of coverage in 2016 is 2.5% of yearly household income or $695 per adult Please refer to the
Companys cautionary statement Leverages existing Medicaid network Continuity for Medicaid members One platinum plan, limited gold Low MCR not sustainable in the long term Molina 410K1 Marketplace Enrollment 205K Majority enrollment states
Incremental enrollment states Scheduled for 2017 4Q2015 Dec 2016O 90% of Molina Marketplace members receive government subsidies 1. Based on internal Company estimates. 47 2016 MOLINA HEALTHCARE, INC.
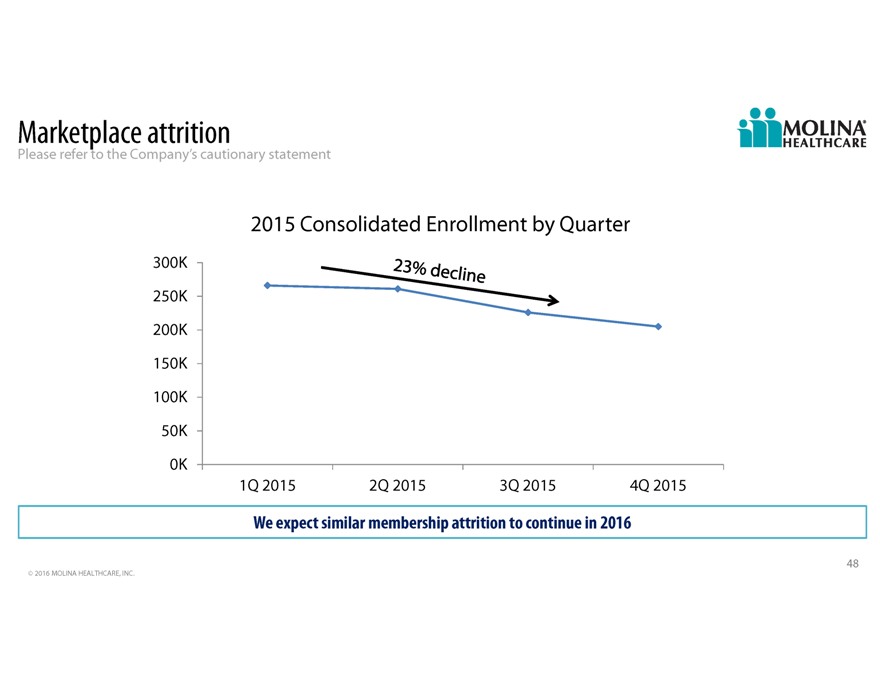
Marketplace attrition Please refer to the Companys cautionary statement 2015 Consolidated Enrollment by Quarter 300K 250K
200K 150K 100K 50K 0K 1Q 2015 2Q 2015 3Q 2015 4Q 2015 We expect similar membership attrition to continue in 2016 48 2016 MOLINA HEALTHCARE, INC.
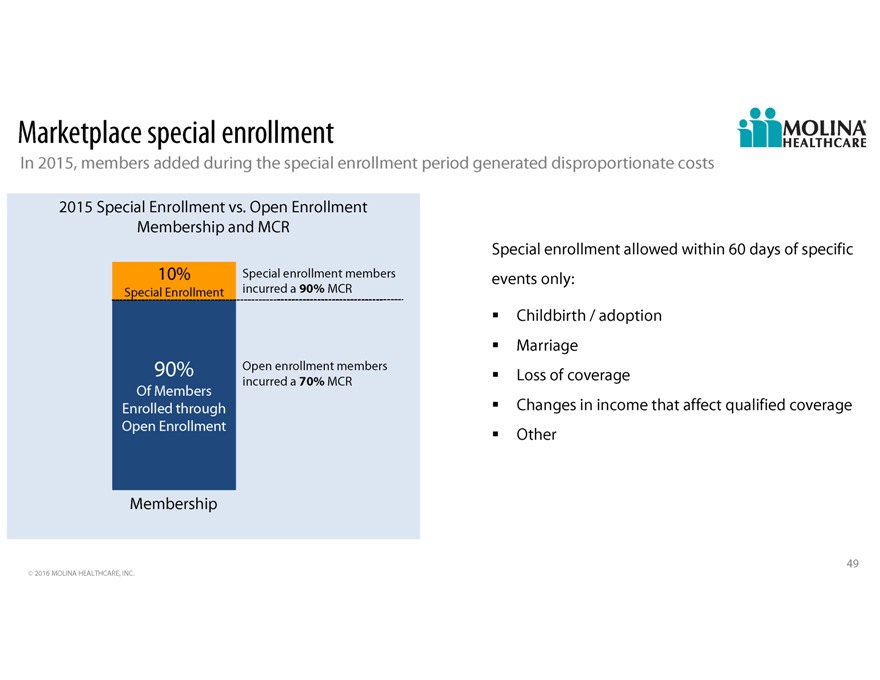
Marketplace special enrollment In 2015, members added during the special enrollment period generated disproportionate
costs 2015 Special Enrollment vs. Open Enrollment Membership and MCR Special enrollment allowed within 60 days of specific 10% Special enrollment members events only: Special Enrollment incurred a 90% MCR Childbirth / adoption Marriage 90% Open
enrollment members Loss of coverage incurred a 70% MCR Of Members Enrolled through Changes in income that affect qualified coverage Open Enrollment Other Membership 49 2016 MOLINA HEALTHCARE, INC.
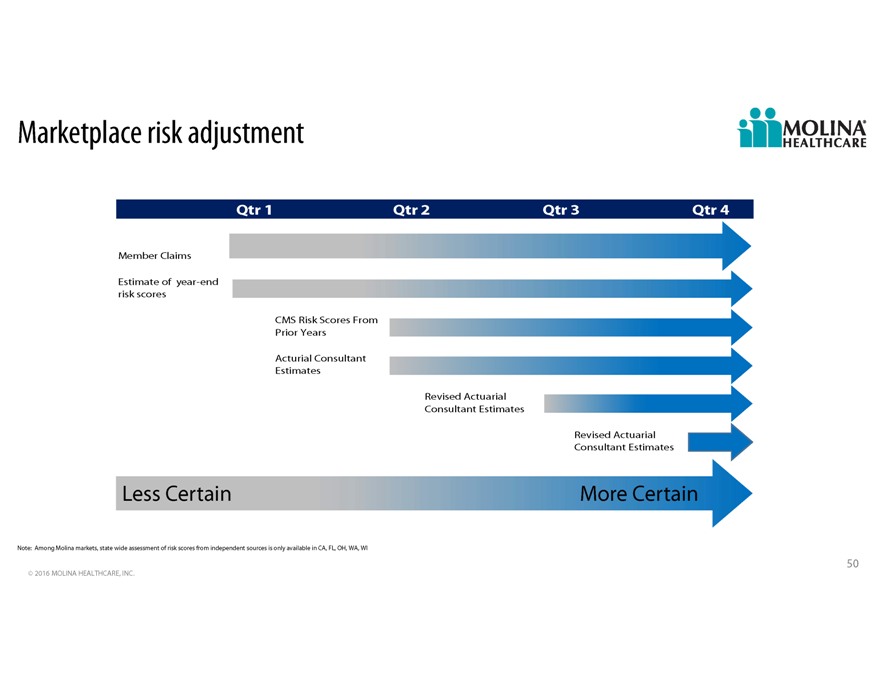
Marketplace risk adjustment Qtr 1 Qtr 2 Qtr 3 Qtr 4 Member Claims Estimate of year-end risk scores CMS Risk Scores From
Prior Years Acturial Consultant Estimates Revised Actuarial Consultant Estimates Revised Actuarial Consultant Estimates Less Certain More Certain Note: Among Molina markets, state wide assessment of risk scores from independent sources is only
available in CA, FL, OH, WA, WI 50 2016 MOLINA HEALTHCARE, INC.
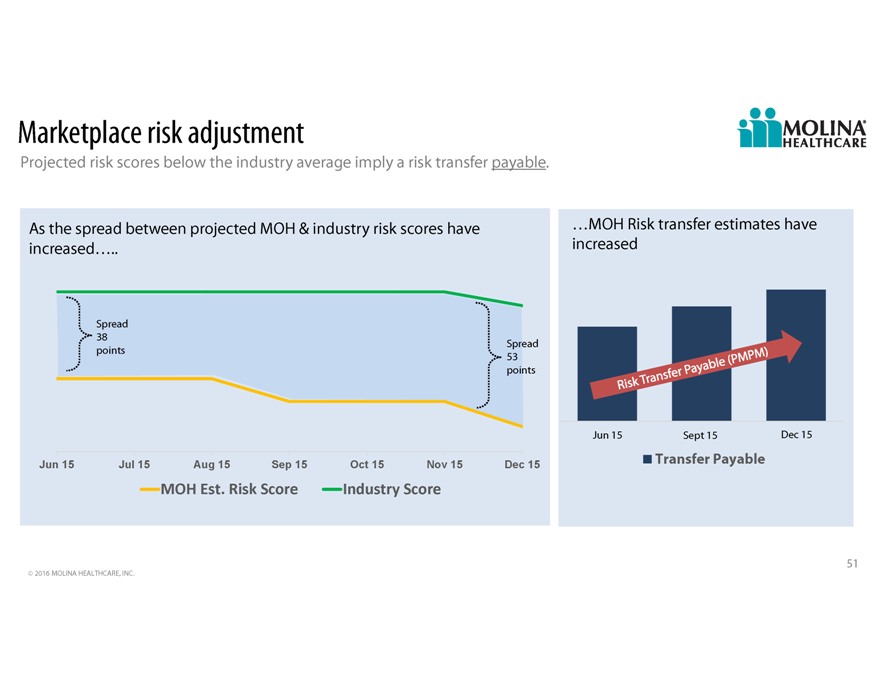
Marketplace risk adjustment Projected risk scores below the industry average imply a risk transfer payable. As the spread
between projected MOH & industry risk scores have MOH Risk transfer estimates have increased increased Spread 38 Spread points 53 points Jun1 15 Sept 15 Dec 15 Jun 15 Jul 15 Aug 15 Sep 15 Oct 15 Nov 15 Dec 15 Transfer Payable MOHEst.RiskScore
IndustryScore 51 2016 MOLINA HEALTHCARE, INC.

2016A
Investor Day 2016 Outlook John Molina, Chief Financial Officer February 11, 2016 / New York, New York

Cautionary
Statement Safe Harbor Statement under the Private Securities Litigation Reform Act of 1995: This slide presentation and our accompanying oral remarks contain numerous “forward-looking statements” regarding, without limitation: our
financial outlook and business expectations for 2016; expected rate changes in 2016; the integration of, and the achievement of expected revenues from our acquisitions; growth in our marketplace membership, including provider economics and risk
adjustment estimates associated with the marketplaces; care integration and care management; expected RFP opportunities and the success of our responses; our growth and acquisition strategy; and various other matters. All of our forward-looking
statements are subject to numerous risks, uncertainties, and other factors that could cause our actual results to differ materially from those projected in each forward-looking statement. Anyone viewing or listening to this presentation is urged to
read the risk factors and cautionary statements found under Item 1A in our annual report on Form 10-K, as well as the risk factors and cautionary statements in our quarterly reports on Form 10-Q, in our current reports on Form 8-K, and in our other
filings with the Securities and Exchange Commission and available for viewing on our website at sec.gov. Except to the extent required by federal securities laws, we do not undertake to address or update forward-looking statements in future filings
or communications regarding our business or operating results. 2 2016 MOLINA HEALTHCARE, INC.
Key
drivers in 2016 Please refer to the Companys cautionary statement Initial integration of Pathways Growth in Marketplace membership Focus on the care integration and care management opportunity Added interest expense from 5 3/8% notes Integration of
acquisitions Will increase revenue by $1.5 billion Increases amortization expense for 2016 3 2016 MOLINA HEALTHCARE, INC.
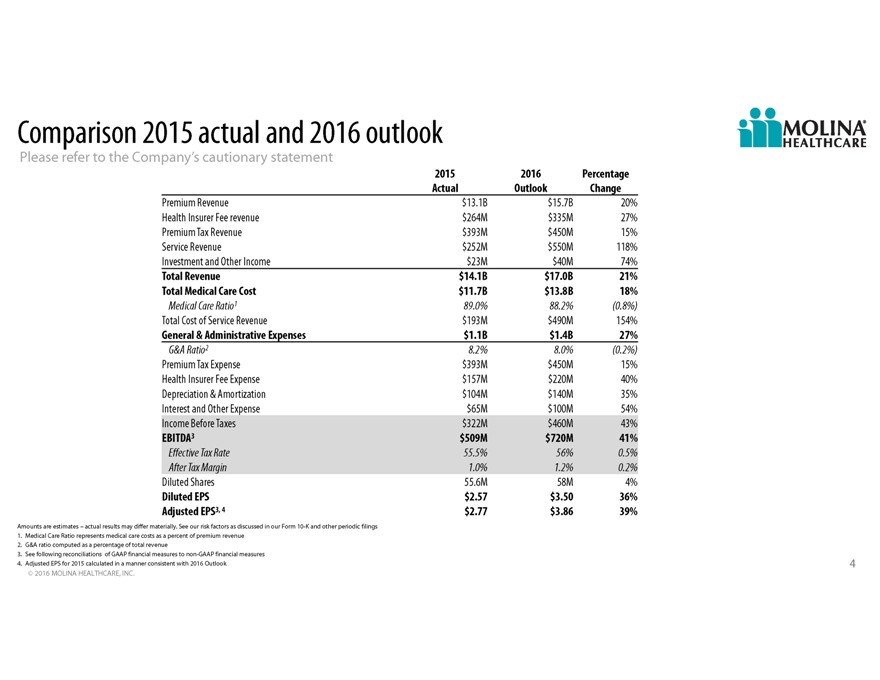
Comparison
2015 actual and 2016 outlook Please refer to the Companys cautionary statement 2015 2016 Percentage Actual Outlook Change Premium Revenue $13.1B $15.7B 20% Health Insurer Fee revenue $264M $335M 27% Premium Tax Revenue $393M $450M 15% Service
Revenue $252M $550M 118% Investment and Other Income $23M $40M 74% Total Revenue $14.1B $17.0B 21% Total Medical Care Cost $11.7B $13.8B 18% Medical Care Ratio1 89.0% 88.2%(0.8%) Total Cost of Service Revenue $193M $490M 154% General &
Administrative Expenses $1.1B $1.4B 27% G&A Ratio2 8.2% 8.0%(0.2%) Premium Tax Expense $393M $450M 15% Health Insurer Fee Expense $157M $220M 40% Depreciation & Amortization $104M $140M 35% Interest and Other Expense $65M $100M 54% Income
Before Taxes $322M $460M 43% EBITDA3 $509M $720M 41% Effective Tax Rate 55.5% 56% 0.5% After Tax Margin 1.0% 1.2% 0.2% Diluted Shares 55.6M 58M 4% Diluted EPS $2.57 $3.50 36% Adjusted EPS3, 4 $2.77 $3.86 39% Amounts are estimates actual results may
differ materially. See our risk factors as discussed in our Form 10-K and other periodic filings 1. Medical Care Ratio represents medical care costs as a percent of premium revenue 2. G&A ratio computed as a percentage of total revenue 3. See
following reconciliations of GAAP financial measures to non-GAAP financial measures 4. Adjusted EPS for 2015 calculated in a manner consistent with 2016 Outlook 4 2016 MOLINA HEALTHCARE, INC.
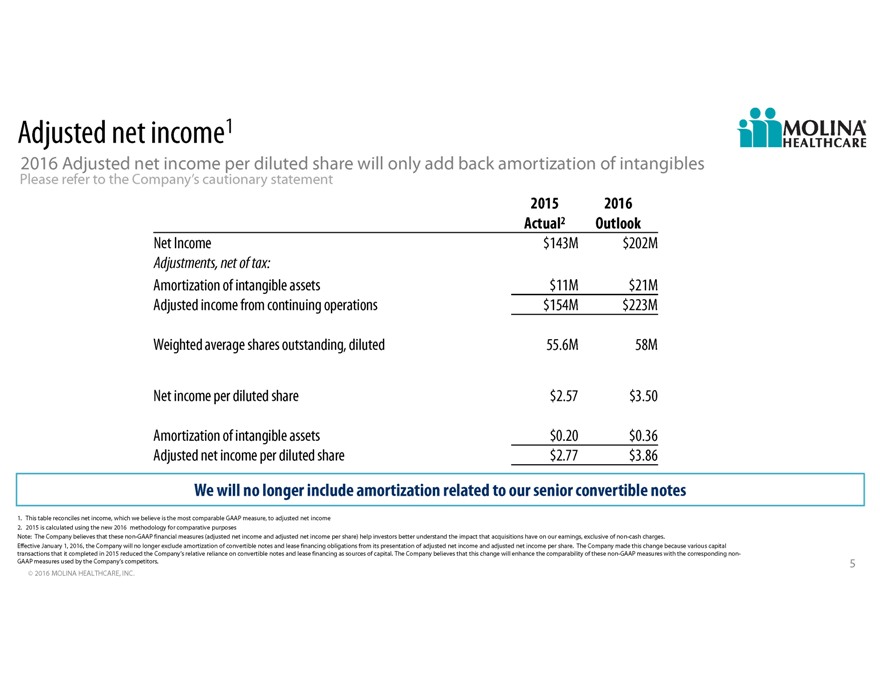
Adjusted
net income1 2016 Adjusted net income per diluted share will only add back amortization of intangibles Please refer to the Companys cautionary statement 2015 2016 Actual2 Outlook Net Income $143M $202M Adjustments, net of tax: Amortization of
intangible assets $11M $21M Adjusted income from continuing operations $154M $223M Weighted average shares outstanding, diluted 55.6M 58M Net income per diluted share $2.57 $3.50 Amortization of intangible assets $0.20 $0.36 Adjusted net income per
diluted share $2.77 $3.86 We will no longer include amortization related to our senior convertible notes 1. This table reconciles net income, which we believe is the most comparable GAAP measure, to adjusted net income 2. 2015 is calculated using
the new 2016 methodology for comparative purposes Note: The Company believes that these non-GAAP financial measures (adjusted net income and adjusted net income per share) help investors better understand the impact that acquisitions have on our
earnings, exclusive of non-cash charges. Effective January 1, 2016, the Company will no longer exclude amortization of convertible notes and lease financing obligations from its presentation of adjusted net income and adjusted net income per share.
The Company made this change because various capital transactions that it completed in 2015 reduced the Companys relative reliance on convertible notes and lease financing as sources of capital. The Company believes that this change will enhance the
comparability of these non-GAAP measures with the corresponding non- GAAP measures used by the Companys competitors. 5 2016 MOLINA HEALTHCARE, INC.
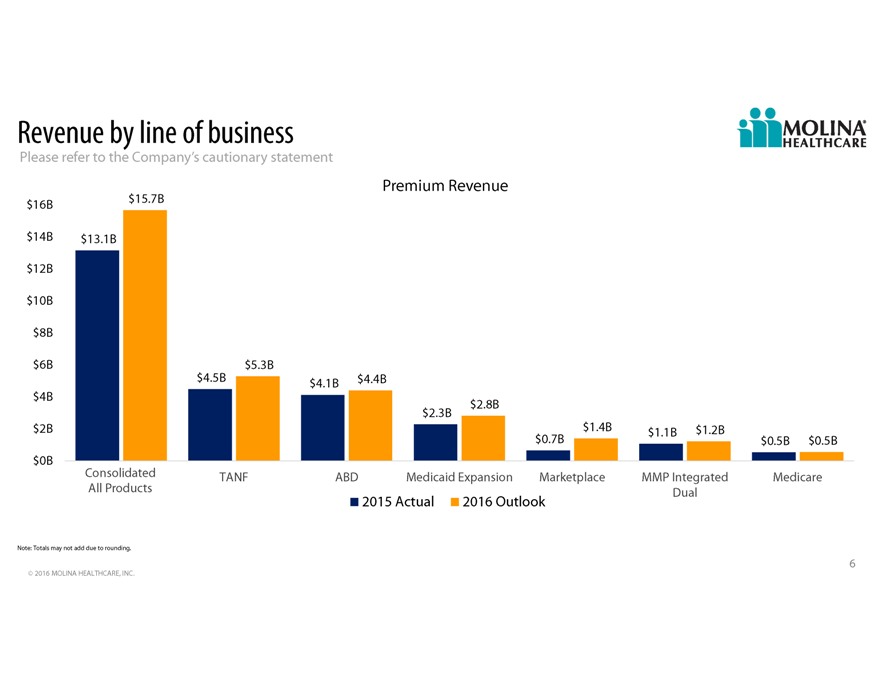
Revenue by
line of business Please refer to the Companys cautionary statement Premium Revenue $16B $15.7B $14B $13.1B $12B $10B $8B $6B $5.3B $4.5B $4.1B $4.4B $4B $2.8B $2.3B $2B $1.4B $1.1B $1.2B $0.7B $0.5B $0.5B $0B Consolidated TANF ABD Medicaid Expansion
Marketplace MMP Integrated Medicare All Products Dual 2015 Actual 2016 Outlook Note: Totals may not add due to rounding. 6 2016 MOLINA HEALTHCARE, INC.
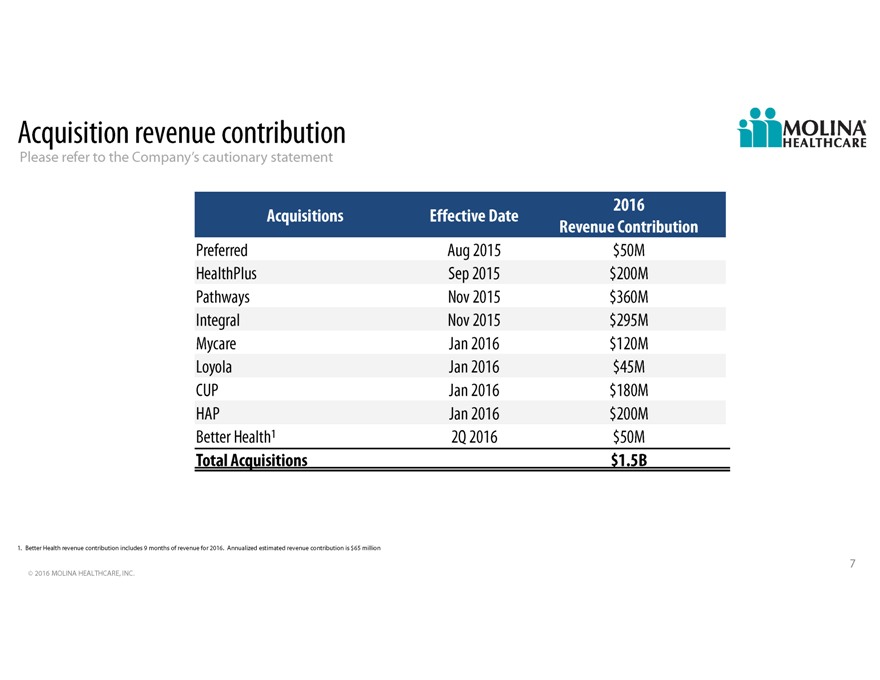
Acquisition revenue contribution Please refer to the Companys cautionary statement 2016 Acquisitions Effective Date
Revenue Contribution Preferred Aug 2015 $50M HealthPlus Sep 2015 $200M Pathways Nov 2015 $360M Integral Nov 2015 $295M Mycare Jan 2016 $120M Loyola Jan 2016 $45M CUP Jan 2016 $180M HAP Jan 2016 $200M Better Health1 2Q 2016 $50M Total Acquisitions
$1.5B 1. Better Health revenue contribution includes 9 months of revenue for 2016. Annualized estimated revenue contribution is $65 million 7 2016 MOLINA HEALTHCARE, INC.
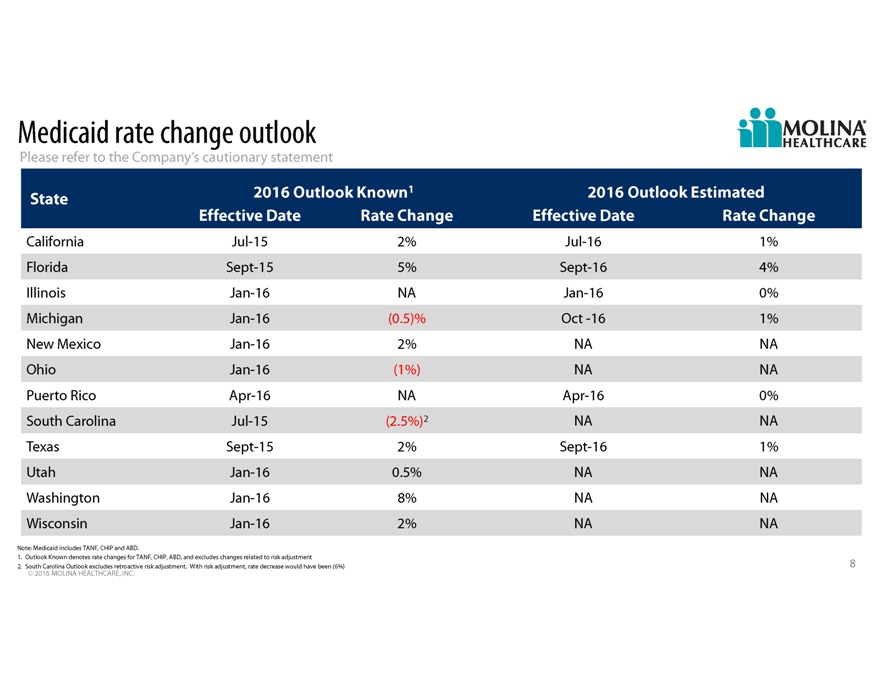
Medicaid
rate change outlook Please refer to the Companys cautionary statement State 2016 Outlook Known1 2016 Outlook Estimated Effective Date Rate Change Effective Date Rate Change California Jul-15 2% Jul-16 1% Florida Sept-15 5% Sept-16 4% Illinois Jan-16
NA Jan-16 0% Michigan Jan-16(0.5)% Oct -16 1% New Mexico Jan-16 2% NA NA Ohio Jan-16(1%) NA NA Puerto Rico Apr-16 NA Apr-16 0% South Carolina Jul-15(2.5%)2 NA NA Texas Sept-15 2% Sept-16 1% Utah Jan-16 0.5% NA NA Washington Jan-16 8% NA NA Wisconsin
Jan-16 2% NA NA Note: Medicaid includes TANF, CHIP and ABD. 1. Outlook Known denotes rate changes for TANF, CHIP, ABD, and excludes changes related to risk adjustment 2. South Carolina Outlook excludes retroactive risk adjustment. With risk
adjustment, rate decrease would have been (6%) 8 2016 MOLINA HEALTHCARE, INC.
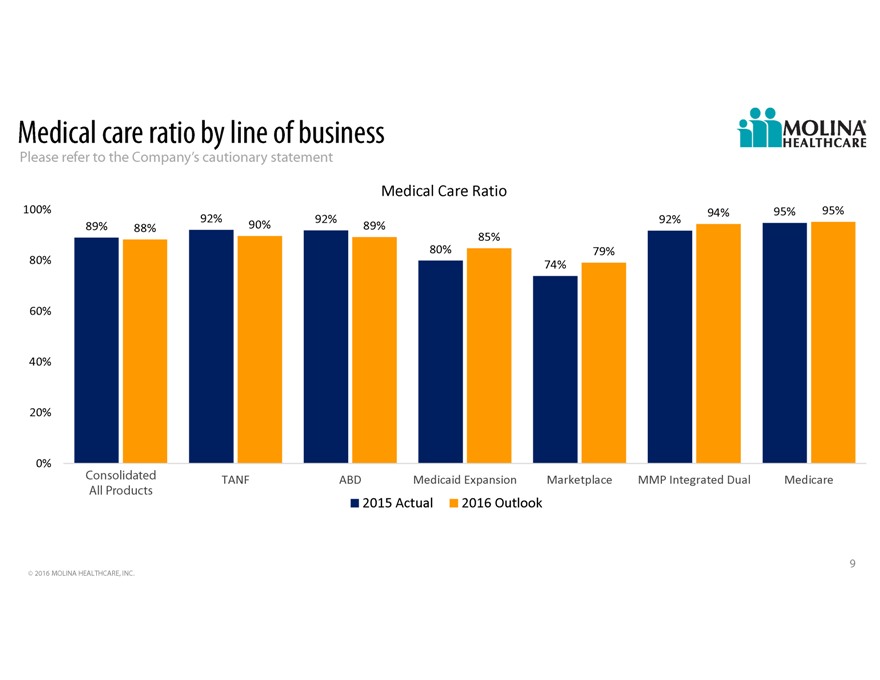
Medical
care ratio by line of business Please refer to the Companys cautionary statement MedicalCareRatio 100% 94% 95% 95% 92% 92% 92% 89% 88% 90% 89% 85% 80% 79% 80% 74% 60% 40% 20% 0% Consolidated TANF ABD MedicaidExpansion Marketplace MMPIntegratedDual
Medicare All Products 2015Actual 2016Outlook 9 2016 MOLINA HEALTHCARE, INC.
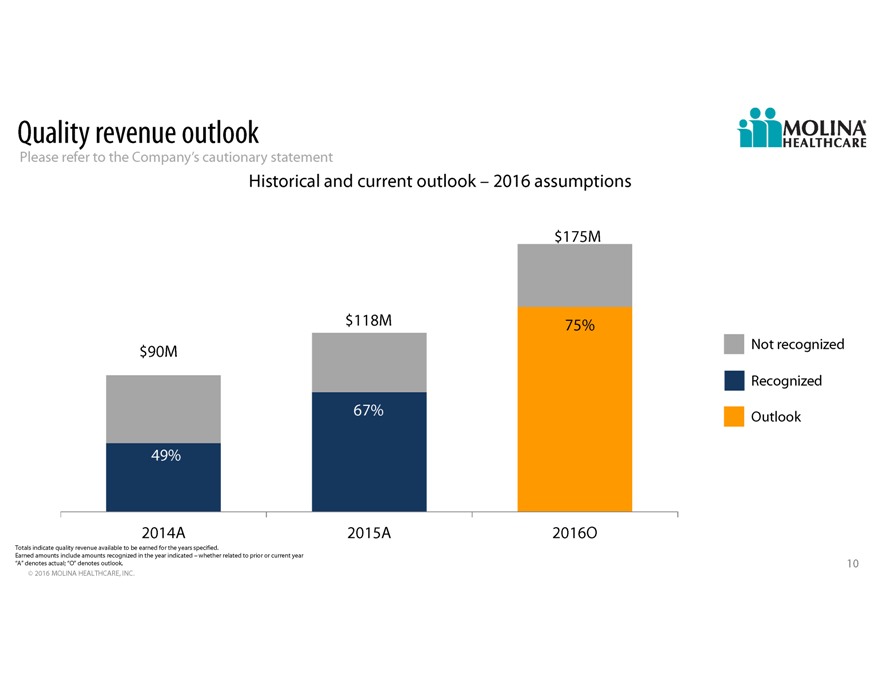
Quality
revenue outlook Please refer to the Companys cautionary statement Historical and current outlook 2016 assumptions $175M $118M 75% $90M Not recognized Recognized 67% Outlook 49% 2014A 2015A 2016O Totals indicate quality revenue available to be earned
for the years specified. Earned amounts include amounts recognized in the year indicated whether related to prior or current year “A” denotes actual; “O” denotes outlook. 10 2016 MOLINA HEALTHCARE, INC.
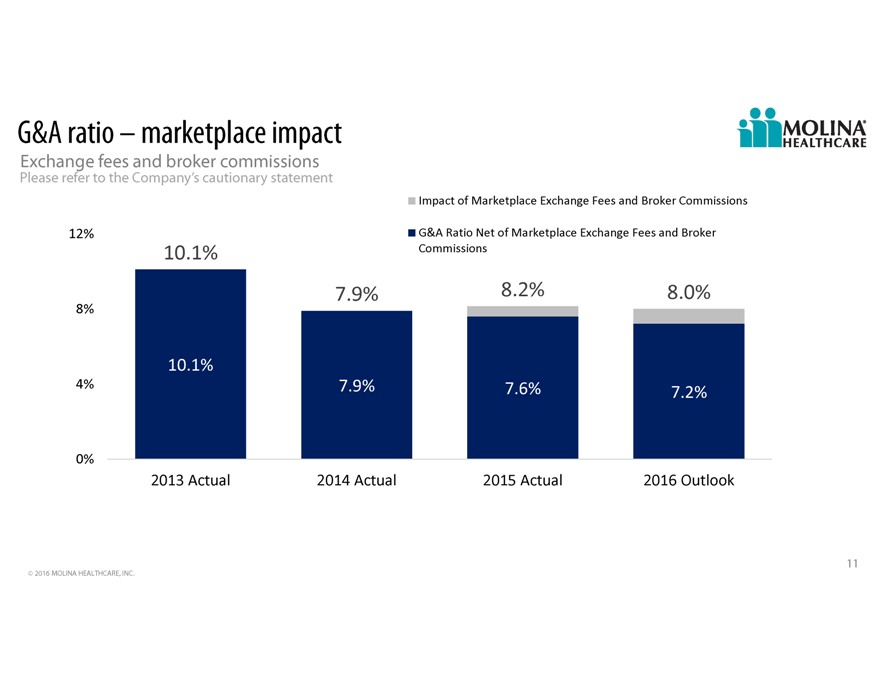
G&A
ratio marketplace impact Exchange fees and broker commissions Please refer to the Companys cautionary statement ImpactofMarketplaceExchangeFeesandBrokerCommissions 12% G&ARatioNetofMarketplaceExchangeFeesandBroker 10.1% Commissions 7.9% 8.2%
8.0% 8% 10.1% 4% 7.9% 7.6% 7.2% 0% 2013Actual 2014Actual 2015Actual 2016Outlook 11 2016 MOLINA HEALTHCARE, INC.
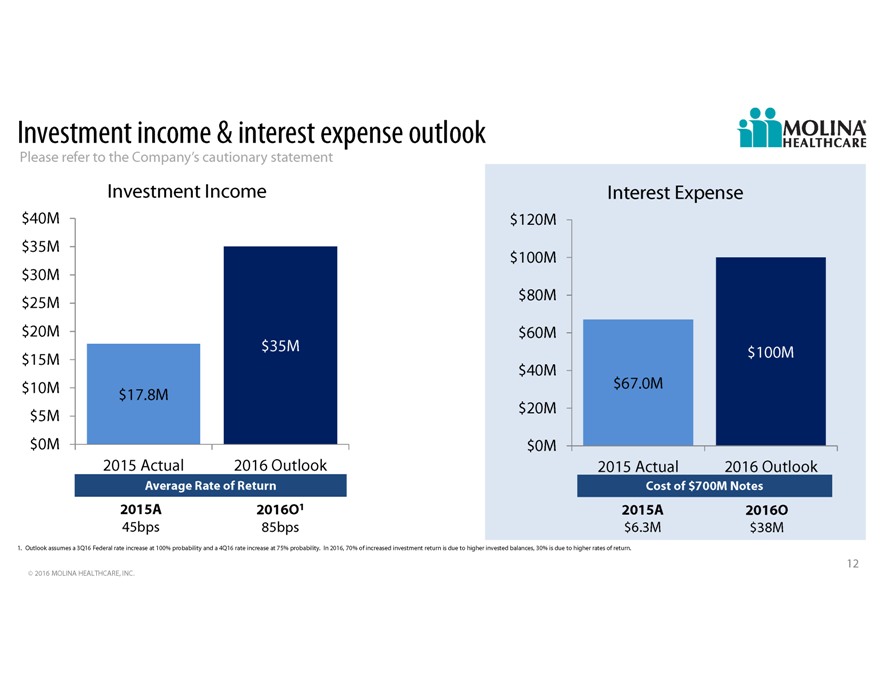
Investment
income & interest expense outlook Please refer to the Companys cautionary statement Investment Income Interest Expense $40M $120M $35M $100M $30M $25M $80M $20M $60M $35M $100M $15M $40M $10M $67.0M $17.8M $5M $20M $0M $0M 2015 Actual 2016
Outlook 2015 Actual 2016 Outlook Average Rate of Return Cost of $700M Notes 2015A 2016O1 2015A 2016O 45bps 85bps $6.3M $38M 1. Outlook assumes a 3Q16 Federal rate increase at 100% probability and a 4Q16 rate increase at 75% probability. In 2016, 70%
of increased investment return is due to higher invested balances, 30% is due to higher rates of return. 12 2016 MOLINA HEALTHCARE, INC.
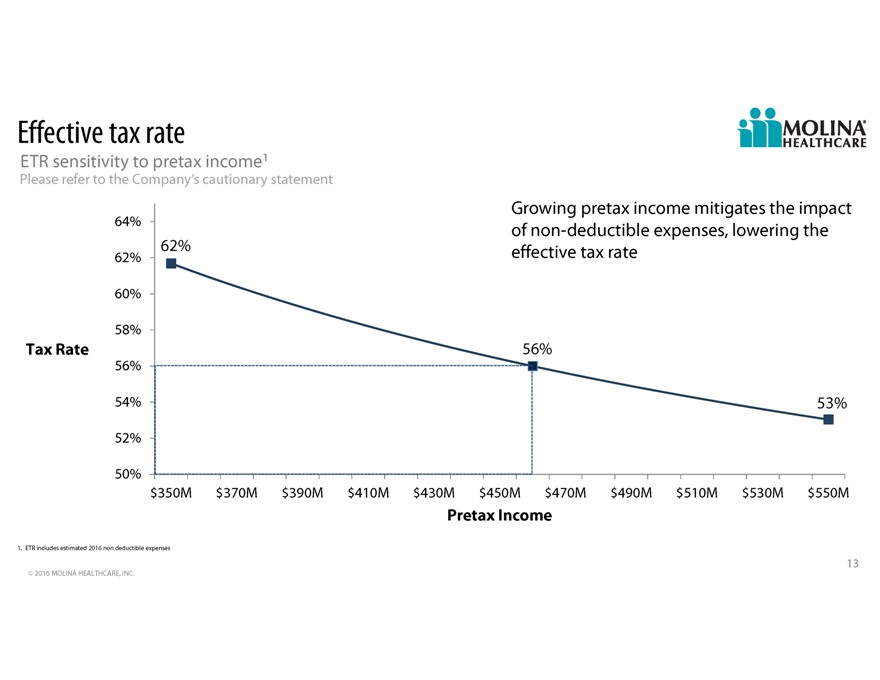
Effective
tax rate ETR sensitivity to pretax income1 Please refer to the Companys cautionary statement Growing pretax income mitigates the impact 64% of non-deductible expenses, lowering the 62% 62% effective tax rate 60% 58% Tax Rate 56% 56% 54% 53% 52% 50%
$350M $370M $390M $410M $430M $450M $470M $490M $510M $530M $550M Pretax Income 1. ETR includes estimated 2016 non deductible expenses 13 2016 MOLINA HEALTHCARE, INC.
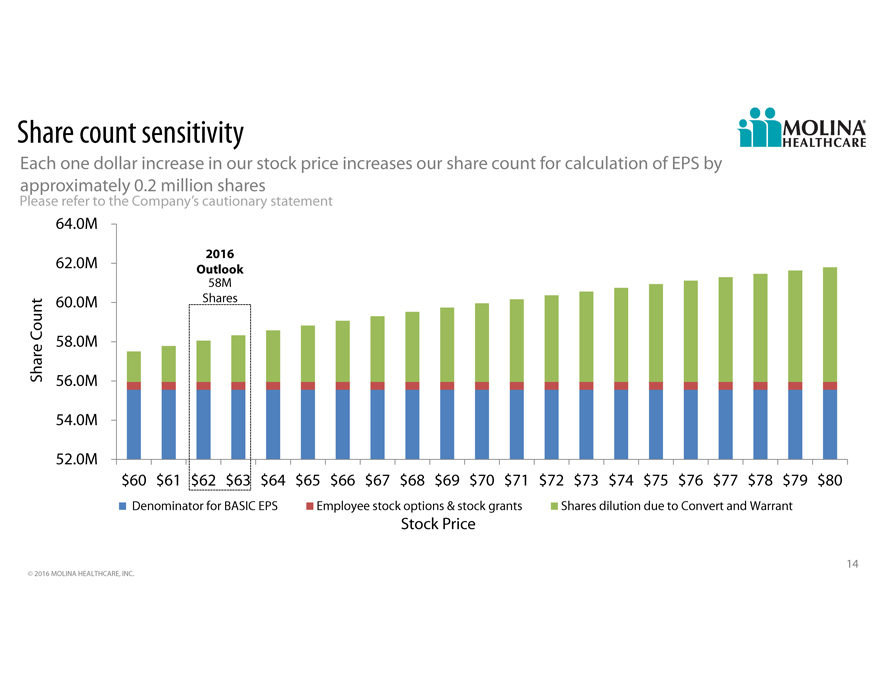
Share
count sensitivity
Each one dollar increase in our stock price increases our share count for calculation of EPS
by
approximately 0.2 million shares
Please refer to the Company’s cautionary statement
64.0M
2016
62.0M Outlook
58M
60.0M Shares
Count 58.0M
Share 56.0M
54.0M
52.0M
$60 $61 $62 $63 $64 $65 $66 $67 $68 $69 $70 $71 $72 $73 $74 $75 $76 $77 $78 $79 $80
Denominator for BASIC EPS Employee stock options & stock grants Shares dilution due to Convert and Warrant
Stock Price
14
© 2016 MOLINA HEALTHCARE, INC.
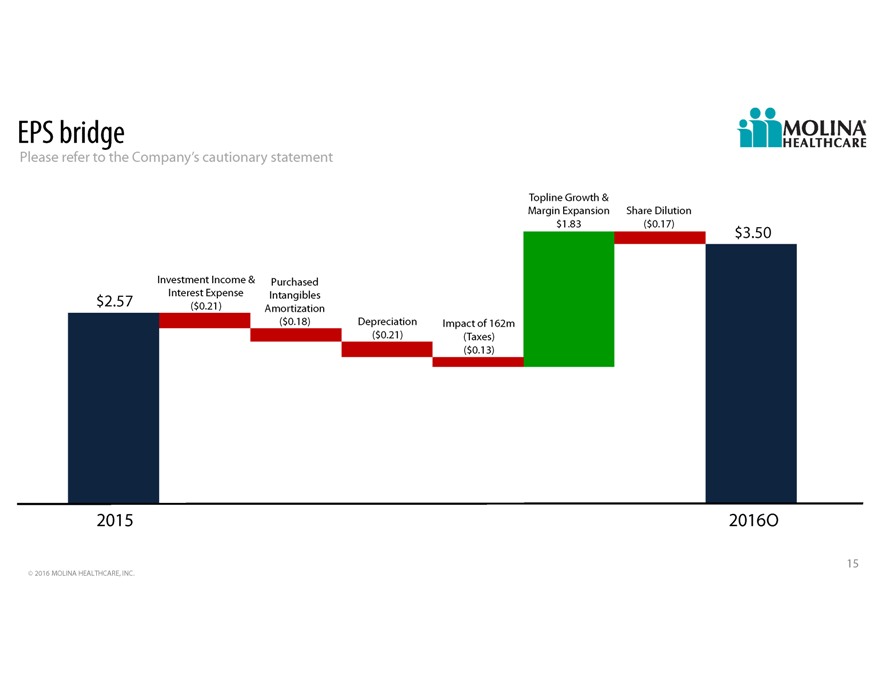
EPS bridge
Please refer to the Companys cautionary statement Topline Growth & Margin Expansion Share Dilution $1.83($0.17) $3.50 Investment Income & Purchased Interest Expense Intangibles $2.57($0.21) Amortization ($0.18) Depreciation Impact of 162m
($0.21)(Taxes) ($0.13) 2015 2016O 15 2016 MOLINA HEALTHCARE, INC.
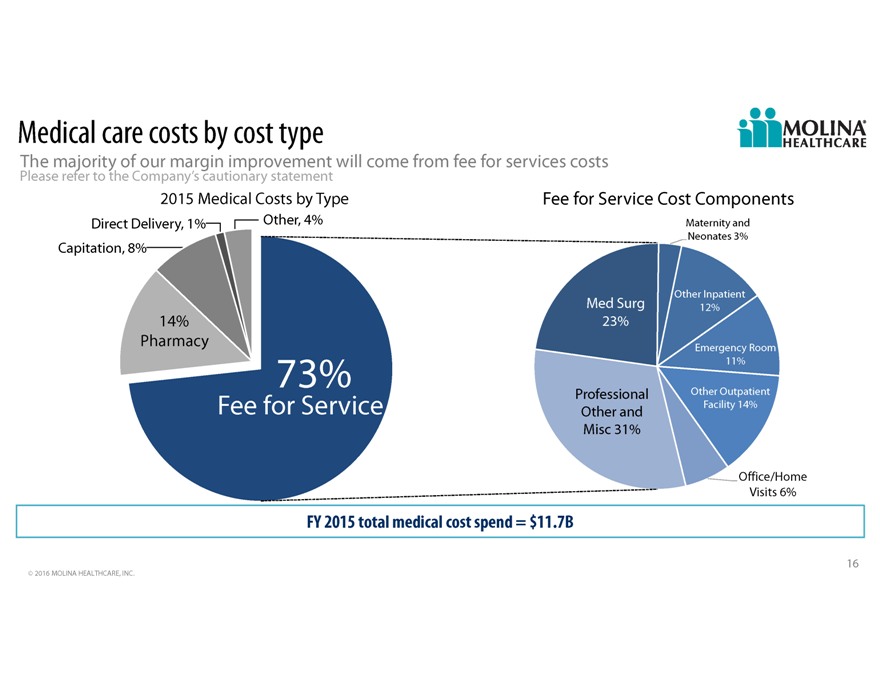
Medical
care costs by cost type The majority of our margin improvement will come from fee for services costs Please refer to the Companys cautionary statement 2015 Medical Costs by Type Fee for Service Cost Components Direct Delivery, 1% Other, 4% Maternity
and Neonates 3% Capitation, 8% Other Inpatient Med Surg 12% 14% 23% Pharmacy Emergency Room 11% 73% Professional Other Outpatient Fee for Service Other Facility 14% and Misc 31% Office/Home Visits 6% FY 2015 total medical cost spend = $11.7B 16 2016
MOLINA HEALTHCARE, INC.
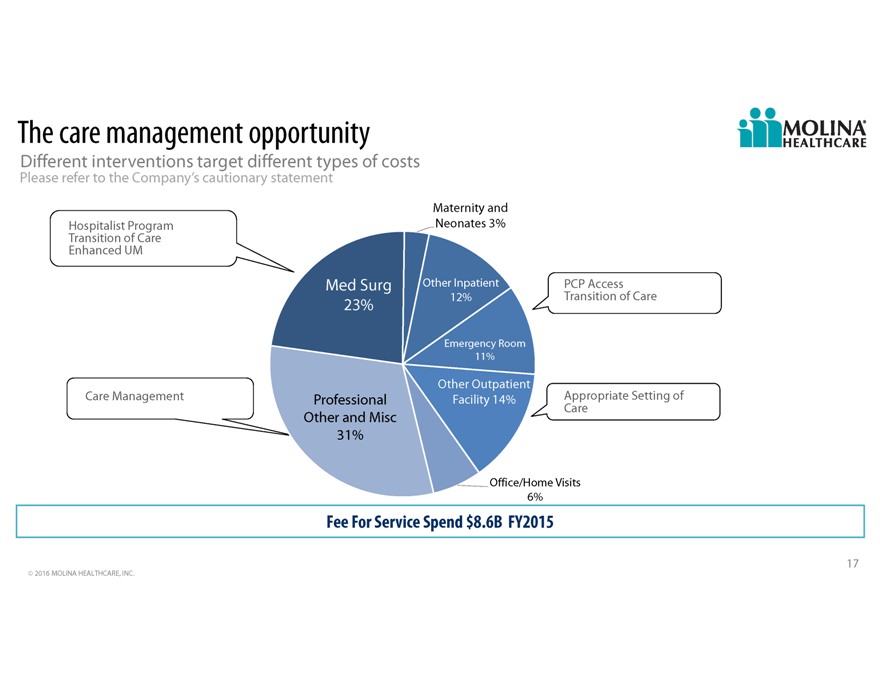
The care
management opportunity Different interventions target different types of costs Please refer to the Companys cautionary statement Maternity and Hospitalist Program Neonates 3% Transition of Care Enhanced UM Med Surg Other Inpatient PCP Access 12%
Transition of Care 23% Emergency Room 11% Other Outpatient Care Management Professional Facility 14% Appropriate Setting of Care Other and Misc 31% Office/Home Visits 6% Fee For Service Spend $8.6B FY2015 17 2016 MOLINA HEALTHCARE, INC.
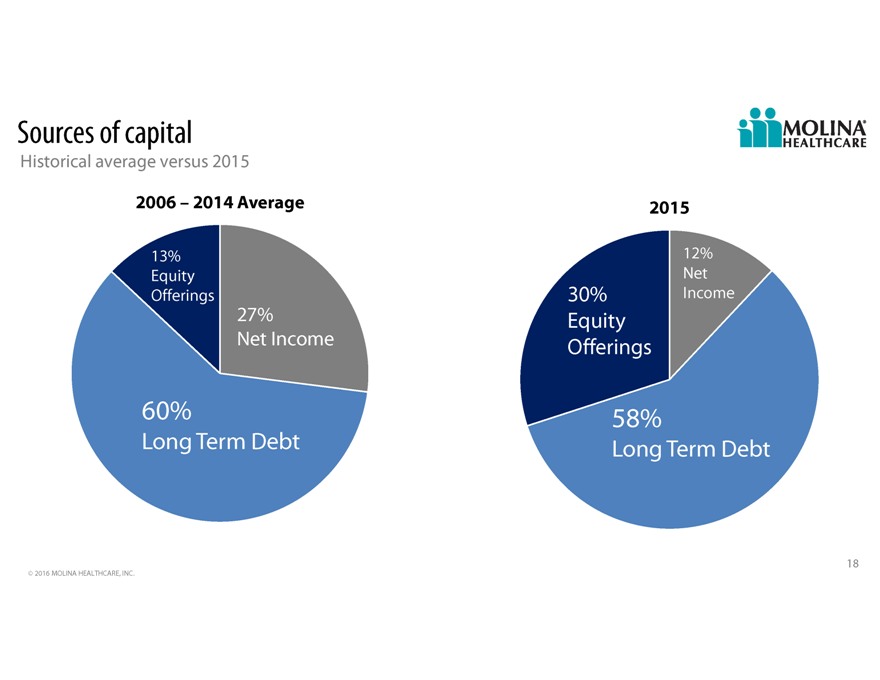
Sources of
capital Historical average versus 2015 2006 2014 Average 2015 13% 12% Equity Net Offerings 30% Income 27% Equity Net Income Offerings 60% 58% Long Term Debt Long Term Debt 18 2016 MOLINA HEALTHCARE, INC.
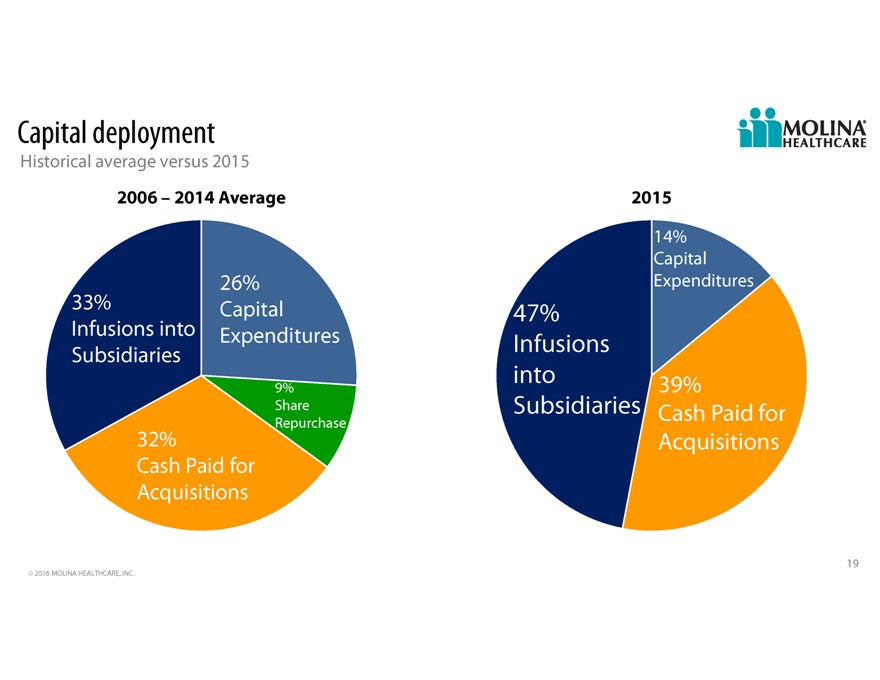
Capital
deployment Historical average versus 2015 2006 2014 Average 2015 14% Capital 26% Expenditures 33% Capital 47% Infusions into Subsidiaries Expenditures Infusions into 9% 39% Share Subsidiaries Cash Paid for Repurchase 32% Acquisitions Cash Paid for
Acquisitions 19 2016 MOLINA HEALTHCARE, INC.
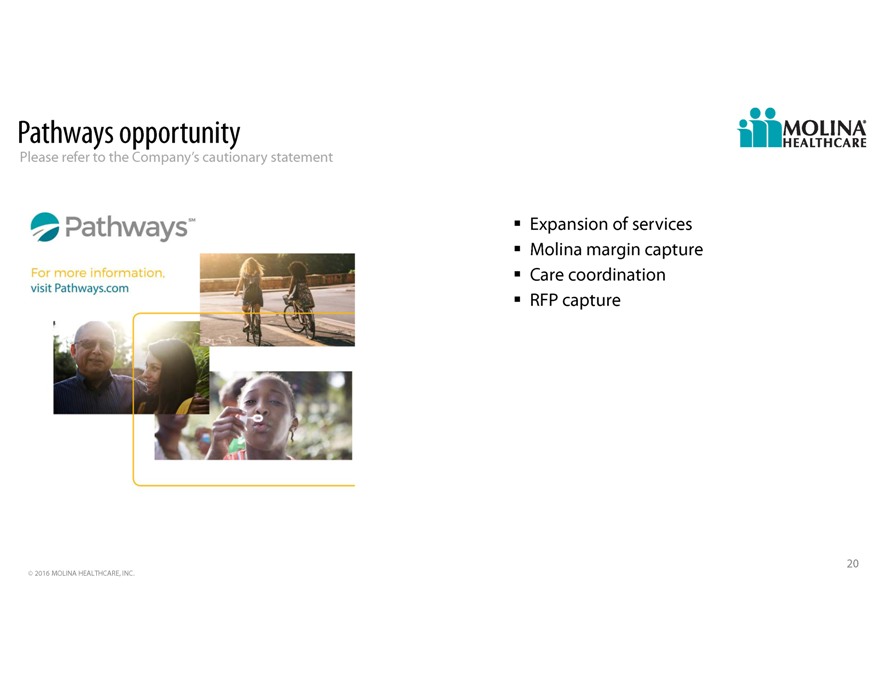
Pathways
opportunity Please refer to the Companys cautionary statement Expansion of services Molina margin capture Care coordination RFP capture 20 2016 MOLINA HEALTHCARE, INC.

Q&A 21
Supplemental 22 2016 MOLINA HEALTHCARE, INC.
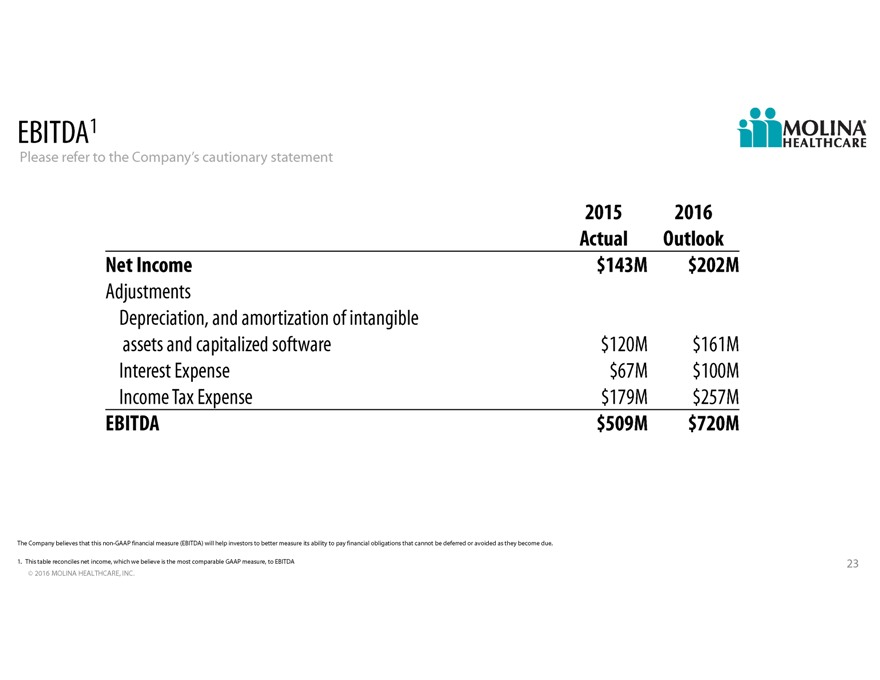
EBITDA1
Please refer to the Companys cautionary statement 2015 2016 Actual Outlook Net Income $143M $202M Adjustments Depreciation, and amortization of intangible assets and capitalized software $120M $161M Interest Expense $67M $100M Income Tax Expense
$179M $257M EBITDA $509M $720M The Company believes that this non-GAAP financial measure (EBITDA) will help investors to better measure its ability to pay financial obligations that cannot be deferred or avoided as they become due. 1. This table
reconciles net income, which we believe is the most comparable GAAP measure, to EBITDA 23 2016 MOLINA HEALTHCARE, INC.
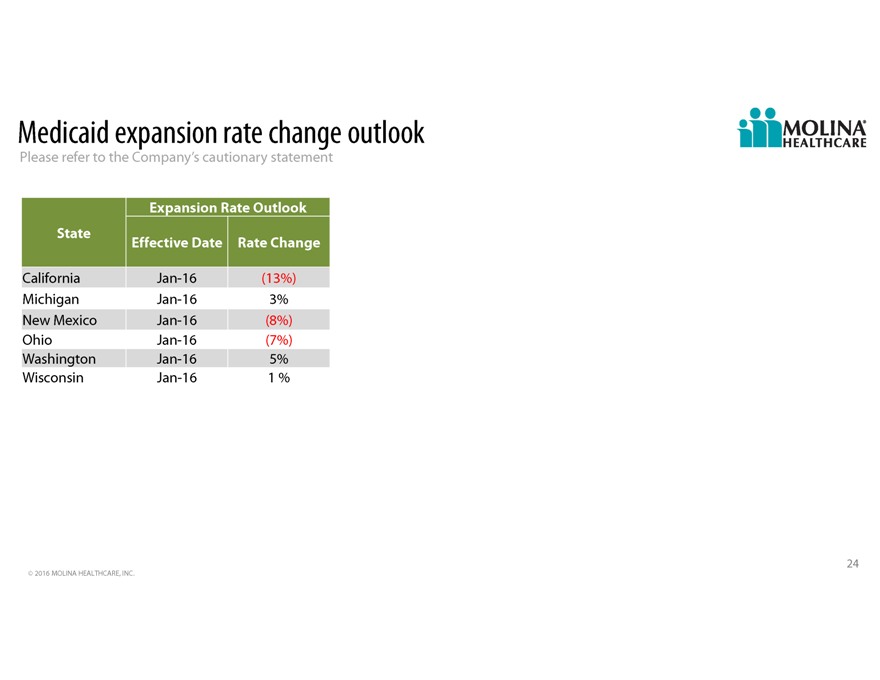
Medicaid
expansion rate change outlook Please refer to the Companys cautionary statement Expansion Rate Outlook State Effective Date Rate Change California Jan-16(13%) Michigan Jan-16 3% New Mexico Jan-16(8%) Ohio Jan-16(7%) Washington Jan-16 5% Wisconsin
Jan-16 1 % 24 2016 MOLINA HEALTHCARE, INC.
Molina Healthcare (NYSE:MOH)
Historical Stock Chart
From Mar 2024 to Apr 2024

Molina Healthcare (NYSE:MOH)
Historical Stock Chart
From Apr 2023 to Apr 2024
