UNITED STATES
SECURITIES AND EXCHANGE COMMISSION
Washington, D.C. 20549
FORM 8-K
Current Report Pursuant
to Section 13 OR 15(d) of The
Securities Exchange Act of 1934
Date of Report (Date of earliest event reported):
February 23, 2016
| LEXINGTON REALTY TRUST |
| (Exact name of registrant as specified in its charter) |
| |
|
|
| Maryland |
1-12386 |
13-3717318 |
|
(State or other jurisdiction
of incorporation) |
(Commission File Number) |
(IRS Employer
Identification No.) |
| One Penn Plaza, Suite 4015, New York, New York |
10119-4015 |
| (Address of principal executive offices) |
(Zip Code) |
(212) 692-7200
(Registrant's telephone number, including
area code)
(Former name
or former address, if changed since last report)
Check the appropriate box below if the Form 8-K filing is intended
to simultaneously satisfy the filing obligation of the registrant under any of the following provisions (see General Instruction
A.2.):
| ¨ | Written communications pursuant to Rule 425 under the
Securities Act (17 CFR 230.425) |
| ¨ | Soliciting material pursuant to Rule 14a-12 under the
Exchange Act (17 CFR 240.14a-12) |
| ¨ | Pre-commencement communications pursuant to Rule 14d-2(b) under the Exchange Act (17 CFR 240.14d-2(b)) |
| ¨ | Pre-commencement communications pursuant to Rule 13e-4(c) under the Exchange Act (17 CFR 240.13e-4(c)) |
| Item 2.02. | Results of Operations and Financial Condition. |
On February 23, 2016, we issued a press
release announcing our financial results for the quarter ended December 31, 2015. A copy of the press release is furnished herewith
as part of Exhibit 99.1.
The information furnished pursuant to this
“Item 2.02 - Results of Operations and Financial Condition”, including Exhibit 99.1, shall not be deemed to be “filed”
for the purposes of Section 18 of the Securities Exchange Act of 1934, as amended, which we refer to as the Exchange Act, or otherwise
subject to the liabilities of that section, and shall not be deemed to be incorporated by reference into any filing made by us
under the Exchange Act or Securities Act of 1933, as amended, which we refer to as the Securities Act, regardless of any general
incorporation language in any such filing, except as shall be expressly set forth by specific reference in such a filing.
| Item 7.01. | Regulation FD Disclosure. |
On February 23, 2016, we made available
supplemental information, which we refer to as the Quarterly Earnings and Supplemental Operating and Financial Data, December 31,
2015, a copy of which is furnished herewith as Exhibit 99.1.
Also on February 23, 2016, our management
discussed our financial results and certain aspects of our business plan on a conference call with analysts and investors. A transcript
of the conference call is furnished herewith as Exhibit 99.2.
On February 24, 2016, we made available
a presentation entitled “Lexington Realty Trust, Investor Presentation, February 2016” on the “Investor Relations”
section of our web site (www.LXP.com). A copy of the presentation is furnished as Exhibit 99.3
to this Current Report and is incorporated herein by reference solely for purposes of this Item 7.01 disclosure.
The information furnished pursuant to this
“Item 7.01 - Regulation FD Disclosure”, including Exhibit 99.1, Exhibit 99.2 and Exhibit 99.3, shall not be deemed
to be “filed” for the purposes of Section 18 of the Exchange Act or otherwise subject to the liabilities of that section,
and shall not be deemed to be incorporated by reference into any filing made by us under the Exchange Act or the Securities Act,
regardless of any general incorporation language in any such filing, except as shall be expressly set forth by specific reference
in such a filing. Information contained on our web site is not incorporated by reference into this Current Report on Form 8-K.
| Item 9.01. | Financial Statements and Exhibits. |
| 99.1 |
Quarterly Earnings and Supplemental Operating and Financial Data, December 31, 2015. |
| 99.2 |
February 23, 2016 Conference Call Transcript. |
| 99.3 |
Lexington Realty Trust, Investor Presentation, February 2016 |
SIGNATURES
Pursuant to the requirements of the Securities
Exchange Act of 1934, the registrant has duly caused this report to be signed on its behalf by the undersigned hereunto duly authorized.
| |
Lexington Realty Trust |
|
| |
|
|
|
| |
|
|
|
| Date: February 24, 2016 |
By: |
/s/ Patrick Carroll |
|
| |
|
Patrick Carroll |
|
| |
|
Chief Financial Officer |
|
Exhibit Index
| 99.1 |
Quarterly Earnings and Supplemental Operating and Financial Data, December 31, 2015. |
| 99.2 |
February 23, 2016 Conference Call Transcript. |
| 99.3 |
Lexington Realty Trust, Investor Presentation, February 2016 |
Exhibit 99.1

Quarterly
Earnings and
Supplemental
Operating and Financial Data
December
31, 2015

LEXINGTON
REALTY TRUST
SUPPLEMENTAL
REPORTING PACKAGE
December 31,
2015
Table of
Contents
| Section |
|
Page |
| |
|
|
| Fourth Quarter 2015 Earnings Press Release |
|
3 |
| |
|
|
| Portfolio Data |
|
|
| 2015 Fourth Quarter Investment/Capital Recycling Summary |
|
13 |
| Build-To-Suit Projects/Forward Commitments |
|
14 |
| 2015 Fourth Quarter Financing Summary |
|
15 |
| 2015 Fourth Quarter Leasing Summary |
|
16 |
| Other Revenue Data |
|
17 |
| Portfolio Detail By Asset Class |
|
19 |
| Portfolio Composition |
|
20 |
| Components of Net Asset Value |
|
21 |
| Top Markets |
|
22 |
| Single-Tenant Office Markets |
|
23 |
| Tenant Industry Diversification |
|
24 |
| Top 10 Tenants or Guarantors |
|
25 |
| Lease Rollover Schedules – GAAP Basis |
|
26 |
| Property Leases and Vacancies – Consolidated Portfolio |
|
28 |
| Select Credit Metrics Summary |
|
36 |
| Financial Covenants |
|
37 |
| Mortgages and Notes Payable |
|
38 |
| Debt Maturity Schedule |
|
41 |
| Mortgage Loans Receivable |
|
42 |
| Partnership Interests |
|
43 |
| Selected Balance Sheet and Income Statement Account Data |
|
44 |
| Investor Information |
|
45 |
This Quarterly
Earnings Release and Supplemental Reporting Package contains certain forward-looking statements which involve known and unknown
risks, uncertainties or other factors not under the control of Lexington Realty Trust “Lexington”, which may cause
actual results, performance or achievements of Lexington to be materially different from the results, performance, or other expectations
implied by these forward-looking statements. Factors that could cause or contribute to such differences include, but are not limited
to, those discussed under the headings “Management’s Discussion and Analysis of Financial Condition and Results of
Operations” and “Risk Factors” in Lexington’s periodic reports filed with the Securities and Exchange
Commission, including risks related to: (1) the authorization of Lexington’s Board of Trustees of future dividend declarations,
(2) Lexington’s ability to achieve its estimate of Company FFO for the year ending December 31, 2016, (3) the successful
consummation of any lease, acquisition, build-to-suit, disposition, financing or other transaction, (4) the failure to continue
to qualify as a real estate investment trust, (5) changes in general business and economic conditions, including the impact of
any new legislation, (6) competition, (7) increases in real estate construction costs, (8) changes in interest rates, (9) changes
in accessibility of debt and equity capital markets, and (10) future impairment charges. Copies of the periodic reports Lexington
files with the Securities and Exchange Commission are available on Lexington’s web site at www.lxp.com. Forward-looking
statements, which are based on certain assumptions and describe Lexington’s future plans, strategies and expectations, are
generally identifiable by use of the words “believes,” “expects,” “intends,” “anticipates,”
“estimates,” “projects,” may,” “plans,” “predicts,” “will,”
“will likely result,” “is optimistic,” “goal,” “objective” or similar expressions.
Except as required by law, Lexington undertakes no obligation to publicly release the results of any revisions to those forward-looking
statements which may be made to reflect events or circumstances after the occurrence of unanticipated events. Accordingly, there
is no assurance that Lexington’s expectations will be realized.
| |
LEXINGTON
REALTY
TRUST |
| |
TRADED: NYSE: LXP |
| |
ONE
PENN PLAZA, SUITE
4015 |
| |
NEW
YORK, NY 10119-4015 |
FOR
IMMEDIATE RELEASE
LEXINGTON
REALTY TRUST REPORTS FOURTH QUARTER 2015 RESULTS
New York,
NY - Tuesday, February 23, 2016 - Lexington Realty Trust (“Lexington”) (NYSE:LXP), a real estate investment trust
focused on single-tenant real estate investments, today announced results for the fourth quarter ended December 31, 2015.
Fourth Quarter 2015 Highlights
| • | Generated
Company Funds From Operations (“Company FFO”) of $69.6 million, or $0.29
per diluted common share. |
| • | Acquired/completed two build-to-suit
properties for an aggregate initial basis of $253.5 million. |
| • | Invested
$45.4 million in on-going build-to-suit projects and commenced funding an office build-to-suit
project for $62.4 million. |
| • | Completed
0.9 million square feet of new leases and lease extensions with overall portfolio 96.8%
leased at quarter end. |
| • | Obtained
$110.0 million 10-year non-recourse financing, which bears interest at a 4.0% fixed interest
rate and is secured by the Richland, Washington property. |
| • | Repurchased 0.9 million
common shares at an average price of $8.12 per share. |
Full Year 2015 Highlights
| • | Generated Company FFO of
$268.0 million, or $1.10 per diluted common share. |
| • | Acquired/completed nine
properties for an aggregate initial basis of $483.0 million. |
| • | Disposed of nine properties
for gross proceeds of $265.2 million. |
| • | Completed 4.0 million square
feet of new leases and lease extensions. |
| • | Refinanced
$616 million of debt, extended weighted-average maturity to 7.2 years and lowered average
borrowing cost by 50 bps to 4.01%. |
| • | Repurchased over 2.2 million
common shares at an average price of $8.29 per share. |
Subsequent Events
| • | Acquired one industrial
property for $29.7 million. |
| • | Renewed 0.7 million square
feet of leases. |
| • | Closed
on $57.5 million, 15-year, 5.2% fixed rate mortgage on newly-constructed Gateway Plaza
property in Richmond, Virginia. |
| • | Repurchased approximately
1.0 million common shares at an average price of $7.48 per share. |
T.
Wilson Eglin, President and Chief Executive Officer of Lexington, stated “We finished off 2015 on a strong note with good
execution in all aspects of our business. During the quarter we closed on two substantial build-to-suit transactions for
$253 million and subsequently obtained favorable financing on both, bringing our total acquisitions for the year to $483 million
at an average cap rate of 7.4%. At year end, our overall portfolio was 96.8% leased as leasing volume remained strong at nearly
one million square feet during the fourth quarter of 2015. We continue to believe our own shares represent an uncommon value and
continued to execute on our share repurchase plan in the fourth quarter and into 2016.”
Mr.
Eglin added, “In 2015, we executed a highly successful capital recycling program and disposed of $265 million of properties
at an average cap rate of 6.3%. We expect our disposition volume in 2016 will be even more robust as we look to monetize our New
York City land investments and certain other properties. The proceeds will be used primarily to fund new build-to-suit projects,
retire short-term debt, and repurchase common shares. We have made good progress on leasing as we begin 2016, extending 700,000
square feet of leases to date. Elevated leasing velocity and investment volume have produced high levels of occupancy, balanced
lease expirations and a longer weighted-average lease term with more secure cash flow. As a result, we expect underlying cash
flows to remain strong in 2016. ”
FINANCIAL RESULTS
Revenues
For the quarter
ended December 31, 2015, total gross revenues were $106.6 million, a 1.1% decrease compared with total gross revenues of $107.8
million for the quarter ended December 31, 2014. The decrease is primarily due to 2015 property sales and lease expirations, partially
offset by revenue generated from property acquisitions and new leases signed.
Company FFO
For the quarter
ended December 31, 2015, Lexington generated Company FFO of $69.6 million, or $0.29 per diluted share, compared to Company FFO
for the quarter ended December 31, 2014 of $66.3 million, or $0.27 per diluted share. The calculation of Company FFO and a reconciliation
to net income attributable to common shareholders is included later in this press release.
Dividends/Distributions
Lexington declared
a regular quarterly common share/unit dividend/distribution for the quarter ended December 31, 2015 of $0.17 per common share/unit,
which was paid on January 15, 2016 to common shareholders/unitholders of record as of December 31, 2015. Lexington also declared
a dividend of $0.8125 per share on its Series C Cumulative Convertible Preferred Stock (“Series C Preferred Shares”),
which is payable on May 16, 2016 to Series C Preferred Shareholders of record as of April 29, 2016.
Net Income Attributable to Common
Shareholders
For the quarter
ended December 31, 2015, net income attributable to common shareholders was $33.2 million, or $0.14 per diluted share, compared
with net income attributable to common shareholders for the quarter ended December 31, 2014 of $35.7 million, or $0.15 per diluted
share.
OPERATING ACTIVITIES
During the
quarter ended December 31, 2015, Lexington completed the following build-to-suit projects:
COMPLETED BUILD-TO-SUIT PROJECTS
| Primary Tenant | |
Location | |
Property Type | |
Initial
Basis
($000) | | |
Initial
Annualized Cash
Rent ($000) | | |
Initial Cash Yield | | |
Estimated GAAP Yield | | |
Lease Term
(Yrs) |
| | |
| |
| |
| | |
| | |
| | |
| | |
|
| Preferred Freezer Services of Richland
LLC(1) | |
Richland, WA | |
Industrial | |
$ | 152,000 | | |
$ | 10,792 | | |
| 7.1 | % | |
| 8.6 | % | |
20 |
| McGuireWoods LLP(2) | |
Richmond,
VA | |
Office | |
| 101,489 | | |
| 8,701 | | |
| 8.2 | % | |
| 9.0 | % | |
15 |
| | |
| |
| |
$ | 253,489 | | |
$ | 19,493 | | |
| 7.6 | % | |
| 8.8 | % | |
|
| 1. | ConAgra
Foods, Inc. provides credit support. Guarantors are Preferred Freezer Services LLC and
Preferred Freezer Services Operating LLC. |
| 2. | Property
is 100% leased. McGuireWoods LLP is primary tenant with 68% of the space. Initial basis
does not include $8.1 million for estimated earnout lease payments for developer leased
space. Initial yields include $4.0 million of earnout lease payments earned but not yet
paid as of December 31, 2015. |
Lexington funded
$45.4 million of the projected costs of the following projects:
ON-GOING BUILD-TO-SUIT PROJECTS
| Location | |
Sq.
Ft. | | |
Property
Type | |
Lease Term (Years) | | |
Maximum
Commitment/
Estimated
Completion
Cost
($000) | | |
GAAP
Investment
Balance as
of
12/31/2015
($000) | | |
Estimated Acquisition/ Completion Date | |
Estimated Initial Cash Yield | | |
Estimated GAAP Yield | |
| Anderson, SC | |
| 1,325,000 | | |
Industrial | |
| 20 | | |
$ | 70,012 | | |
$ | 23,826 | | |
2Q 16 | |
| 5.9 | % | |
| 7.3 | % |
| Lake Jackson, TX | |
| 664,000 | | |
Office | |
| 20 | | |
| 166,164 | | |
| 62,353 | | |
4Q 16 | |
| 7.3 | % | |
| 8.9 | % |
| Charlotte, NC | |
| 201,000 | | |
Office | |
| 15 | | |
| 62,445 | | |
| 9,223 | | |
1Q 17 | |
| 8.3 | % | |
| 9.5 | % |
| Houston, TX(1) | |
| 274,000 | | |
Retail/Specialty | |
| 20 | | |
| 86,491 | | |
| 38,367 | | |
3Q 16 | |
| 7.5 | % | |
| 7.5 | % |
| | |
| 2,464,000 | | |
| |
| | | |
$ | 385,112 | | |
$ | 133,769 | | |
| |
| | | |
| | |
| 1. | Lexington
has a 25% interest as of December 31, 2015. Lexington is providing construction financing
up to $56.7 million to the joint venture of which $8.5 million has been funded as of
December 31, 2015. Lease contains annual CPI increases. |
In addition,
Lexington was committed to acquire, and subsequently acquired in January 2016, the following property:
FORWARD COMMITMENT
| Location | |
Property Type | |
Estimated Acquisition
Cost ($000) | | |
Acquisition
Date | |
Estimated Initial Cash
Yield | | |
Estimated GAAP Yield | | |
Lease Term (Years) |
| Detroit, MI | |
Industrial | |
$ | 29,680 | | |
1Q 16 | |
| 7.4 | % | |
| 7.4 | % | |
20 |
PROPERTY DISPOSITIONS
| Tenant | |
Location | |
Property Type | |
Gross
Disposition Price ($000) | | |
Annualized NOI ($000) | | |
Month
of Disposition |
| Vacant(1) | |
Rochester,
NY | |
Office | |
$ | 17,234 | | |
$ | — | | |
December |
| 1. | Conveyed
in foreclosure. |
LEASING
As of December
31, 2015, Lexington's portfolio was 96.8% leased, excluding a property subject to a mortgage in default.
During the
fourth quarter of 2015, Lexington executed the following new and extended leases:
| | |
LEASE EXTENSIONS | |
| |
| |
| | |
| |
| |
| |
| |
| |
| |
| | |
Location | |
Primary
Tenant(1) | |
Prior Term | |
Lease Expiration
Date | |
Sq.
Ft. | |
| | |
Office/Multi-Tenant | |
| |
| |
| |
| |
| | |
| 1-3 | |
Various | |
HI | |
N/A | |
2015 | |
2016-2018 | |
| 886 | |
| 3 | |
Total office
lease extensions | |
| |
| |
| |
| |
| 886 | |
| | |
| |
| |
| |
| |
| |
| | |
| | |
Industrial | |
| |
| |
| |
| |
| | |
| 1 | |
Rockford | |
IL | |
Jacobson Warehouse Company, Inc. | |
12/2015 | |
12/2018 | |
| 150,000 | |
| 2 | |
Olive Branch | |
MS | |
MAHLE Aftermarket Inc. | |
02/2016 | |
02/2023 | |
| 268,104 | |
| 2 | |
Total industrial
lease extensions | |
| |
| |
| |
| |
| 418,104 | |
| | |
| |
| |
| |
| |
| |
| | |
| 5 | |
Total lease
extensions | |
| |
| |
| |
| |
| 418,990 | |
| | |
NEW LEASES | |
| |
| |
| |
| |
| | |
| |
| |
| |
| |
| |
| | |
Location | |
| |
Lease
Expiration Date | |
Sq.
Ft. | |
| | |
Office/Multi-Tenant | |
| |
| |
| |
| | |
| 1 | |
Westlake | |
TX | |
Charles Schwab & Co., Inc. | |
06/2021 | |
| 130,199 | |
| 2 | |
Florence | |
SC | |
United States of America | |
01/2016 | |
| 12,851 | |
| 3 | |
Farmers Branch | |
TX | |
International Business Machines Corporation | |
04/2021 | |
| 66,018 | |
| 4 | |
Honolulu | |
HI | |
N/A | |
12/2017 | |
| 379 | |
| 4 | |
Total
new office leases | |
| |
| |
| |
| 209,447 | |
| | |
| |
| |
| |
| |
| | |
| | |
Industrial | |
| |
| |
| |
| | |
| 1 | |
McDonough | |
GA | |
United States Cold Storage,
Inc. | |
08/2028 | |
| 296,972 | |
| 1 | |
Total
new industrial leases | |
| |
| |
| |
| 296,972 | |
| | |
| |
| |
| |
| |
| | |
| 5 | |
Total
new leases | |
| |
| |
| |
| 506,419 | |
| | |
| |
| |
| |
| |
| | |
| 10 | |
TOTAL
NEW AND EXTENDED LEASES | |
| |
| |
| |
| 925,409 | |
| (1) | Leases greater than 10,000 square feet. |
BALANCE
SHEET/CAPITAL MARKETS
In December
2015, Lexington financed its industrial property in Richland, Washington with a $110.0 million non-recourse secured mortgage.
The loan bears interest at a fixed rate of 4.0% and matures in 2026.
During 2015,
Lexington announced a 10.0 million common share repurchase authorization. In the fourth quarter of 2015, Lexington repurchased
910,499 common shares at an average price of $8.12 per share, bringing the total common shares repurchased in 2015 to 2,216,799
common shares at an average price of $8.29 per share.
In 2016, Lexington acquired an additional
951,792 common shares at an average price of $7.48 per share. To date, we have repurchased a total of 3.2 million shares at an
average share price of $8.05 per share
2016
EARNINGS GUIDANCE
Lexington is
estimating that its Company FFO guidance for the year ended December 31, 2016 would be within the range of $1.00 to $1.10 per
diluted share. This guidance is forward looking, excludes the impact of certain items and is based on current expectations.
FOURTH
QUARTER 2015 CONFERENCE CALL
Lexington will
host a conference call today, Tuesday, February 23, 2016, at 11:00 a.m. Eastern Time, to discuss its results for the quarter ended
December 31, 2015. Interested parties may participate in this conference call by dialing 877-407-0789 or 201-689-8562. A replay
of the call will be available through March 8, 2016, at 877-870-5176 or 858-384-5517, pin: 13629156. A live webcast of the conference
call will be available at www.lxp.com within the Investors section.
ABOUT
LEXINGTON REALTY TRUST
Lexington Realty
Trust is a real estate investment trust that owns a diversified portfolio of equity and debt interests in single-tenant commercial
properties and land. Lexington seeks to expand its portfolio through acquisitions, sale-leaseback transactions, build-to-suit
arrangements and other transactions. A majority of these properties and all land interests are subject to net or similar leases,
where the tenant bears all or substantially all of the operating costs, including cost increases, for real estate taxes, utilities,
insurance and ordinary repairs. Lexington also provides investment advisory and asset management services to investors in the
single-tenant area. Lexington common shares are traded on the New York Stock Exchange under the symbol “LXP”. Additional
information about Lexington is available on-line at www.lxp.com or by contacting Lexington Realty Trust, One Penn Plaza,
Suite 4015, New York, New York 10119-4015, Attention: Investor Relations.
Contact:
Investor or Media Inquiries for
Lexington Realty Trust:
Heather Gentry, Senior Vice President
of Investor Relations
Lexington Realty Trust
Phone: (212) 692-7200 E-mail: hgentry@lxp.com
This release
contains certain forward-looking statements which involve known and unknown risks, uncertainties or other factors not under Lexington's
control which may cause actual results, performance or achievements of Lexington to be materially different from the results,
performance, or other expectations implied by these forward-looking statements. Factors that could cause or contribute to such
differences include, but are not limited to, those discussed under the headings “Management's Discussion and Analysis of
Financial Condition and Results of Operations” and “Risk Factors” in Lexington's periodic reports filed with
the Securities and Exchange Commission, including risks related to: (1) the authorization by Lexington's Board of Trustees of
future dividend declarations, (2) Lexington's ability to achieve its estimate of Company FFO, as adjusted, for the year ending
December 31, 2016, (3) the successful consummation of any lease, acquisition, build-to-suit, disposition, financing or other transaction,
(4) the failure to continue to qualify as a real estate investment trust, (5) changes in general business and economic conditions,
including the impact of any legislation, (6) competition, (7) increases in real estate construction costs, (8) changes in interest
rates, (9) changes in accessibility of debt and equity capital markets, and (10) future impairment charges. Copies of the periodic
reports Lexington files with the Securities and Exchange Commission are available on Lexington's web site at www.lxp.com.
Forward-looking statements, which are based on certain assumptions and describe Lexington's future plans, strategies and expectations,
are generally identifiable by use of the words “believes,” “expects,” “intends,” “anticipates,”
“estimates,” “projects”, “may,” “plans,” “predicts,” “will,”
“will likely result,” “is optimistic,” “goal,” “objective” or similar expressions.
Except as required by law, Lexington undertakes no obligation to publicly release the results of any revisions to those forward-looking
statements which may be made to reflect events or circumstances after the occurrence of unanticipated events. Accordingly, there
is no assurance that Lexington's expectations will be realized.
References
to Lexington refer to Lexington Realty Trust and its consolidated subsidiaries. All interests in properties and loans are held
through special purpose entities, which are separate and distinct legal entities, some of which are consolidated for financial
statement purposes and/or disregarded for income tax purposes.
LEXINGTON
REALTY TRUST AND CONSOLIDATED SUBSIDIARIES
CONDENSED
CONSOLIDATED STATEMENTS OF OPERATIONS
(Unaudited
and in thousands, except share and per share data)
| | |
Three months
ended December 31, | | |
Twelve months
ended December 31, | |
| | |
2015 | | |
2014 | | |
2015 | | |
2014 | |
| Gross revenues: | |
| | | |
| | | |
| | | |
| | |
| Rental | |
$ | 98,934 | | |
$ | 99,610 | | |
$ | 399,485 | | |
$ | 392,480 | |
| Tenant reimbursements | |
| 7,692 | | |
| 8,173 | | |
| 31,354 | | |
| 31,338 | |
| Total gross revenues | |
| 106,626 | | |
| 107,783 | | |
| 430,839 | | |
| 423,818 | |
| Expense applicable to revenues: | |
| | | |
| | | |
| | | |
| | |
| Depreciation and amortization | |
| (41,403 | ) | |
| (40,105 | ) | |
| (163,198 | ) | |
| (154,837 | ) |
| Property operating | |
| (14,055 | ) | |
| (17,039 | ) | |
| (59,655 | ) | |
| (63,673 | ) |
| General and administrative | |
| (6,750 | ) | |
| (7,221 | ) | |
| (29,276 | ) | |
| (28,255 | ) |
| Non-operating income | |
| 3,216 | | |
| 4,136 | | |
| 11,429 | | |
| 14,505 | |
| Interest and amortization expense | |
| (21,466 | ) | |
| (23,847 | ) | |
| (89,739 | ) | |
| (97,303 | ) |
| Gains on sales of financial assets, net | |
| — | | |
| 855 | | |
| — | | |
| 855 | |
| Debt satisfaction gains (charges), net | |
| 11,397 | | |
| (1,505 | ) | |
| 25,150 | | |
| (9,452 | ) |
| Impairment charges and loan loss | |
| (2,762 | ) | |
| (18,469 | ) | |
| (36,832 | ) | |
| (37,333 | ) |
| Gains on sales of properties | |
| — | | |
| — | | |
| 23,307 | | |
| — | |
| Income before provision for income taxes, equity in earnings of non-consolidated
entities and discontinued operations | |
| 34,803 | | |
| 4,588 | | |
| 112,025 | | |
| 48,325 | |
| Provision for income taxes | |
| (104 | ) | |
| (162 | ) | |
| (568 | ) | |
| (1,109 | ) |
| Equity in earnings of non-consolidated entities | |
| 814 | | |
| 380 | | |
| 1,752 | | |
| 626 | |
| Income from continuing operations | |
| 35,513 | | |
| 4,806 | | |
| 113,209 | | |
| 47,842 | |
| Discontinued operations: | |
| | | |
| | | |
| | | |
| | |
| Income from discontinued operations | |
| — | | |
| 651 | | |
| 109 | | |
| 6,252 | |
| Provision for income taxes | |
| — | | |
| (8 | ) | |
| (4 | ) | |
| (59 | ) |
| Debt satisfaction charges, net | |
| — | | |
| (14 | ) | |
| — | | |
| (312 | ) |
| Gains on sales of properties | |
| — | | |
| 35,455 | | |
| 1,577 | | |
| 57,507 | |
| Impairment charges | |
| — | | |
| (2,705 | ) | |
| — | | |
| (13,767 | ) |
| Total discontinued operations | |
| — | | |
| 33,379 | | |
| 1,682 | | |
| 49,621 | |
| Net income | |
| 35,513 | | |
| 38,185 | | |
| 114,891 | | |
| 97,463 | |
| Less net income attributable
to noncontrolling interests | |
| (663 | ) | |
| (822 | ) | |
| (3,188 | ) | |
| (4,359 | ) |
| Net income attributable to Lexington Realty Trust shareholders | |
| 34,850 | | |
| 37,363 | | |
| 111,703 | | |
| 93,104 | |
| Dividends attributable to preferred shares – Series C | |
| (1,572 | ) | |
| (1,572 | ) | |
| (6,290 | ) | |
| (6,290 | ) |
| Allocation to participating securities | |
| (49 | ) | |
| (91 | ) | |
| (313 | ) | |
| (490 | ) |
| Net income attributable to common shareholders | |
$ | 33,229 | | |
$ | 35,700 | | |
$ | 105,100 | | |
$ | 86,324 | |
| Income per common share – basic: | |
| | | |
| | | |
| | | |
| | |
| Income from continuing operations | |
$ | 0.14 | | |
$ | 0.01 | | |
$ | 0.44 | | |
$ | 0.17 | |
| Income from discontinued
operations | |
| — | | |
| 0.14 | | |
| 0.01 | | |
| 0.21 | |
| Net income attributable
to common shareholders | |
$ | 0.14 | | |
$ | 0.15 | | |
$ | 0.45 | | |
$ | 0.38 | |
| Weighted-average
common shares outstanding – basic | |
| 233,448,100 | | |
| 230,830,905 | | |
| 233,455,056 | | |
| 228,966,253 | |
| Income per common share – diluted: | |
| | | |
| | | |
| | | |
| | |
| Income from continuing operations | |
$ | 0.14 | | |
$ | 0.01 | | |
$ | 0.44 | | |
$ | 0.17 | |
| Income from discontinued
operations | |
| — | | |
| 0.14 | | |
| 0.01 | | |
| 0.21 | |
| Net income attributable
to common shareholders | |
$ | 0.14 | | |
$ | 0.15 | | |
$ | 0.45 | | |
$ | 0.38 | |
| Weighted-average
common shares outstanding – diluted | |
| 239,411,055 | | |
| 231,239,828 | | |
| 233,751,775 | | |
| 229,436,708 | |
| Amounts attributable to common shareholders: | |
| | | |
| | | |
| | | |
| | |
| Income from continuing operations | |
$ | 33,229 | | |
$ | 2,322 | | |
$ | 103,418 | | |
$ | 37,652 | |
| Income from discontinued
operations | |
| — | | |
| 33,378 | | |
| 1,682 | | |
| 48,672 | |
| Net income attributable
to common shareholders | |
$ | 33,229 | | |
$ | 35,700 | | |
$ | 105,100 | | |
$ | 86,324 | |
LEXINGTON
REALTY TRUST AND CONSOLIDATED SUBSIDIARIES
CONDENSED
CONSOLIDATED BALANCE SHEETS
As of December
31,
(Unaudited and
in thousands, except share and per share data)
| | |
2015 | | |
2014 | |
| Assets: | |
| | | |
| | |
| Real estate, at cost | |
$ | 3,789,711 | | |
$ | 3,671,560 | |
| Real estate - intangible assets | |
| 692,778 | | |
| 705,566 | |
| Investments in real estate under construction | |
| 95,402 | | |
| 106,238 | |
| | |
| 4,577,891 | | |
| 4,483,364 | |
| Less: accumulated depreciation and amortization | |
| 1,179,969 | | |
| 1,196,114 | |
| Real estate, net | |
| 3,397,922 | | |
| 3,287,250 | |
| Assets held for sale | |
| 24,425 | | |
| 3,379 | |
| Cash and cash equivalents | |
| 93,249 | | |
| 191,077 | |
| Restricted cash | |
| 10,637 | | |
| 17,379 | |
| Investment in and advances to non-consolidated
entities | |
| 31,054 | | |
| 19,402 | |
| Deferred expenses, net | |
| 63,832 | | |
| 65,860 | |
| Loans receivable, net | |
| 95,871 | | |
| 105,635 | |
| Rent receivable – current | |
| 7,193 | | |
| 6,311 | |
| Rent receivable – deferred | |
| 87,547 | | |
| 61,372 | |
| Other assets | |
| 18,505 | | |
| 20,229 | |
| Total assets | |
$ | 3,830,235 | | |
$ | 3,777,894 | |
| | |
| | | |
| | |
| Liabilities and Equity: | |
| | | |
| | |
| Liabilities: | |
| | | |
| | |
| Mortgages and notes payable | |
$ | 882,952 | | |
$ | 945,216 | |
| Credit facility borrowings | |
| 177,000 | | |
| — | |
| Term loans payable | |
| 505,000 | | |
| 505,000 | |
| Senior notes payable | |
| 497,947 | | |
| 497,675 | |
| Convertible notes payable | |
| 12,180 | | |
| 15,664 | |
| Trust preferred securities | |
| 129,120 | | |
| 129,120 | |
| Dividends payable | |
| 45,440 | | |
| 42,864 | |
| Liabilities held for sale | |
| 8,405 | | |
| 2,843 | |
| Accounts payable and other liabilities | |
| 41,479 | | |
| 37,740 | |
| Accrued interest payable | |
| 8,851 | | |
| 8,301 | |
| Deferred revenue - including below market leases,
net | |
| 42,524 | | |
| 68,215 | |
| Prepaid rent | |
| 16,806 | | |
| 16,336 | |
| Total liabilities | |
| 2,367,704 | | |
| 2,268,974 | |
| | |
| | | |
| | |
| Commitments and contingencies | |
| | | |
| | |
| Equity: | |
| | | |
| | |
| Preferred shares, par value $0.0001 per share;
authorized 100,000,000 shares: | |
| | | |
| | |
| Series C Cumulative Convertible
Preferred, liquidation preference $96,770; 1,935,400 shares issued and outstanding | |
| 94,016 | | |
| 94,016 | |
| Common shares, par value
$0.0001 per share; authorized 400,000,000 shares, 234,575,225 and 233,278,037 shares issued and outstanding in 2015 and 2014,
respectively | |
| 23 | | |
| 23 | |
| Additional paid-in-capital | |
| 2,776,837 | | |
| 2,763,374 | |
| Accumulated distributions in excess of net income
(loss) | |
| (1,428,908 | ) | |
| (1,372,051 | ) |
| Accumulated other comprehensive
income (loss) | |
| (1,939 | ) | |
| 404 | |
| Total shareholders’ equity | |
| 1,440,029 | | |
| 1,485,766 | |
| Noncontrolling interests | |
| 22,502 | | |
| 23,154 | |
| Total equity | |
| 1,462,531 | | |
| 1,508,920 | |
| Total liabilities and equity | |
$ | 3,830,235 | | |
$ | 3,777,894 | |
| LEXINGTON
REALTY TRUST AND CONSOLIDATED SUBSIDIARIES |
| EARNINGS
PER SHARE |
| (Unaudited
and in thousands, except share and per share data) |
| | |
Three Months
Ended
December 31, | | |
Twelve Months
Ended
December 31, | |
| | |
2015 | | |
2014 | | |
2015 | | |
2014 | |
| EARNINGS PER SHARE: | |
| | |
| | |
| | |
| |
| | |
| | |
| | |
| | |
| |
| Basic: | |
| | | |
| | | |
| | | |
| | |
| Income from
continuing operations attributable to common shareholders | |
$ | 33,229 | | |
$ | 2,322 | | |
$ | 103,418 | | |
$ | 37,652 | |
| Income
from discontinued operations attributable to common shareholders | |
| — | | |
| 33,378 | | |
| 1,682 | | |
| 48,672 | |
| Net
income attributable to common shareholders | |
$ | 33,229 | | |
$ | 35,700 | | |
$ | 105,100 | | |
$ | 86,324 | |
| | |
| | | |
| | | |
| | | |
| | |
| Weighted-average
number of common shares outstanding | |
| 233,448,100 | | |
| 230,830,905 | | |
| 233,455,056 | | |
| 228,966,253 | |
| | |
| | | |
| | | |
| | | |
| | |
| Income per common share: | |
| | | |
| | | |
| | | |
| | |
| Income from continuing operations | |
$ | 0.14 | | |
$ | 0.01 | | |
$ | 0.44 | | |
$ | 0.17 | |
| Income from
discontinued operations | |
| — | | |
| 0.14 | | |
| 0.01 | | |
| 0.21 | |
| Net income
attributable to common shareholders | |
$ | 0.14 | | |
$ | 0.15 | | |
$ | 0.45 | | |
$ | 0.38 | |
| | |
| | | |
| | | |
| | | |
| | |
| Diluted: | |
| | | |
| | | |
| | | |
| | |
| Income from continuing operations
attributable to common shareholders - basic | |
$ | 33,229 | | |
$ | 2,322 | | |
$ | 103,418 | | |
$ | 37,652 | |
| Impact of assumed conversions | |
| 711 | | |
| — | | |
| — | | |
| — | |
| Income
from continuing operations attributable to common shareholders | |
| 33,940 | | |
| 2,322 | | |
| 103,418 | | |
| 37,652 | |
| Income from discontinued operations
attributable to common shareholders - basic | |
| — | | |
| 33,378 | | |
| 1,682 | | |
| 48,672 | |
| Impact of assumed conversions | |
| — | | |
| — | | |
| — | | |
| — | |
| Income
from discontinued operations attributable to common shareholders | |
| — | | |
| 33,378 | | |
| 1,682 | | |
| 48,672 | |
| Net income attributable
to common shareholders | |
$ | 33,940 | | |
$ | 35,700 | | |
$ | 105,100 | | |
$ | 86,324 | |
| | |
| | | |
| | | |
| | | |
| | |
| Weighted-average common shares
outstanding - basic | |
| 233,448,100 | | |
| 230,830,905 | | |
| 233,455,056 | | |
| 228,966,253 | |
| Effect of dilutive securities: | |
| | | |
| | | |
| | | |
| | |
| Share options | |
| 220,125 | | |
| 408,923 | | |
| 296,719 | | |
| 470,455 | |
| Operating Partnership Units | |
| 3,834,962 | | |
| — | | |
| — | | |
| — | |
| 6.00% Convertible
Guaranteed Notes | |
| 1,907,868 | | |
| — | | |
| — | | |
| — | |
| Weighted-average
common shares outstanding | |
| 239,411,055 | | |
| 231,239,828 | | |
| 233,751,775 | | |
| 229,436,708 | |
| | |
| | | |
| | | |
| | | |
| | |
| Income per common share: | |
| | | |
| | | |
| | | |
| | |
| Income from continuing operations | |
$ | 0.14 | | |
$ | 0.01 | | |
$ | 0.44 | | |
$ | 0.17 | |
| Income from
discontinued operations | |
| — | | |
| 0.14 | | |
| 0.01 | | |
| 0.21 | |
| Net income
attributable to common shareholders | |
$ | 0.14 | | |
$ | 0.15 | | |
$ | 0.45 | | |
$ | 0.38 | |
| LEXINGTON
REALTY TRUST AND CONSOLIDATED SUBSIDIARIES |
| COMPANY
FUNDS FROM OPERATIONS & FUNDS AVAILABLE FOR DISTRIBUTION |
| (Unaudited
and in thousands, except share and per share data) |
| | |
Three Months
Ended
December 31, | | |
Twelve Months
Ended
December 31, | |
| | |
2015 | | |
2014 | | |
2015 | | |
2014 | |
| FUNDS
FROM OPERATIONS: (1) | |
| | | |
| | | |
| | | |
| | |
| Basic and
Diluted: | |
| | | |
| | | |
| | | |
| | |
| Net income attributable
to common shareholders | |
$ | 33,229 | | |
$ | 35,700 | | |
$ | 105,100 | | |
$ | 86,324 | |
| Adjustments: | |
| | | |
| | | |
| | | |
| | |
| Depreciation and amortization | |
| 39,708 | | |
| 39,546 | | |
| 157,644 | | |
| 157,537 | |
| Impairment charges - real estate,
including non-consolidated entities | |
| 2,762 | | |
| 18,673 | | |
| 36,832 | | |
| 49,529 | |
| Noncontrolling interests - OP
units | |
| 457 | | |
| 434 | | |
| 1,999 | | |
| 2,990 | |
| Amortization of leasing commissions | |
| 1,695 | | |
| 1,426 | | |
| 5,554 | | |
| 5,932 | |
| Joint venture and noncontrolling
interest adjustment | |
| 453 | | |
| 335 | | |
| 1,788 | | |
| 2,068 | |
| Gains on
sales of properties, including non-consolidated entities | |
| (487 | ) | |
| (36,374 | ) | |
| (25,371 | ) | |
| (58,426 | ) |
| FFO available
to common shareholders and unitholders - basic | |
| 77,817 | | |
| 59,740 | | |
| 283,546 | | |
| 245,954 | |
| Preferred dividends | |
| 1,572 | | |
| 1,572 | | |
| 6,290 | | |
| 6,290 | |
| Interest and amortization on
6.00% Convertible Notes | |
| 253 | | |
| 472 | | |
| 1,048 | | |
| 2,090 | |
| Amount
allocated to participating securities | |
| 49 | | |
| 91 | | |
| 313 | | |
| 490 | |
| FFO available
to common shareholders and unitholders - diluted | |
| 79,691 | | |
| 61,875 | | |
| 291,197 | | |
| 254,824 | |
| Debt satisfaction (gains) charges,
net, including non-consolidated entities | |
| (11,397 | ) | |
| 1,519 | | |
| (25,086 | ) | |
| 9,764 | |
| Impairment loss - loan receivable | |
| — | | |
| 2,500 | | |
| — | | |
| 2,500 | |
| Transaction
costs/Other | |
| 1,285 | | |
| 368 | | |
| 1,864 | | |
| 1,882 | |
| Company FFO
available to common shareholders and unitholders - diluted | |
| 69,579 | | |
| 66,262 | | |
| 267,975 | | |
| 268,970 | |
| | |
| | | |
| | | |
| | | |
| | |
| FUNDS
AVAILABLE FOR DISTRIBUTION: (2) | |
| | | |
| | | |
| | | |
| | |
| Adjustments: | |
| | | |
| | | |
| | | |
| | |
| Straight-line rents | |
| (12,460 | ) | |
| (16,170 | ) | |
| (47,702 | ) | |
| (47,227 | ) |
| Lease incentives | |
| 387 | | |
| 386 | | |
| 1,544 | | |
| 1,490 | |
| Amortization of below/above
market leases | |
| 418 | | |
| 233 | | |
| 261 | | |
| 1,136 | |
| Lease termination payments,
net | |
| 2,420 | | |
| (1,227 | ) | |
| 3,086 | | |
| 1,571 | |
| Non-cash interest, net | |
| (638 | ) | |
| 1,294 | | |
| (118 | ) | |
| (2,892 | ) |
| Non-cash charges, net | |
| 2,213 | | |
| 2,141 | | |
| 8,821 | | |
| 8,704 | |
| Tenant improvements | |
| (7,242 | ) | |
| (5,435 | ) | |
| (20,426 | ) | |
| (11,395 | ) |
| Lease costs | |
| (2,439 | ) | |
| (2,070 | ) | |
| (6,681 | ) | |
| (10,484 | ) |
| Company
Funds Available for Distribution | |
$ | 52,238 | | |
$ | 45,414 | | |
$ | 206,760 | | |
$ | 209,873 | |
| | |
| | | |
| | | |
| | | |
| | |
| Per Common
Share and Unit Amounts | |
| | | |
| | | |
| | | |
| | |
| Basic: | |
| | | |
| | | |
| | | |
| | |
| FFO | |
$ | 0.33 | | |
$ | 0.25 | | |
$ | 1.19 | | |
$ | 1.06 | |
| | |
| | | |
| | | |
| | | |
| | |
| Diluted: | |
| | | |
| | | |
| | | |
| | |
| FFO | |
$ | 0.33 | | |
$ | 0.25 | | |
$ | 1.19 | | |
$ | 1.05 | |
| Company FFO | |
$ | 0.29 | | |
$ | 0.27 | | |
$ | 1.10 | | |
$ | 1.11 | |
| Company FAD | |
$ | 0.21 | | |
$ | 0.19 | | |
$ | 0.85 | | |
$ | 0.87 | |
| | |
| | | |
| | | |
| | | |
| | |
| Weighted-Average Common Shares: | |
| | | |
| | | |
| | | |
| | |
| Basic(3) | |
| 237,283,062 | | |
| 234,688,921 | | |
| 237,303,490 | | |
| 232,838,280 | |
| Diluted | |
| 244,121,625 | | |
| 243,398,807 | | |
| 244,355,734 | | |
| 241,967,017 | |
1
Lexington believes that Funds from Operations (“FFO”), which is not a measure under
generally accepted accounting principles (“GAAP”), is a widely recognized and appropriate measure of the performance
of an equity REIT. Lexington believes FFO is frequently used by securities analysts, investors and other interested parties in
the evaluation of REITs, many of which present FFO when reporting their results. FFO is intended to exclude GAAP historical cost
depreciation and amortization of real estate and related assets, which assumes that the value of real estate diminishes ratably
over time. Historically, however, real estate values have risen or fallen with market conditions. As a result, FFO provides a
performance measure that, when compared year over year, reflects the impact to operations from trends in occupancy rates, rental
rates, operating costs, development activities, interest costs and other matters without the inclusion of depreciation and amortization,
providing perspective that may not necessarily be apparent from net income.
The National
Association of Real Estate Investment Trusts, Inc. (“NAREIT”) defines FFO as “net income (or loss) computed
in accordance with GAAP, excluding gains (or losses) from sales of property, plus real estate depreciation and amortization and
after adjustments for unconsolidated partnerships and joint ventures.” NAREIT clarified its computation of FFO to exclude
impairment charges on depreciable real estate owned directly or indirectly. FFO does not represent cash generated from operating
activities in accordance with GAAP and is not indicative of cash available to fund cash needs.
Lexington presents
FFO available to common shareholders and unitholders - basic. Lexington also presents FFO available to common shareholders and
unitholders - diluted on a company-wide basis as if all securities that are convertible, at the holder's option, into Lexington's
common shares, are converted at the beginning of the period. Lexington also presents Company FFO which adjusts FFO for certain
items which Management believes are not indicative of the operating results of its real estate portfolio. Management believes
this is an appropriate presentation as it is frequently requested by security analysts, investors and other interested parties.
Since others do not calculate funds from operations in a similar fashion, Company FFO may not be comparable to similarly titled
measures as reported by others. Company FFO should not be considered as an alternative to net income as an indicator of our operating
performance or as an alternative to cash flow as a measure of liquidity.
2 Company
Funds Available for Distribution ("FAD") is calculated by making adjustments to Company FFO for (1) straight-line rent
revenue, (2) lease incentive amortization, (3) amortization of above/below market leases, (4) lease termination payments, net,
(5) non-cash interest, net, (6) non-cash charges, net, (7) cash paid for tenant improvements, and (8) cash paid for lease costs.
Although FAD may not be comparable to that of other REITs, Lexington believes it provides a meaningful indication of its ability
to fund cash needs. FAD is a non-GAAP financial measure and should not be viewed as an alternative measurement of operating performance
to net income, as an alternative to net cash flows from operating activities or as a measure of liquidity.
3 Includes
OP units other than OP units held by us.
#
# #
LEXINGTON
REALTY TRUST
2015 Fourth
Quarter Investment / Capital Recycling Summary
PROPERTY INVESTMENTS
| | |
Primary
Tenant (Guarantor) | |
Location | |
Property
Type | |
Initial
Basis
($000) | | |
Initial
Annualized
Cash Rent ($000) | | |
Initial
Cash
Yield | | |
Initial
GAAP
Yield | | |
Month
Closed | |
Primary
Lease
Expiration |
| 1 | |
Preferred Freezer Services of Richland
LLC (Preferred Freezer Services, LLC & Preferred Freezer Services Operating, LLC) (1) | |
Richland | |
WA | |
Industrial | |
$ | 152,000 | | |
$ | 10,792 | | |
| 7.1 | % | |
| 8.6 | % | |
November | |
08/2035 |
| 2 | |
McGuireWoods LLP
(2) | |
Richmond | |
VA | |
Office | |
| 101,489 | | |
| 8,701 | | |
| 8.2 | % | |
| 9.0 | % | |
December | |
08/2030 |
| 2 | |
TOTAL PROPERTY
INVESTMENT | |
| |
| |
| |
$ | 253,489 | | |
$ | 19,493 | | |
| 7.6 | % | |
| 8.8 | % | |
| |
|
CAPITAL RECYCLING
| | |
PROPERTY DISPOSITIONS | |
| |
| |
| | |
| | |
| | |
| | |
| |
| | |
| |
| |
| |
| | |
| | |
| | |
| | |
| |
| | |
Tenant | |
Location | |
Property
Type | |
Gross
Disposition
Price
($000) | | |
Annualized NOI
($000) | | |
Month of
Disposition | | |
% Leased | | |
Gross
Disposition
Price PSF | |
| 1 | |
Vacant (3) | |
Rochester | |
NY | |
Office | |
$ | 17,234 | | |
$ | - | | |
| December | | |
| 0 | % | |
$ | 76.26 | |
| |
Footnotes |
| (1) |
ConAgra Foods Inc. provides credit support. |
| (2) |
Property is 100% leased. McGuireWoods LLP is primary tenant with 68% of the space.
Initial basis does not include
$8.1 million for estimated earnout lease payments for developer leased space.
Initial yields include $4.0 million of earnout lease
payments earned but not yet paid as of 12/31/2015. |
| (3) |
Property conveyed through foreclosure. |
LEXINGTON
REALTY TRUST
BUILD-TO-SUIT
PROJECTS / FORWARD PURCHASE COMMITMENTS
12/31/2015
BUILD-TO-SUIT PROJECTED CONSTRUCTION
FUNDING SCHEDULE (1)
| | |
Location | |
Sq.
Ft | | |
Asset
Type | |
Lease
Term (Years) | |
Maximum
Commitment/
Estimated
Completion
Cost ($000) | | |
Investment
balance as of
12/31/15
($000) | | |
Estimated
Cash Investment Next 12 Months ($000) | | |
Estimated
Completion/
Acquisition
Date | |
Estimated
Initial
Cash
Yield | | |
Estimated
GAAP
Yield | |
| | |
| |
| |
| | |
| |
| |
| | |
| | |
Q1
2016 | | |
Q2
2016 | | |
Q3
2016 | | |
Q4
2016 | | |
| |
| | |
| |
| 1 | |
Anderson | |
SC | |
| 1,325,000 | | |
Industrial | |
20 | |
$ | 70,012 | | |
$ | 23,826 | | |
$ | 21,088 | | |
$ | 24,536 | | |
$ | - | | |
$ | - | | |
2Q16 | |
| 5.9 | % | |
| 7.3 | % |
| 2 | |
Lake Jackson | |
TX | |
| 664,000 | | |
Office | |
20 | |
| 166,164 | | |
| 62,353 | | |
| 300 | | |
| 33,818 | | |
| 50,577 | | |
| 16,859 | | |
4Q 16 | |
| 7.3 | % | |
| 8.9 | % |
| 3 | |
Charlotte | |
NC | |
| 201,000 | | |
Office | |
15 | |
| 62,445 | | |
| 9,223 | | |
| 8,425 | | |
| 11,130 | | |
| 11,130 | | |
| 11,130 | | |
1Q 17 | |
| 8.3 | % | |
| 9.5 | % |
| | |
| |
| |
| | | |
| |
| |
| | | |
| | | |
| | | |
| | | |
| | | |
| | | |
| |
| | | |
| | |
| 3 | |
TOTAL CONSOLIDATED BUILD-TO-SUIT PROJECTS (2) | |
| | | |
| |
| |
$ | 298,621 | | |
$ | 95,402 | | |
$ | 29,813 | | |
$ | 69,484 | | |
$ | 61,707 | | |
$ | 27,989 | | |
| |
| | | |
| | |
| | |
| |
| |
| | | |
| |
| |
| | | |
| | | |
| | | |
| | | |
| | | |
| | | |
| |
| | | |
| | |
| 1 | |
Houston (3) | |
TX | |
| 274,000 | | |
Retail/Specialty | |
20 | |
$ | 86,491 | | |
$ | 38,367 | | |
$ | 15,269 | | |
$ | 15,269 | | |
$ | 15,269 | | |
$ | - | | |
3Q 16 | |
| 7.5 | % | |
| 7.5 | % |
| | |
| |
| |
| | | |
| |
| |
| | | |
| | | |
| | | |
| | | |
| | | |
| | | |
| |
| | | |
| | |
| 1 | |
TOTAL NON-CONSOLIDATED BUILD-TO-SUIT PROJECTS | |
| | | |
| |
| |
$ | 86,491 | | |
$ | 38,367 | | |
$ | 15,269 | | |
$ | 15,269 | | |
$ | 15,269 | | |
$ | - | | |
| |
| | | |
| | |
| | |
| |
| |
| | | |
| |
| |
| | | |
| | | |
| | | |
| | | |
| | | |
| | | |
| |
| | | |
| | |
| 4 | |
TOTAL BUILD-TO-SUIT PROJECTS | |
| | | |
| |
| |
$ | 385,112 | | |
$ | 133,769 | | |
$ | 45,082 | | |
$ | 84,753 | | |
$ | 76,976 | | |
$ | 27,989 | | |
| |
| | | |
| | |
FORWARD PURCHASE COMMITMENTS
(1)
| | |
Tenant | |
Location | |
Property Type | |
Sq.
Ft. | | |
Estimated
Acquisition
Cost ($000) | | |
Estimated
Completion/
Acquisition
Date | |
Estimated
Initial Cash
Yield | | |
Estimated
GAAP Yield | | |
Lease Term |
| 1 | |
FCA US LLC (F/K/A Chrysler Group
LLC) (4) | |
Detroit, MI | |
Industrial | |
| 189,960 | | |
$ | 29,680 | | |
1Q 16 | |
| 7.4 | % | |
| 7.4 | % | |
20 yrs |
| | |
| |
| |
| |
| | | |
| | | |
| |
| | | |
| | | |
|
| 1 | |
TOTAL FORWARD PURCHASE COMMITMENTS | |
| |
| |
| | | |
| | | |
| |
| | | |
| | | |
|
| BUILD-TO-SUIT NOI (5) | |
| | |
| | |
| | |
| | |
| |
| | |
2011 | | |
2012 | | |
2013 | | |
2014 | | |
2015 | |
| Net operating income ($000) | |
$ | 1,156 | | |
$ | 5,268 | | |
$ | 11,920 | | |
$ | 21,438 | | |
$ | 27,462 | |
Footnotes
| (1) | Lexington can give no assurance that
any of the build-to-suit projects or other potential investments that are under commitment
or contract or in process will be completed. |
| (2) | Investment balance in accordance with
GAAP included in investment in real estate under construction. Aggregate equity invested
is $98.2 million. |
| (3) | Lexington has a 25% interest as of
December 31, 2015. Lexington is providing construction financing up to $56.7 million
to the joint venture, of which $8.5 million has been funded as of December 31, 2015.
Estimated cash investments for the next 12 months are Lexington's estimated loan amounts.
Lease contains annual CPI increases. |
| (4) | Lexington funded a $2.5 million deposit.
Property acquired January 2016. |
| (5) | Net operating income generated from
completed build-to-suit projects funded by Lexington beginning in 2010. |
LEXINGTON
REALTY TRUST
2015 Fourth
Quarter Financing Summary
| DEBT RETIRED | |
| |
| |
| | |
| | |
|
| | |
| |
| |
| | |
| | |
|
| Location | |
Tenant (Guarantor) | |
Property Type | |
Face / Satisfaction
($000) | | |
Fixed Rate | | |
Maturity Date |
| | |
| |
| |
| | | |
| | | |
|
| Consolidated Mortgage Debt: | |
| |
| |
| | | |
| | | |
|
| Rochester, NY (1) | |
Vacant | |
Office | |
$ | 17,234 | | |
| 6.21 | % | |
08/2016 |
PROPERTY LEVEL FINANCING
| | |
| |
| |
| | |
| | |
|
| Location | |
Tenant (Guarantor) | |
Property Type | |
| Face
($000) | | |
| Fixed Rate | | |
Maturity Date |
| | |
| |
| |
| | | |
| | | |
|
| Richland, WA | |
Preferred Freezer Services of Richland LLC (Preferred Freezer Services, LLC & Preferred Freezer Services Operating, LLC) | |
Industrial | |
$ | 110,000 | | |
| 4.00 | % | |
01/2026 |
Footnotes
| (1) | Property conveyed through foreclosure. |
LEXINGTON REALTY TRUST
2015 Fourth Quarter Leasing Summary
LEASE EXTENSIONS
| | |
Tenant (Guarantor) | |
Location | |
Prior
Term | |
Lease Expiration
Date | |
Sq.
Ft. | | |
New
Cash
Rent Per
Annum
($000)(1) | | |
Prior
Cash Rent
Per Annum
($000) | | |
New
GAAP
Rent Per
Annum
($000)(1) | | |
Prior
GAAP Rent
Per Annum
($000) | |
| | |
| |
| |
| |
| |
| |
| | |
| | |
| | |
| | |
| |
| | |
Office / Multi-Tenant | |
| |
| |
| |
| |
| | | |
| | | |
| | | |
| | | |
| | |
| 1-3 | |
Various | |
Honolulu | |
HI | |
2015 | |
2016-2018 | |
| 886 | | |
$ | 10 | | |
$ | 10 | | |
$ | 10 | | |
$ | 10 | |
| | |
| |
| |
| |
| |
| |
| | | |
| | | |
| | | |
| | | |
| | |
| 3 | |
Total office lease extensions | |
| |
| |
| |
| |
| 886 | | |
$ | 10 | | |
$ | 10 | | |
$ | 10 | | |
$ | 10 | |
| | |
| |
| |
| |
| |
| |
| | | |
| | | |
| | | |
| | | |
| | |
| | |
Industrial | |
| |
| |
| |
| |
| | | |
| | | |
| | | |
| | | |
| | |
| 1 | |
MAHLE Aftermarket Inc. (MAHLE Industries, Incorporated) | |
Olive Branch | |
MS | |
02/2016 | |
02/2023 | |
| 268,104 | | |
$ | 871 | | |
$ | 954 | | |
$ | 906 | | |
$ | 905 | |
| 2 | |
Jacobson Warehouse Company, Inc. | |
Rockford | |
IL | |
12/2015 | |
12/2018 | |
| 150,000 | | |
| 525 | | |
| 476 | | |
| 471 | | |
| 488 | |
| | |
| |
| |
| |
| |
| |
| | | |
| | | |
| | | |
| | | |
| | |
| 2 | |
Total industrial lease extensions | |
| |
| |
| |
| |
| 418,104 | | |
$ | 1,396 | | |
$ | 1,430 | | |
$ | 1,377 | | |
$ | 1,393 | |
| | |
| |
| |
| |
| |
| |
| | | |
| | | |
| | | |
| | | |
| | |
| 5 | |
TOTAL EXTENDED LEASES | |
| |
| |
| |
| |
| 418,990 | | |
$ | 1,406 | | |
$ | 1,440 | | |
$ | 1,387 | | |
$ | 1,403 | |
NEW LEASES
| | |
Tenant | |
Location | |
Lease
Expiration
Date | |
Sq.
Ft. | | |
New
Cash
Rent Per
Annum
($000)(1) | | |
New
GAAP
Rent Per
Annum
($000)(1) | |
| | |
Office / Multi-Tenant Office | |
| |
| |
| |
| | | |
| | | |
| | |
| 1 | |
Charles Schwab & Co, Inc. | |
Westlake | |
TX | |
06/2021 | |
| 130,199 | | |
$ | 2,018 | | |
$ | 3,476 | |
| 2 | |
United States of America (2) | |
Florence | |
SC | |
01/2016 | |
| 12,851 | | |
| 257 | | |
| 257 | |
| 3 | |
International Business Machines Corporation | |
Farmers Branch | |
TX | |
04/2021 | |
| 66,018 | | |
| 988 | | |
| 1,056 | |
| 4 | |
Valdeshia Kelly and Corinthian Kelly | |
Honolulu | |
HI | |
12/2017 | |
| 379 | | |
| 8 | | |
| 8 | |
| | |
| |
| |
| |
| |
| | | |
| | | |
| | |
| 4 | |
Total office new leases | |
| |
| |
| |
| 209,447 | | |
$ | 3,271 | | |
$ | 4,797 | |
| | |
| |
| |
| |
| |
| | | |
| | | |
| | |
| | |
Industrial | |
| |
| |
| |
| | | |
| | | |
| | |
| 1 | |
United States Cold Storage, Inc. | |
McDonough | |
GA | |
08/2028 | |
| 296,972 | | |
$ | 2,109 | | |
$ | 2,251 | |
| | |
| |
| |
| |
| |
| | | |
| | | |
| | |
| 1 | |
Total industrial new lease | |
| |
| |
| |
| 296,972 | | |
$ | 2,109 | | |
$ | 2,251 | |
| | |
| |
| |
| |
| |
| | | |
| | | |
| | |
| 5 | |
TOTAL NEW LEASES | |
| |
| |
| |
| 506,419 | | |
$ | 5,380 | | |
$ | 7,048 | |
| | |
| |
| |
| |
| |
| | | |
| | | |
| | |
| 10 | |
TOTAL NEW AND EXTENDED
LEASES | |
| |
| |
| |
| 925,409 | | |
$ | 6,786 | | |
$ | 8,435 | |
Footnotes
| (1) | Assumes twelve months rent from the later of 1/1/16 or full lease commencement/extension, excluding free rent periods as applicable. |
| (2) | Tenant lease has expired, and tenant has vacated. |
LEXINGTON REALTY TRUST
Other Revenue Data
12/31/2015
($000)
Other Revenue Data
| | |
GAAP Rent | |
| Asset Class | |
Twelve months ended | |
| | |
| 12/31/15 (1) | | |
| 12/31/15
Percentage | | |
| 12/31/14
Percentage | |
| Office | |
$ | 192,863 | | |
| 50.1 | % | |
| 51.4 | % |
| Industrial | |
| 107,263 | | |
| 27.9 | % | |
| 23.0 | % |
| Land / Infrastructure | |
| 61,534 | | |
| 16.0 | % | |
| 14.3 | % |
| Multi-tenant | |
| 11,450 | | |
| 3.0 | % | |
| 8.7 | % |
| Retail/Specialty | |
| 11,879 | | |
| 3.0 | % | |
| 2.6 | % |
| | |
$ | 384,989 | | |
| 100.0 | % | |
| 100.0 | % |
| | |
GAAP Rent | |
| Credit Ratings (2) | |
Twelve months ended | |
| | |
| 12/31/15 (1) | | |
| 12/31/15
Percentage | | |
| 12/31/14
Percentage | |
| Investment Grade | |
$ | 132,787 | | |
| 34.5 | % | |
| 36.6 | % |
| Non-Investment Grade | |
| 57,419 | | |
| 14.9 | % | |
| 12.4 | % |
| Unrated | |
| 194,783 | | |
| 50.6 | % | |
| 51.0 | % |
| | |
$ | 384,989 | | |
| 100.0 | % | |
| 100.0 | % |
| Weighted-Average Lease Term - Cash Basis |
As of 12/31/15 |
|
As of 12/31/14 |
|
| |
12.6 years |
|
12.1 years |
|
| Weighted-Average Lease Term - Cash Basis - Adjusted (3) |
As of 12/31/15 |
|
As of 12/31/14 |
|
| |
9.1 years |
|
8.6 years |
|
Rent Estimates for Current Assets
| Year | |
Cash (4) | | |
GAAP (4) | | |
Projected
Straight-line /
GAAP Rent
Adjustment | |
| 2016 | |
$ | 355,680 | | |
$ | 401,712 | | |
$ | (46,032 | ) |
| 2017 | |
$ | 331,210 | | |
$ | 372,673 | | |
$ | (41,463 | ) |
Footnotes
| (1) | Twelve months ended 12/31/2015 GAAP rent recognized for consolidated properties owned as of 12/31/2015. |
| (2) | Credit ratings are based upon either tenant, guarantor or parent. Generally, multi-tenant assets are included in unrated. |
| (3) | Adjusted to reflect NY land leases to the first purchase option date. |
| (4) | Amounts assume (1) lease terms for non-cancellable periods only, (2) no new or renegotiated leases are entered into after 12/31/2015,
and (3) no properties are sold or acquired after 12/31/2015. |
LEXINGTON REALTY TRUST
Other Revenue Data (Continued)
12/31/2015
($000)
Same-Store NOI (1)(2)
| | |
Twelve months ended December 31, | |
| | |
2015 | | |
2014 | |
| Total Base Rent | |
$ | 302,827 | | |
$ | 303,495 | |
| Tenant Reimbursements | |
| 28,637 | | |
| 28,109 | |
| Property Operating Expenses | |
| (47,578 | ) | |
| (47,416 | ) |
| Same-Store NOI | |
$ | 283,886 | | |
$ | 284,188 | |
| | |
| | | |
| | |
| Change in Same-Store NOI | |
| (0.1 | )% | |
| | |
Same-Store Percent Leased (2)
| | |
As of 12/31/15 | | |
As of 12/31/14 | |
| |
| 97.6 | % | |
| 98.0 | % |
Lease Escalation Data (3)

Footnotes
| (1) |
NOI is on a consolidated cash basis for all consolidated properties except properties acquired/expanded and sold in 2015 and 2014 and excludes lease termination payments. |
| (2) |
Adjusted for potential foreclosure on the Bridgewater, NJ property. |
| (3) |
Based on twelve months consolidated cash base rents for single-tenant leases. Excludes parking operations and $7.8 million in step-down leases. |
LEXINGTON REALTY TRUST
Portfolio Detail By Asset Class
12/31/2015
( $000, except square footage)
| Asset Class | |
YE 2012 | | |
YE 2013 | | |
YE 2014 | | |
YE 2015 | |
| | |
| | | |
| | | |
| | | |
| | |
| Office | |
| | | |
| | | |
| | | |
| | |
| % of ABR (1) | |
| 64.3 | % | |
| 61.3 | % | |
| 51.4 | % | |
| 50.1 | % |
| LTL (5) | |
| 22.4 | % | |
| 26.8 | % | |
| 31.8 | % | |
| 23.4 | % |
| STL (6) | |
| 77.6 | % | |
| 73.2 | % | |
| 68.2 | % | |
| 76.6 | % |
| Leased | |
| 98.6 | % | |
| 99.0 | % | |
| 98.6 | % | |
| 99.6 | % |
| Wtd. Avg. Lease Term (2) | |
| 6.6 | | |
| 7.2 | | |
| 7.4 | | |
| 7.2 | |
| Mortgage Debt | |
$ | 1,078,345 | | |
$ | 692,460 | | |
$ | 426,635 | | |
$ | 329,696 | |
| % Investment Grade (1) | |
| 62.1 | % | |
| 57.2 | % | |
| 53.7 | % | |
| 48.7 | % |
| Square Feet | |
| 15,726,609 | | |
| 15,316,875 | | |
| 13,264,134 | | |
| 12,847,877 | |
| Cash Base Rent | |
$ | 198,183 | | |
$ | 214,774 | | |
$ | 192,865 | | |
$ | 183,249 | |
| | |
| | | |
| | | |
| | | |
| | |
| Industrial | |
| | | |
| | | |
| | | |
| | |
| % of ABR (1) | |
| 22.9 | % | |
| 23.2 | % | |
| 23.0 | % | |
| 27.9 | % |
| LTL (5) | |
| 33.7 | % | |
| 35.2 | % | |
| 42.8 | % | |
| 43.1 | % |
| STL (6) | |
| 66.3 | % | |
| 64.8 | % | |
| 57.2 | % | |
| 56.9 | % |
| Leased | |
| 99.6 | % | |
| 99.8 | % | |
| 99.7 | % | |
| 99.6 | % |
| Wtd. Avg. Lease Term (2) | |
| 7.5 | | |
| 7.2 | | |
| 7.9 | | |
| 9.5 | |
| Mortgage Debt | |
$ | 221,055 | | |
$ | 206,209 | | |
$ | 177,951 | | |
$ | 292,293 | |
| % Investment Grade (1) | |
| 23.1 | % | |
| 34.1 | % | |
| 29.3 | % | |
| 30.3 | % |
| Square Feet | |
| 21,317,359 | | |
| 21,473,994 | | |
| 22,612,691 | | |
| 25,561,136 | |
| Cash Base Rent | |
$ | 70,600 | | |
$ | 84,039 | | |
$ | 89,991 | | |
$ | 105,032 | |
| | |
| | | |
| | | |
| | | |
| | |
| Land/Infrastructure | |
| | | |
| | | |
| | | |
| | |
| % of ABR (1) | |
| 0.5 | % | |
| 4.9 | % | |
| 14.3 | % | |
| 16.0 | % |
| LTL (5) | |
| 100.0 | % | |
| 100.0 | % | |
| 100.0 | % | |
| 100.0 | % |
| STL (6) | |
| 0.0 | % | |
| 0.0 | % | |
| 0.0 | % | |
| 0.0 | % |
| Leased | |
| 100.0 | % | |
| 100.0 | % | |
| 100.0 | % | |
| 100.0 | % |
| Wtd. Avg. Lease Term (2) | |
| 19.1 | | |
| 72.7 | | |
| 73.1 | | |
| 70.3 | |
| Wtd. Avg. Lease Term Adjusted (3) | |
| 19.1 | | |
| 23.7 | | |
| 22.8 | | |
| 22.8 | |
| Mortgage Debt | |
$ | - | | |
$ | 213,500 | | |
$ | 213,475 | | |
$ | 242,494 | |
| % Investment Grade (1) | |
| 0.0 | % | |
| 0.2 | % | |
| 0.4 | % | |
| 0.4 | % |
| Cash Base Rent | |
$ | 1,219 | | |
$ | 9,259 | | |
$ | 22,717 | | |
$ | 25,651 | |
| | |
| | | |
| | | |
| | | |
| | |
| Multi-Tenant | |
| | | |
| | | |
| | | |
| | |
| % of ABR (1) | |
| 9.0 | % | |
| 7.9 | % | |
| 8.7 | % | |
| 3.0 | % |
| Leased | |
| 67.4 | % | |
| 66.4 | % | |
| 53.9 | % | |
| 44.1 | % |
| Wtd. Avg. Lease Term (2) | |
| 7.1 | | |
| 7.0 | | |
| 6.9 | | |
| 3.4 | |
| Mortgage Debt | |
$ | 102,582 | | |
$ | 71,754 | | |
$ | 116,763 | | |
$ | 14,118 | |
| % Investment Grade (1) | |
| 33.2 | % | |
| 34.5 | % | |
| 19.3 | % | |
| 36.9 | % |
| Square Feet | |
| 2,396,631 | | |
| 2,259,189 | | |
| 2,414,889 | | |
| 2,301,864 | |
| Cash Base Rent | |
$ | 25,169 | | |
$ | 27,941 | | |
$ | 34,458 | | |
$ | 11,425 | |
| | |
| | | |
| | | |
| | | |
| | |
| Retail/Specialty | |
| | | |
| | | |
| | | |
| | |
| % of ABR (1) | |
| 3.3 | % | |
| 2.7 | % | |
| 2.6 | % | |
| 3.0 | % |
| LTL (5) | |
| 15.3 | % | |
| 21.0 | % | |
| 28.1 | % | |
| 34.7 | % |
| STL (6) | |
| 84.7 | % | |
| 79.0 | % | |
| 71.9 | % | |
| 65.3 | % |
| Leased | |
| 99.3 | % | |
| 98.5 | % | |
| 94.3 | % | |
| 97.9 | % |
| Wtd. Avg. Lease Term (2) | |
| 8.0 | | |
| 7.2 | | |
| 9.1 | | |
| 8.4 | |
| Mortgage Debt | |
$ | 13,979 | | |
$ | 13,566 | | |
$ | 13,170 | | |
$ | 12,724 | |
| % Investment Grade (1) | |
| 22.0 | % | |
| 18.7 | % | |
| 22.4 | % | |
| 16.4 | % |
| Square Feet | |
| 1,755,608 | | |
| 1,489,267 | | |
| 1,447,724 | | |
| 1,395,517 | |
| Cash Base Rent | |
$ | 8,186 | | |
$ | 7,947 | | |
$ | 8,948 | | |
$ | 9,557 | |
| | |
| | | |
| | | |
| | | |
| | |
| Loans Receivable | |
$ | 72,540 | | |
$ | 99,443 | | |
$ | 105,635 | | |
$ | 95,871 | |
| Construction in progress (4) | |
$ | 71,634 | | |
$ | 78,656 | | |
$ | 121,184 | | |
$ | 103,954 | |
Footnotes
| (1) | Percentage of GAAP rent. |
| (3) | Cash basis adjusted to reflect NY land leases to the
first purchase option date. |
| (4) | Includes development classified as real estate under
construction on a consolidated basis. |
| (5) | Long-term leases ("LTL") are defined as leases
having a term of ten years or longer. |
| (6) | Short-term leases ("STL") are defined as leases
having a term of less than ten years. |
LEXINGTON REALTY TRUST
Portfolio Composition
12/31/2015
As a Percent
of Gross Book Value (1)

Portfolio
Composition (2)

Footnotes
| (1) | Based on gross book value of assets as of 12/31/2015. |
| (2) | Based on twelve months GAAP rent as of 12/31/2015. |
| LEXINGTON REALTY TRUST |
| Components of Net Asset Value |
| 12/31/2015 |
| ($000) |
The purpose of providing the following information is to enable
readers to derive their own estimate of net asset value. This information is not intended to be an asset-by-asset or enterprise
valuation.
| Consolidated properties twelve month cash net operating income (NOI) (1) | |
| | |
| Office | |
$ | 178,659 | |
| Industrial | |
| 116,682 | |
| Land/ Infrastructure | |
| 25,949 | |
| Multi-Tenant | |
| 3,072 | |
| Retail/Specialty | |
| 7,640 | |
| Total Net Operating Income | |
$ | 332,002 | |
| | |
| | |
| Lexington's share of non-consolidated twelve month NOI (1) | |
| | |
| Land/Infrastructure | |
$ | 244 | |
| Office | |
| 2,218 | |
| Retail/Specialty | |
| 1,213 | |
| | |
$ | 3,675 | |
| Other income | |
| | |
| Advisory fees | |
$ | 547 | |
| In service assets not fairly valued by capitalized NOI method (1) | |
| | |
| Wholly-owned assets | |
$ | 82,156 | |
| | |
| | |
| Add other assets: | |
| | |
| Assets held for sale | |
$ | 24,425 | |
| Loans receivable | |
| 95,871 | |
| Development investment at cost incurred | |
| 119,924 | |
| Cash and cash equivalents | |
| 93,249 | |
| Restricted cash | |
| 10,637 | |
| Accounts receivable, net | |
| 7,193 | |
| Other assets | |
| 18,505 | |
| Total other assets | |
$ | 369,804 | |
| | |
| | |
| Liabilities: | |
| | |
| Corporate level debt | |
$ | 1,321,247 | |
| Mortgages and notes payable | |
| 882,952 | |
| Liabilities held for sale | |
| 8,405 | |
| Dividends payable | |
| 45,440 | |
| Accounts payable, accrued expenses and other liabilities | |
| 67,136 | |
| Preferred stock, at liquidation value | |
| 96,770 | |
| Lexington's share of non-consolidated mortgages | |
| 8,591 | |
| Total deductions | |
$ | 2,430,541 | |
| | |
| | |
| Common shares & OP units at 12/31/2015 | |
| 238,395,417 | |
Footnotes
| (1) | Twelve months ended December 31, 2015 Cash NOI for the existing property portfolio excludes straight-line income, other GAAP
adjustments, minority interests' share of NOI and NOI related to assets undervalued by a capitalized NOI method. Assets undervalued
by a capitalized NOI method are identified generally by occupancies under 70%. For assets in this category an NOI capitalization
approach is not appropriate and accordingly the company's net book value has been used. NOI has been adjusted for acquisitions,
divestitures, and changes in occupancy during the period, as applicable. |
| LEXINGTON REALTY TRUST |
| Top Markets |
| 12/31/2015 |
| | |
Core Based Statistical Area (2) | |
Percent of
GAAP Rent as of
12/31/15 (1) | |
| 1 | |
New York-Northern New Jersey-Long Island, NY-NJ-PA | |
| 16.5 | % |
| 2 | |
Dallas-Fort Worth-Arlington, TX | |
| 6.7 | % |
| 3 | |
Houston-Sugar Land-Baytown, TX | |
| 6.4 | % |
| 4 | |
Memphis, TN-MS-AR | |
| 4.4 | % |
| 5 | |
Kansas City, MO-KS | |
| 3.8 | % |
| 6 | |
Phoenix-Mesa-Scottsdale, AZ | |
| 3.8 | % |
| 7 | |
Denver-Aurora, CO | |
| 2.3 | % |
| 8 | |
Detroit-Warren-Livonia, MI | |
| 2.2 | % |
| 9 | |
Philadelphia-Camden-Wilmington, PA-NJ-DE-MD | |
| 2.2 | % |
| 10 | |
Boston-Cambridge-Quincy, MA-NH | |
| 2.1 | % |
| 11 | |
Columbus, OH | |
| 2.0 | % |
| 12 | |
Indianapolis-Carmel, IN | |
| 1.9 | % |
| 13 | |
Charlotte-Gastonia-Rock Hill, NC-SC | |
| 1.8 | % |
| 14 | |
Las Vegas-Paradise, NV | |
| 1.8 | % |
| 15 | |
San Jose-Sunnyvale-Santa Clara, CA | |
| 1.7 | % |
| 16 | |
Chicago-Naperville-Joliet, IL-IN-WI | |
| 1.6 | % |
| 17 | |
Atlanta-Sandy Springs-Marietta, GA | |
| 1.5 | % |
| 18 | |
Orlando-Kissimmee, FL | |
| 1.4 | % |
| 19 | |
Cincinnati-Middletown, OH-KY-IN | |
| 1.4 | % |
| 20 | |
Washington-Arlington-Alexandria, DC-VA-MD-WV | |
| 1.3 | % |
| | |
Total Top Markets (3) | |
| 66.8 | % |
Footnotes
| (1) | Twelve months ended 12/31/2015 GAAP rent recognized for consolidated properties owned as of 12/31/2015. |
| (2) | A Core Based Statistical Area is the official term for a functional region based around an urban center of at least 10,000
people, based on standards published by the Office of Management and Budget (OMB) in 2000. These standards are used to replace
the definitions of metropolitan areas that were defined in 1990. |
| (3) | Total shown may differ from detailed amounts due to rounding. |
LEXINGTON REALTY TRUST
Single-Tenant Office Markets
12/31/2015

Footnotes
| (1) | Twelve months ended 12/31/2015 GAAP rent recognized for consolidated office properties owned as of 12/31/2015. |
| (2) | A Core Based Statistical Area is the official term for a functional region based around an urban center of at least 10,000
people, based on standards published by the Office of Management and Budget
(OMB) in 2000. These standards are used to replace the definitions of metropolitan areas that were defined in 1990. |
LEXINGTON REALTY TRUST
Tenant Industry Diversification
12/31/2015

Footnotes
| (1) | Twelve months ended 12/31/2015 GAAP rent recognized for
consolidated properties owned as of 12/31/2015. |
LEXINGTON REALTY TRUST
Top 10 Tenants or Guarantors
12/31/2015
Top 10 Tenants or Guarantors - Cash Basis
| Tenants or Guarantors | |
Number of
Leases | |
Sq. Ft.
Leased | | |
Sq. Ft. Leased
as a Percent of
Consolidated
Portfolio (2) | | |
Cash Rent
as of
12/31/2015
($000) (1) | | |
Percent of
Cash Rent as of
12/31/2015
($000) (1) (2) | |
| FedEx Corporation / Federal Express Corporation | |
3 | |
| 787,829 | | |
| 1.9 | % | |
$ | 12,569 | | |
| 3.8 | % |
| Metalsa Structural Products, Inc. / Dana Structural Products, LLC (Dana Holding Corporation and Dana Limited) | |
7 | |
| 2,053,359 | | |
| 4.9 | % | |
| 10,221 | | |
| 3.1 | % |
| United States of America | |
4 | |
| 411,065 | | |
| 1.0 | % | |
| 7,997 | | |
| 2.4 | % |
| Nissan North America, Inc. | |
2 | |
| 1,691,049 | | |
| 4.0 | % | |
| 7,895 | | |
| 2.4 | % |
| Swiss Re America Holding Corporation / Westport Insurance Corporation | |
2 | |
| 476,123 | | |
| 1.1 | % | |
| 7,512 | | |
| 2.2 | % |
| Xerox Corporation | |
1 | |
| 202,000 | | |
| 0.5 | % | |
| 7,070 | | |
| 2.1 | % |
| Michelin North America, Inc. | |
3 | |
| 2,503,916 | | |
| 5.9 | % | |
| 7,039 | | |
| 2.1 | % |
| T-Mobile USA, Inc. / T-Mobile West Corporation | |
5 | |
| 386,078 | | |
| 0.9 | % | |
| 6,920 | | |
| 2.1 | % |
| SM Ascott LLC | |
1 | |
| - | | |
| 0.0 | % | |
| 5,771 | | |
| 1.7 | % |
| Industrial Terminals Management, LLC (Maritime Holdings (Delaware) LLC) | |
1 | |
| 132,449 | | |
| 0.3 | % | |
| 5,473 | | |
| 1.6 | % |
| | |
29 | |
| 8,643,868 | | |
| 20.4 | % | |
$ | 78,467 | | |
| 23.4 | % |
Top 10 Tenants or Guarantors - GAAP Basis
| Tenants or Guarantors | |
Number of
Leases | |
Sq. Ft.
Leased | | |
Sq. Ft. Leased
as a Percent of
Consolidated
Portfolio (2) | | |
GAAP Rent
as of
12/31/2015
($000) (3) | | |
Percent of
GAAP Rent as
of 12/31/2015
($000) (3) (2) | |
| SM Ascott LLC | |
1 | |
| - | | |
| 0.0 | % | |
$ | 17,373 | | |
| 4.5 | % |
| FC-Canal Ground Tenant LLC | |
1 | |
| - | | |
| 0.0 | % | |
| 14,890 | | |
| 3.9 | % |
| AL-Stone Ground Tenant LLC | |
1 | |
| - | | |
| 0.0 | % | |
| 13,590 | | |
| 3.5 | % |
| FedEx Corporation / Federal Express Corporation | |
3 | |
| 787,829 | | |
| 1.9 | % | |
| 12,897 | | |
| 3.3 | % |
| Metalsa Structural Products, Inc. / Dana Structural Products, LLC (Dana Holding Corporation and Dana Limited) | |
7 | |
| 2,053,359 | | |
| 4.9 | % | |
| 9,941 | | |
| 2.6 | % |
| United States of America | |
4 | |
| 411,065 | | |
| 1.0 | % | |
| 9,559 | | |
| 2.5 | % |
| Nissan North America, Inc. | |
2 | |
| 1,691,049 | | |
| 4.0 | % | |
| 8,092 | | |
| 2.1 | % |
| Swiss Re America Holding Corporation / Westport Insurance Corporation | |
2 | |
| 476,123 | | |
| 1.1 | % | |
| 7,544 | | |
| 2.0 | % |
| Michelin North America, Inc. | |
3 | |
| 2,503,916 | | |
| 5.9 | % | |
| 7,081 | | |
| 1.8 | % |
| Industrial Terminals Management, LLC (Maritime Holdings (Delaware) LLC) | |
1 | |
| 132,449 | | |
| 0.3 | % | |
| 6,773 | | |
| 1.8 | % |
| | |
25 | |
| 8,055,790 | | |
| 19.1 | % | |
$ | 107,740 | | |
| 28.0 | % |
Footnotes
| (1) | Twelve months ended 12/31/2015 cash rent recognized for
consolidated properties owned as of 12/31/2015. |
| (2) | Total shown may differ from detailed amounts due to rounding. |
| (3) | Twelve months ended 12/31/2015 GAAP rent recognized for
consolidated properties owned as of 12/31/2015. |
LEXINGTON REALTY TRUST
Lease Rollover Schedule - Consolidated
Single-Tenant Properties GAAP Basis
12/31/2015
($000)
| Year | |
Number of
Leases
Expiring | | |
GAAP
Rent as of
12/31/2015 | | |
Percent of
GAAP Rent
as of
12/31/2015 | | |
Percent of
GAAP Rent
as of
12/31/2014 | |
| 2016 | |
| 11 | | |
$ | 14,312 | | |
| 3.9 | % | |
| 5.1 | % |
| 2017 | |
| 19 | | |
| 26,134 | | |
| 7.1 | % | |
| 5.6 | % |
| 2018 | |
| 31 | | |
| 24,936 | | |
| 6.7 | % | |
| 7.1 | % |
| 2019 | |
| 20 | | |
| 29,459 | | |
| 8.0 | % | |
| 8.3 | % |
| 2020 | |
| 16 | | |
| 22,760 | | |
| 6.2 | % | |
| 7.8 | % |
| 2021 | |
| 13 | | |
| 22,828 | | |
| 6.2 | % | |
| 5.9 | % |
| 2022 | |
| 8 | | |
| 12,840 | | |
| 3.5 | % | |
| 3.5 | % |
| 2023 | |
| 7 | | |
| 14,104 | | |
| 3.8 | % | |
| 4.8 | % |
| 2024 | |
| 8 | | |
| 12,243 | | |
| 3.3 | % | |
| 3.6 | % |
| 2025 | |
| 20 | | |
| 33,495 | | |
| 9.1 | % | |
| 10.4 | % |
| Thereafter | |
| 65 | | |
| 156,952 | | |
| 42.4 | % | |
| 35.0 | % |
| | |
| | | |
| | | |
| | | |
| | |
| Total (1) | |
| 218 | | |
$ | 370,063 | | |
| 100.0 | % | |
| | |

Footnotes
| (1) | Total shown may differ from detailed amounts due to rounding
and does not include multi-tenant properties and parking operations. |
LEXINGTON REALTY TRUST
Lease Rollover Schedule - Consolidated
Properties GAAP Basis
12/31/2015
($000)
| Year | |
Number of
Leases
Expiring | | |
GAAP
Rent as of
12/31/2015 | | |
Percent of
GAAP Rent
as of
12/31/2015 | |
| 2016 | |
| 45 | | |
$ | 15,240 | | |
| 4.0 | % |
| 2017 | |
| 30 | | |
| 26,566 | | |
| 7.0 | % |
| 2018 | |
| 37 | | |
| 27,092 | | |
| 7.2 | % |
| 2019 | |
| 26 | | |
| 30,889 | | |
| 8.2 | % |
| 2020 | |
| 18 | | |
| 23,092 | | |
| 6.1 | % |
| 2021 | |
| 16 | | |
| 24,551 | | |
| 6.5 | % |
| 2022 | |
| 9 | | |
| 12,916 | | |
| 3.4 | % |
| 2023 | |
| 8 | | |
| 14,385 | | |
| 3.8 | % |
| 2024 | |
| 8 | | |
| 12,243 | | |
| 3.2 | % |
| 2025 | |
| 21 | | |
| 33,605 | | |
| 8.9 | % |
| Thereafter | |
| 65 | | |
| 156,952 | | |
| 41.6 | % |
| | |
| | | |
| | | |
| | |
| Total (1) | |
| 283 | | |
$ | 377,531 | | |
| 100.0 | % |

Footnotes
| (1) | Total shown may differ from detailed amounts due to rounding
and does not include parking operations. |
LEXINGTON REALTY TRUST
Property Leases and Vacancies - Consolidated Portfolio -
12/31/2015
Year
of Lease
Expiration |
|
Date
of Lease
Expiration |
|
Property
Location |
|
City |
|
State |
|
Note |
|
Primary
Tenant (Guarantor) |
|
Sq.Ft.
Leased or
Available (1) |
|
|
Cash
Rent
as of
12/31/2015
($000) (2) |
|
|
GAAP
Rent
as of
12/31/2015
($000) (3) |
|
|
12/31/2015
Debt Balance
($000) |
|
|
Debt
Maturity |
| OFFICE PROPERTIES |
|
|
|
|
|
|
|
|
|
|
|
|
|
|
|
|
|
|
|
|
|
|
|
|
|
|
|
| 2016 |
|
1/31/2016 |
|
1600
Eberhardt Rd. |
|
Temple |
|
TX |
|
— |
|
Nextel of Texas, Inc. (Nextel
Finance Company) |
|
|
54,683 |
|
|
|
842 |
|
|
|
451 |
|
|
|
7,463 |
|
|
01/2016 |
| |
|
4/30/2016 |
|
11511
Luna Rd. |
|
Farmers
Branch |
|
TX |
|
— |
|
Haggar Clothing Co. (Texas Holding Clothing Corporation
and Haggar Corp.) |
|
|
114,489 |
|
|
|
1,563 |
|
|
|
2,023 |
|
|
|
18,380 |
|
|
07/2016 |
| |
|
5/31/2016 |
|
1200
Jupiter Rd. |
|
Garland |
|
TX |
|
— |
|
Raytheon Company |
|
|
278,759 |
|
|
|
1,506 |
|
|
|
1,731 |
|
|
|
- |
|
|
- |
| |
|
7/8/2016 |
|
1460
Tobias Gadsen Blvd. |
|
Charleston |
|
SC |
|
13 |
|
Hagemeyer North America, Inc. |
|
|
50,076 |
|
|
|
860 |
|
|
|
1,395 |
|
|
|
7,185 |
|
|
02/2021 |
| |
|
7/14/2016 |
|
1400
Northeast McWilliams Rd. |
|
Bremerton |
|
WA |
|
— |
|
Nextel West Corporation (Nextel Finance Company) |
|
|
60,200 |
|
|
|
1,215 |
|
|
|
1,215 |
|
|
|
5,534 |
|
|
04/2016 |
| |
|
9/30/2016 |
|
2000
Eastman Dr. |
|
Milford |
|
OH |
|
— |
|
Siemens Corporation |
|
|
221,215 |
|
|
|
2,486 |
|
|
|
2,318 |
|
|
|
- |
|
|
- |
| |
|
10/31/2016 |
|
104
& 110 South Front St. |
|
Memphis |
|
TN |
|
— |
|
Hnedak Bobo Group, Inc. |
|
|
37,229 |
|
|
|
519 |
|
|
|
501 |
|
|
|
3,555 |
|
|
01/2017 |
| 2017 |
|
1/31/2017 |
|
10300
Kincaid Dr. |
|
Fishers |
|
IN |
|
16 |
|
Roche Diagnostics Operations, Inc. |
|
|
193,000 |
|
|
|
3,530 |
|
|
|
4,410 |
|
|
|
- |
|
|
- |
| |
|
|
|
1311
Broadfield Blvd. |
|
Houston |
|
TX |
|
5 |
|
Transocean Offshore Deepwater Drilling, Inc.
(Transocean Sedco Forex, Inc.) |
|
|
155,040 |
|
|
|
2,636 |
|
|
|
2,657 |
|
|
|
- |
|
|
- |
| |
|
3/31/2017 |
|
1701
Market St. |
|
Philadelphia |
|
PA |
|
— |
|
Car-Tel Communications, Inc. |
|
|
1,220 |
|
|
|
56 |
|
|
|
56 |
|
|
|
- |
|
|
- |
| |
|
6/30/2017 |
|
10419
North 30th St. |
|
Tampa |
|
FL |
|
9 |
|
Time Customer Service, Inc. (Time
Incorporated) |
|
|
132,981 |
|
|
|
1,499 |
|
|
|
1,437 |
|
|
|
- |
|
|
- |
| |
|
9/30/2017 |
|
9201
East Dry Creek Rd. |
|
Centennial |
|
CO |
|
— |
|
Arrow Electronics, Inc. |
|
|
128,500 |
|
|
|
2,732 |
|
|
|
3,032 |
|
|
|
- |
|
|
- |
| |
|
10/31/2017 |
|
4455
American Way |
|
Baton
Rouge |
|
LA |
|
— |
|
New Cingular Wireless PCS, LLC |
|
|
70,100 |
|
|
|
1,061 |
|
|
|
1,058 |
|
|
|
- |
|
|
- |
| |
|
|
|
5201
West Barraque St. |
|
Pine
Bluff |
|
AR |
|
— |
|
Entergy Services, Inc. |
|
|
27,189 |
|
|
|
225 |
|
|
|
277 |
|
|
|
- |
|
|
- |
| |
|
11/30/2017 |
|
800
East Canal St. |
|
Richmond |
|
VA |
|
— |
|
CRG-Richmond Tenant, LLC |
|
|
51,450 |
|
|
|
64 |
|
|
|
64 |
|
|
|
- |
|
|
- |
| |
|
|
|
6200
Northwest Pkwy. |
|
San
Antonio |
|
TX |
|
— |
|
United HealthCare Services, Inc. / PacifiCare
Healthsystems, LLC |
|
|
142,500 |
|
|
|
1,971 |
|
|
|
1,866 |
|
|
|
- |
|
|
- |
| 2018 |
|
1/31/2018 |
|
820
Gears Rd. |
|
Houston |
|
TX |
|
— |
|
Ricoh Americas Corporation |
|
|
78,895 |
|
|
|
1,062 |
|
|
|
1,154 |
|
|
|
- |
|
|
- |
| |
|
2/28/2018 |
|
850-950
Warrenville Rd. |
|
Lisle |
|
IL |
|
— |
|
Flexible Steel Lacing Company, d/b/a Flexco,
Inc. |
|
|
7,535 |
|
|
|
116 |
|
|
|
116 |
|
|
|
- |
|
|
- |
| |
|
5/30/2018 |
|
13651
McLearen Rd. |
|
Herndon |
|
VA |
|
— |
|
United States of America |
|
|
159,644 |
|
|
|
3,589 |
|
|
|
3,402 |
|
|
|
- |
|
|
- |
| |
|
5/31/2018 |
|
8900
Freeport Pkwy. |
|
Irving |
|
TX |
|
— |
|
Pacific Union Financial, LLC. |
|
|
43,396 |
|
|
|
879 |
|
|
|
784 |
|
|
|
- |
|
|
- |
| |
|
6/30/2018 |
|
100
Barnes Rd. |
|
Wallingford |
|
CT |
|
— |
|
3M Company |
|
|
44,400 |
|
|
|
502 |
|
|
|
507 |
|
|
|
- |
|
|
- |
| |
|
|
|
420
Riverport Rd. |
|
Kingsport |
|
TN |
|
— |
|
Kingsport Power Company |
|
|
42,770 |
|
|
|
310 |
|
|
|
128 |
|
|
|
- |
|
|
- |
| |
|
8/31/2018 |
|
2706
Media Center Dr. |
|
Los
Angeles |
|
CA |
|
— |
|
Sony Electronics Inc. |
|
|
20,203 |
|
|
|
214 |
|
|
|
214 |
|
|
|
- |
|
|
- |
| |
|
|
|
3500
North Loop Rd. |
|
McDonough |
|
GA |
|
— |
|
Litton Loan Servicing LP |
|
|
62,218 |
|
|
|
1,309 |
|
|
|
928 |
|
|
|
- |
|
|
- |
| |
|
9/30/2018 |
|
1701
Market St. |
|
Philadelphia |
|
PA |
|
— |
|
CBC Restaurant Corp. |
|
|
8,070 |
|
|
|
224 |
|
|
|
211 |
|
|
|
- |
|
|
- |
| |
|
10/31/2018 |
|
3943
Denny Ave. |
|
Pascagoula |
|
MS |
|
— |
|
Huntington Ingalls Incorporated |
|
|
94,841 |
|
|
|
593 |
|
|
|
593 |
|
|
|
- |
|
|
- |
| |
|
12/22/2018 |
|
5200
Metcalf Ave. |
|
Overland
Park |
|
KS |
|
— |
|
Swiss Re America Holding Corporation / Westport
Insurance Corporation |
|
|
320,198 |
|
|
|
5,122 |
|
|
|
5,154 |
|
|
|
34,134 |
|
|
05/2019 |
| |
|
12/31/2018 |
|
2550
Interstate Dr. |
|
Harrisburg |
|
PA |
|
— |
|
AT&T Services, Inc. |
|
|
61,766 |
|
|
|
1,171 |
|
|
|
1,265 |
|
|
|
- |
|
|
- |
| 2019 |
|
1/31/2019 |
|
2999
Southwest 6th St. |
|
Redmond |
|
OR |
|
— |
|
VoiceStream PCS I, LLC / T-Mobile West Corporation
(T-Mobile USA, Inc.) |
|
|
77,484 |
|
|
|
1,658 |
|
|
|
1,469 |
|
|
|
- |
|
|
- |
| |
|
4/1/2019 |
|
9201
Stateline Rd. |
|
Kansas
City |
|
MO |
|
— |
|
Swiss Re America Holding Corporation / Westport
Insurance Corporation |
|
|
155,925 |
|
|
|
2,390 |
|
|
|
2,390 |
|
|
|
16,271 |
|
|
05/2019 |
| |
|
6/19/2019 |
|
3965
Airways Blvd. |
|
Memphis |
|
TN |
|
— |
|
Federal Express Corporation |
|
|
521,286 |
|
|
|
6,974 |
|
|
|
7,013 |
|
|
|
- |
|
|
- |
| |
|
6/30/2019 |
|
3265
East Goldstone Dr. |
|
Meridian |
|
ID |
|
— |
|
VoiceStream PCS Holding, LLC / T-Mobile PCS Holdings,
LLC (T-Mobile USA, Inc.) |
|
|
77,484 |
|
|
|
1,409 |
|
|
|
1,105 |
|
|
|
9,322 |
|
|
08/2019 |
| |
|
7/15/2019 |
|
19019
North 59th Ave. |
|
Glendale |
|
AZ |
|
— |
|
Honeywell International Inc. |
|
|
252,300 |
|
|
|
1,878 |
|
|
|
1,902 |
|
|
|
- |
|
|
- |
| |
|
7/31/2019 |
|
500
Jackson St. |
|
Columbus |
|
IN |
|
— |
|
Cummins, Inc. |
|
|
390,100 |
|
|
|
4,661 |
|
|
|
4,540 |
|
|
|
20,986 |
|
|
07/2019 |
| |
|
10/31/2019 |
|
10475
Crosspoint Blvd. |
|
Indianapolis |
|
IN |
|
— |
|
John Wiley & Sons, Inc. |
|
|
123,416 |
|
|
|
2,257 |
|
|
|
2,269 |
|
|
|
- |
|
|
- |
| |
|
|
|
9601
Renner Blvd. |
|
Lenexa |
|
KS |
|
— |
|
VoiceStream PCS II Corporation (T-Mobile USA,
Inc.) |
|
|
77,484 |
|
|
|
1,434 |
|
|
|
1,142 |
|
|
|
9,463 |
|
|
12/2019 |
| |
|
12/31/2019 |
|
400
Butler Farm Rd. |
|
Hampton |
|
VA |
|
— |
|
Nextel Communications of the Mid-Atlantic, Inc.
(Nextel Finance Company) |
|
|
100,632 |
|
|
|
986 |
|
|
|
1,006 |
|
|
|
- |
|
|
- |
| |
|
|
|
850-950
Warrenville Rd. |
|
Lisle |
|
IL |
|
— |
|
National-Louis University / James J. Benes &
Associates, Inc. |
|
|
91,879 |
|
|
|
1,549 |
|
|
|
1,566 |
|
|
|
9,449 |
|
|
06/2016 |
| 2020 |
|
2/14/2020 |
|
5600
Broken Sound Blvd. |
|
Boca
Raton |
|
FL |
|
— |
|
Canon Solutions America, Inc. (Oce - USA Holding,
Inc.) |
|
|
143,290 |
|
|
|
2,325 |
|
|
|
2,244 |
|
|
|
19,624 |
|
|
02/2020 |
| |
|
5/31/2020 |
|
2401
Cherahala Blvd. |
|
Knoxville |
|
TN |
|
— |
|
AdvancePCS, Inc. / CaremarkPCS, L.L.C. |
|
|
59,748 |
|
|
|
740 |
|
|
|
773 |
|
|
|
- |
|
|
- |
| |
|
6/30/2020 |
|
3711
San Gabriel |
|
Mission |
|
TX |
|
— |
|
VoiceStream PCS II Corporation / T-Mobile
West Corporation |
|
|
75,016 |
|
|
|
994 |
|
|
|
900 |
|
|
|
- |
|
|
- |
| |
|
7/31/2020 |
|
13775
McLearen Rd. |
|
Herndon |
|
VA |
|
12 |
|
Orange Business Services U.S., Inc. (Equant N.V.) |
|
|
132,677 |
|
|
|
1,722 |
|
|
|
1,729 |
|
|
|
- |
|
|
- |
| |
|
8/31/2020 |
|
133
First Park Dr. |
|
Oakland |
|
ME |
|
— |
|
Omnipoint Holdings, Inc. (T-Mobile USA, Inc.) |
|
|
78,610 |
|
|
|
1,425 |
|
|
|
1,147 |
|
|
|
8,850 |
|
|
10/2020 |
| |
|
9/30/2020 |
|
600
Business Center Dr. |
|
Lake
Mary |
|
FL |
|
— |
|
JPMorgan Chase Bank, National Association |
|
|
125,155 |
|
|
|
1,637 |
|
|
|
1,757 |
|
|
|
- |
|
|
- |
| |
|
|
|
9200
South Park Center Loop |
|
Orlando |
|
FL |
|
— |
|
Zenith Education Group, Inc. (ECMC Group, Inc.) |
|
|
59,927 |
|
|
|
1,128 |
|
|
|
1,136 |
|
|
|
9,471 |
|
|
02/2017 |
| |
|
|
|
550
International Parkway |
|
Lake
Mary |
|
FL |
|
— |
|
JPMorgan Chase Bank, National Association |
|
|
125,920 |
|
|
|
1,647 |
|
|
|
1,762 |
|
|
|
- |
|
|
- |
| |
|
10/31/2020 |
|
12209
West Markham St. |
|
Little
Rock |
|
AR |
|
— |
|
Entergy Arkansas, Inc. |
|
|
36,311 |
|
|
|
237 |
|
|
|
237 |
|
|
|
- |
|
|
- |
LEXINGTON REALTY TRUST
Property Leases and Vacancies - Consolidated Portfolio -
12/31/2015
Year
of Lease
Expiration |
|
Date
of Lease
Expiration |
|
Property
Location |
|
City |
|
State |
|
Note |
|
Primary
Tenant (Guarantor) |
|
Sq.Ft.
Leased or
Available (1) |
|
|
Cash
Rent
as of
12/31/2015
($000) (2) |
|
|
GAAP
Rent
as of
12/31/2015
($000) (3) |
|
|
12/31/2015
Debt Balance
($000) |
|
|
Debt
Maturity |
| OFFICE PROPERTIES | |
| |
| | | |
| | | |
| | | |
| | | |
|
| | |
| |
2550 Interstate Dr. | |
Harrisburg | |
PA | |
— | |
AXA Equitable Life Insurance Company | |
| 2,417 | | |
| 37 | | |
| 159 | | |
| - | | |
- |
| 2021 | |
1/31/2021 | |
1600 Eberhardt Rd. | |
Temple | |
TX | |
— | |
Nextel of Texas, Inc. (Nextel Finance Company) | |
| 54,117 | | |
| 833 | | |
| 447 | | |
| - | | |
- |
| | |
| |
1701 Market St. | |
Philadelphia | |
PA | |
— | |
Morgan, Lewis & Bockius LLP | |
| 289,432 | | |
| 4,287 | | |
| 4,298 | | |
| - | | |
- |
| | |
4/30/2021 | |
11511 Luna Rd. | |
Farmers Branch | |
TX | |
11 | |
International Business Machines Corporation | |
| 66,018 | | |
| 902 | | |
| 1,166 | | |
| - | | |
- |
| | |
6/30/2021 | |
1415 Wyckoff Rd. | |
Wall | |
NJ | |
— | |
New Jersey Natural Gas Company | |
| 157,511 | | |
| 3,543 | | |
| 3,543 | | |
| 17,536 | | |
01/2021 |
| | |
8/31/2021 | |
333 Three D Systems Circle | |
Rock Hill | |
SC | |
— | |
3D Systems Corporation | |
| 80,028 | | |
| 669 | | |
| 688 | | |
| - | | |
- |
| | |
9/30/2021 | |
2050 Roanoke Rd. | |
Westlake | |
TX | |
18 | |
TD Auto Finance LLC / Charles Schwab & Co, Inc. | |
| 130,199 | | |
| 1,696 | | |
| 1,725 | | |
| - | | |
- |
| | |
11/30/2021 | |
29 South Jefferson Rd. | |
Whippany | |
NJ | |
— | |
CAE SimuFlite, Inc. (CAE INC.) | |
| 123,734 | | |
| 2,498 | | |
| 2,327 | | |
| 13,700 | | |
11/2021 |
| | |
12/31/2021 | |
2800 Waterford Lake Dr. | |
Midlothian | |
VA | |
— | |
Alstom Power, Inc. | |
| 99,057 | | |
| 2,206 | | |
| 2,184 | | |
| - | | |
- |
| 2022 | |
1/31/2022 | |
26210 and 26220 Enterprise Court | |
Lake Forest | |
CA | |
— | |
Apria Healthcare, Inc. (Apria Healthcare Group, Inc.) | |
| 100,012 | | |
| 1,333 | | |
| 1,199 | | |
| - | | |
- |
| | |
4/30/2022 | |
4400 Northcorp Pkwy. | |
Palm Beach Gardens | |
FL | |
— | |
The Weiss Group, LLC | |
| 18,500 | | |
| 246 | | |
| 246 | | |
| - | | |
- |
| | |
6/30/2022 | |
8555 South River Pkwy. | |
Tempe | |
AZ | |
— | |
DA Nanomaterials L.L.C./ Air Products and Chemicals, Inc. | |
| 95,133 | | |
| 1,606 | | |
| 1,707 | | |
| - | | |
- |
| | |
7/31/2022 | |
1440 E 15th Street | |
Tucson | |
AZ | |
— | |
CoxCom, LLC | |
| 28,591 | | |
| 517 | | |
| 517 | | |
| - | | |
- |
| | |
11/30/2022 | |
4201 Marsh Ln. | |
Carrollton | |
TX | |
— | |
Carlson Restaurants Inc. (Carlson, Inc.) | |
| 130,000 | | |
| 2,030 | | |
| 1,866 | | |
| - | | |
- |
| | |
12/31/2022 | |
147 Milk St. | |
Boston | |
MA | |
— | |
Atrius Health, Inc. | |
| 52,337 | | |
| 1,701 | | |
| 1,661 | | |
| 12,302 | | |
12/2018 |
| | |
| |
231 N. Martingale Rd. | |
Schaumburg | |
IL | |
— | |
CEC Educational Services, LLC (Career Education Corporation) | |
| 317,198 | | |
| 4,312 | | |
| 4,305 | | |
| - | | |
- |
| 2023 | |
2/28/2023 | |
1315 West Century Dr. | |
Louisville | |
CO | |
— | |
Rogue Wave Software, Inc. | |
| 20,000 | | |
| 4 | | |
| 26 | | |
| - | | |
- |
| | |
| |
2211 South 47th St. | |
Phoenix | |
AZ | |
23 | |
Avnet, Inc. | |
| 176,402 | | |
| 2,203 | | |
| 2,697 | | |
| - | | |
- |
| | |
3/31/2023 | |
8900 Freeport Pkwy. | |
Irving | |
TX | |
— | |
Nissan Motor Acceptance Corporation (Nissan North America, Inc.) | |
| 225,049 | | |
| 3,603 | | |
| 3,425 | | |
| - | | |
- |
| | |
12/14/2023 | |
3333 Coyote Hill Rd. | |
Palo Alto | |
CA | |
— | |
Xerox Corporation | |
| 202,000 | | |
| 7,070 | | |
| 6,642 | | |
| 48,512 | | |
12/2023 |
| 2024 | |
2/14/2024 | |
1362 Celebration Blvd. | |
Florence | |
SC | |
— | |
MED3000, Inc. | |
| 32,000 | | |
| 543 | | |
| 573 | | |
| - | | |
- |
| | |
5/31/2024 | |
3476 Stateview Blvd. | |
Fort Mill | |
SC | |
— | |
Wells Fargo Bank, N.A. | |
| 169,083 | | |
| 1,804 | | |
| 1,948 | | |
| - | | |
- |
| | |
| |
3480 Stateview Blvd. | |
Fort Mill | |
SC | |
— | |
Wells Fargo Bank, N.A. | |
| 169,218 | | |
| 1,805 | | |
| 2,026 | | |
| - | | |
- |
| | |
8/31/2024 | |
10475 Crosspoint Blvd. | |
Indianapolis | |
IN | |
— | |
RGN-Indianapolis I, LLC | |
| 14,236 | | |
| 288 | | |
| 287 | | |
| - | | |
- |
| | |
10/31/2024 | |
1409 Centerpoint Blvd. | |
Knoxville | |
TN | |
— | |
Alstom Power, Inc. | |
| 84,404 | | |
| 1,106 | | |
| 1,255 | | |
| - | | |
- |
| | |
12/31/2024 | |
12000 & 12025 Tech Center Dr. | |
Livonia | |
MI | |
— | |
Kelsey-Hayes Company (TRW Automotive Inc.) | |
| 180,230 | | |
| 1,574 | | |
| 1,691 | | |
| - | | |
- |
| 2025 | |
1/31/2025 | |
1401 Nolan Ryan Expy. | |
Arlington | |
TX | |
— | |
Triumph Aerostructures, LLC (Triumph Group, Inc.) | |
| 111,409 | | |
| 1,649 | | |
| 1,618 | | |
| - | | |
- |
| | |
2/28/2025 | |
6555 Sierra Dr. | |
Irving | |
TX | |
— | |
TXU Energy Retail Company, LLC (Texas Competitive Electric Holdings
Company, LLC) | |
| 247,254 | | |
| 3,000 | | |
| 2,825 | | |
| - | | |
- |
| | |
| |
1401 Nolan Ryan Expy. | |
Arlington | |
TX | |
— | |
Cyient, Inc. (Infotech Enterprise Limited) | |
| 13,590 | | |
| 173 | | |
| 166 | | |
| - | | |
- |
| | |
3/14/2025 | |
601 & 701 Experian Pkwy. | |
Allen | |
TX | |
— | |
Experian Information Solutions, Inc. / TRW, Inc.(Experian Holdings,
Inc.) | |
| 292,700 | | |
| 3,073 | | |
| 2,966 | | |
| - | | |
- |
| | |
3/31/2025 | |
2706 Media Center Dr. | |
Los Angeles | |
CA | |
— | |
Bank of America, National Association | |
| 62,323 | | |
| - | | |
| 910 | | |
| - | | |
- |
| | |
5/31/2025 | |
1701 Market St. | |
Philadelphia | |
PA | |
— | |
TruMark Financial Credit Union | |
| 2,641 | | |
| 139 | | |
| 139 | | |
| - | | |
- |
| | |
6/30/2025 | |
2500 Patrick Henry Pkwy. | |
McDonough | |
GA | |
— | |
Georgia Power Company | |
| 111,911 | | |
| 1,306 | | |
| 1,328 | | |
| - | | |
- |
| | |
9/30/2025 | |
10001 Richmond Ave. | |
Houston | |
TX | |
11 | |
Schlumberger Holdings Corp. | |
| 554,385 | | |
| 7,406 | | |
| 7,030 | | |
| - | | |
- |
| | |
11/30/2025 | |
11707 Miracle Hills Dr. | |
Omaha | |
NE | |
— | |
Infocrossing, Inc. | |
| 85,200 | | |
| 1,167 | | |
| 1,167 | | |
| 7,608 | | |
04/2016 |
| | |
| |
2550 Interstate Dr. | |
Harrisburg | |
PA | |
— | |
Crump Life Insurance Services Inc. | |
| 23,535 | | |
| 8 | | |
| 8 | | |
| - | | |
- |
| | |
12/31/2025 | |
2005 East Technology Cir. | |
Tempe | |
AZ | |
— | |
Infocrossing, Inc. | |
| 60,000 | | |
| 1,128 | | |
| 1,128 | | |
| 7,185 | | |
04/2016 |
| | |
| |
4001 International Pkwy. | |
Carrollton | |
TX | |
— | |
Motel 6 Operating, LP | |
| 138,443 | | |
| 2,068 | | |
| 2,226 | | |
| - | | |
- |
| 2026 | |
3/31/2026 | |
500 Olde Worthington Rd. | |
Westerville | |
OH | |
— | |
InVentiv Communications, Inc. | |
| 97,000 | | |
| 836 | | |
| 1,219 | | |
| - | | |
- |
| | |
4/30/2026 | |
800 East Canal St. | |
Richmond | |
VA | |
— | |
Richmond Belly Ventures, LLC (David Duke, Lauren Duke, Terrence
Kee, Cara Kee and John Bokel) | |
| 2,568 | | |
| - | | |
| - | | |
| - | | |
- |
| | |
11/30/2026 | |
500 Kinetic Dr. | |
Huntington | |
WV | |
— | |
AMZN WVCS LLC (Amazon.com, Inc.) | |
| 68,693 | | |
| 1,070 | | |
| 1,268 | | |
| 6,500 | | |
02/2017 |
| | |
12/29/2026 | |
5500 New Albany Rd. | |
Columbus | |
OH | |
— | |
Evans, Mechwart, Hambleton & Tilton, Inc. | |
| 104,807 | | |
| 1,613 | | |
| 1,737 | | |
| - | | |
- |
| 2027 | |
4/30/2027 | |
1315 West Century Dr. | |
Louisville | |
CO | |
— | |
Global Healthcare Exchange, Inc. (Global Healthcare Exchange, LLC) | |
| 86,877 | | |
| 1,153 | | |
| 1,321 | | |
| - | | |
- |
| | |
6/30/2027 | |
3902 Gene Field Rd | |
St. Joseph | |
MO | |
— | |
Boehringer Ingelheim Vetmedica, Inc. (Boehringer Ingelheim USA Corporation) | |
| 98,849 | | |
| 1,803 | | |
| 1,993 | | |
| - | | |
- |
| | |
7/6/2027 | |
2221 Schrock Rd. | |
Columbus | |
OH | |
— | |
MS Consultants, Inc. | |
| 42,290 | | |
| 589 | | |
| 641 | | |
| - | | |
- |
| | |
8/7/2027 | |
25 Lakeview Dr. | |
Jessup | |
PA | |
— | |
TMG Health, Inc. | |
| 150,000 | | |
| 2,004 | | |
| 2,501 | | |
| - | | |
- |
LEXINGTON REALTY TRUST
Property Leases and Vacancies - Consolidated Portfolio -
12/31/2015
Year
of Lease
Expiration |
|
Date
of Lease
Expiration |
|
Property
Location |
|
City |
|
State |
|
Note |
|
Primary
Tenant (Guarantor) |
|
Sq.Ft.
Leased or
Available (1) |
|
|
Cash
Rent
as of
12/31/2015
($000) (2) |
|
|
GAAP
Rent
as of
12/31/2015
($000) (3) |
|
|
12/31/2015
Debt Balance
($000) |
|
|
Debt
Maturity |
| OFFICE PROPERTIES | |
| |
| | | |
| | | |
| | | |
| | | |
|
| | |
10/31/2027 | |
11201 Renner Blvd. | |
Lenexa | |
KS | |
— | |
United States of America | |
| 169,585 | | |
| 4,353 | | |
| 6,102 | | |
| 36,666 | | |
11/2027 |
| | |
11/30/2027 | |
1700 Millrace Dr. | |
Eugene | |
OR | |
10 | |
Oregon Research Institute / Educational Policy Improvement Center | |
| 80,011 | | |
| 1,681 | | |
| 2,079 | | |
| - | | |
- |
| | |
12/31/2027 | |
333 Mt. Hope Ave. | |
Rockaway | |
NJ | |
— | |
Atlantic Health System, Inc. | |
| 92,326 | | |
| 329 | | |
| 1,156 | | |
| - | | |
- |
| 2028 | |
4/30/2028 | |
9655 Maroon Circle | |
Englewood | |
CO | |
— | |
TriZetto Corporation | |
| 166,912 | | |
| 3,495 | | |
| 3,843 | | |
| - | | |
- |
| 2029 | |
1/31/2029 | |
6226 West Sahara Ave. | |
Las Vegas | |
NV | |
— | |
Nevada Power Company | |
| 282,000 | | |
| 3,089 | | |
| 4,253 | | |
| - | | |
- |
| | |
3/31/2029 | |
2800 High Meadow Circle | |
Auburn Hills | |
MI | |
— | |
Faurecia USA Holdings, Inc. | |
| 278,000 | | |
| 2,513 | | |
| 2,870 | | |
| - | | |
- |
| 2030 | |
7/31/2030 | |
3940 South Teller St. | |
Lakewood | |
CO | |
11 | |
Addenbrooke Classical Academy | |
| 68,165 | | |
| 406 | | |
| 664 | | |
| - | | |
- |
| | |
8/31/2030 | |
800 East Canal St. | |
Richmond | |
VA | |
— | |
McGuireWoods LLP | |
| 224,537 | | |
| 524 | | |
| 580 | | |
| - | | |
- |
| | |
9/30/2030 | |
810 Gears Rd. | |
Houston | |
TX | |
— | |
United States of America | |
| 68,985 | | |
| - | | |
| - | | |
| - | | |
- |
| | |
| |
800 East Canal St. | |
Richmond | |
VA | |
— | |
CCA Industries, Inc. (The Riverstone Group, LLC), | |
| 25,707 | | |
| 35 | | |
| 56 | | |
| - | | |
- |
| | |
| |
800 East Canal St. | |
Richmond | |
VA | |
— | |
Towne Bank | |
| 26,047 | | |
| - | | |
| - | | |
| - | | |
- |
| 2032 | |
10/31/2032 | |
143 Diamond Avenue | |
Parachute | |
CO | |
— | |
Encana Oil and Gas (USA) Inc. (Alenco Inc.) | |
| 49,024 | | |
| 1,029 | | |
| 1,284 | | |
| - | | |
- |
| | |
12/31/2032 | |
3030 North 3rd St. | |
Phoenix | |
AZ | |
— | |
CopperPoint Mutual Insurance Company | |
| 252,400 | | |
| 4,017 | | |
| 4,951 | | |
| - | | |
- |
| 2033 | |
11/30/2033 | |
1331 Capitol Ave. | |
Omaha | |
NE | |
— | |
The Gavilon Group, LLC | |
| 127,810 | | |
| 2,830 | | |
| 3,311 | | |
| - | | |
- |
| | |
12/31/2033 | |
3000 Busch Lake Blvd. | |
Tampa | |
FL | |
— | |
BluePearl Holdings, LLC | |
| 17,000 | | |
| 489 | | |
| 489 | | |
| - | | |
- |
| | |
| |
2910 Busch Lake Blvd. | |
Tampa | |
FL | |
— | |
BluePearl Holdings, LLC | |
| 2,500 | | |
| 55 | | |
| 55 | | |
| - | | |
- |
| | |
| |
2950 Busch Lake Blvd. | |
Tampa | |
FL | |
— | |
BluePearl Holdings, LLC | |
| 8,000 | | |
| 155 | | |
| 155 | | |
| - | | |
- |
| | |
| |
19311 SH 249 | |
Houston | |
TX | |
— | |
BluePearl Holdings, LLC | |
| 12,622 | | |
| 219 | | |
| 219 | | |
| - | | |
- |
| 2039 | |
3/31/2039 | |
854 Paragon Way | |
Rock Hill | |
SC | |
— | |
Physicians Choice Laboratory Services, LLC | |
| 104,497 | | |
| 1,898 | | |
| 2,339 | | |
| - | | |
- |
| 2088 | |
7/8/2088 | |
800 East Canal St. | |
Richmond | |
VA | |
— | |
The City of Richmond, Virginia | |
| - | | |
| 33 | | |
| 33 | | |
| - | | |
- |
| N/A | |
N/A | |
1701 Market St. | |
Philadelphia | |
PA | |
— | |
Parking Operations | |
| - | | |
| 2,545 | | |
| 2,545 | | |
| - | | |
- |
| | |
Vacancy | |
10475 Crosspoint Blvd. | |
Indianapolis | |
IN | |
— | |
(Available for Lease) | |
| 3,764 | | |
| - | | |
| - | | |
| - | | |
- |
| | |
| |
1701 Market St. | |
Philadelphia | |
PA | |
— | |
(Available for Lease) | |
| 2,674 | | |
| - | | |
| - | | |
| - | | |
- |
| | |
| |
810 Gears Rd. | |
Houston | |
TX | |
— | |
(Available for Lease) | |
| 9,910 | | |
| - | | |
| - | | |
| - | | |
- |
| | |
| |
1401 Nolan Ryan Expy. | |
Arlington | |
TX | |
— | |
(Available for Lease) | |
| 36,809 | | |
| 46 | | |
| 46 | | |
| - | | |
- |
| OFFICE TOTAL/WEIGHTED AVERAGE | |
| |
| |
| |
99.6% Leased | |
| 12,847,877 | | |
$ | 183,249 | | |
$ | 192,863 | | |
$ | 329,696 | | |
|
LEXINGTON REALTY TRUST
Property Leases and Vacancies - Consolidated Portfolio -
12/31/2015
Year
of Lease
Expiration | |
Date
of Lease
Expiration | |
Property
Location | |
City | |
State | |
Note | |
Primary
Tenant (Guarantor) | |
Sq.
Ft.
Leased or
Available (1) | | |
Cash
Rent
as of
12/31/2015
($000) (2) | | |
GAAP
Rent
as of
12/31/2015
($000) (3) | | |
12/31/2015
Debt Balance
($000) | | |
Debt
Maturity |
| INDUSTRIAL PROPERTIES | |
| |
| |
| |
| |
| | | |
| | | |
| | | |
| | | |
|
| 2016 | |
5/31/2016 | |
291 Park Center Dr. | |
Winchester | |
VA | |
7 | |
Kraft Foods Group, Inc. | |
| 344,700 | | |
| 1,295 | | |
| 1,289 | | |
| - | | |
- |
| | |
7/31/2016 | |
7111 Crabb Rd. | |
Temperance | |
MI | |
— | |
Michelin North America, Inc. | |
| 744,570 | | |
| 2,286 | | |
| 2,286 | | |
| - | | |
- |
| | |
12/31/2016 | |
2935 Van Vactor Dr. | |
Plymouth | |
IN | |
— | |
Bay Valley Foods, LLC | |
| 300,500 | | |
| 834 | | |
| 801 | | |
| 5,807 | | |
09/2016 |
| | |
| |
3686 South Central Ave. | |
Rockford | |
IL | |
24 | |
Pierce Packaging Co. | |
| 93,000 | | |
| 302 | | |
| 302 | | |
| - | | |
- |
| 2017 | |
2/28/2017 | |
3456 Meyers Ave. | |
Memphis | |
TN | |
— | |
Sears, Roebuck and Co. / Sears Logistics Services | |
| 780,000 | | |
| 1,592 | | |
| 1,694 | | |
| - | | |
- |
| | |
4/30/2017 | |
3600 Army Post Rd. | |
Des Moines | |
IA | |
— | |
HP Enterprise Services, LLC | |
| 405,000 | | |
| 2,616 | | |
| 2,052 | | |
| - | | |
- |
| | |
5/31/2017 | |
191 Arrowhead Dr. | |
Hebron | |
OH | |
— | |
Owens Corning Insulating Systems, LLC | |
| 250,410 | | |
| 554 | | |
| 554 | | |
| - | | |
- |
| | |
| |
200 Arrowhead Dr. | |
Hebron | |
OH | |
— | |
Owens Corning Insulating Systems, LLC | |
| 400,522 | | |
| 886 | | |
| 884 | | |
| - | | |
- |
| | |
6/30/2017 | |
7500 Chavenelle Rd. | |
Dubuque | |
IA | |
— | |
The McGraw-Hill Companies, Inc. | |
| 330,988 | | |
| 1,286 | | |
| 1,164 | | |
| 9,055 | | |
06/2017 |
| | |
9/30/2017 | |
250 Swathmore Ave. | |
High Point | |
NC | |
— | |
Steelcase Inc. | |
| 244,851 | | |
| 1,134 | | |
| 1,087 | | |
| - | | |
- |
| | |
10/31/2017 | |
43955 Plymouth Oaks Blvd. | |
Plymouth | |
MI | |
— | |
Tower Automotive Operations USA I, LLC / Tower Automotive
Products Inc. (Tower Automotive, Inc.) | |
| 290,133 | | |
| 1,378 | | |
| 1,474 | | |
| - | | |
- |
| | |
12/31/2017 | |
2203 Sherrill Dr. | |
Statesville | |
NC | |
— | |
Ozburn-Hessey Logistics, LLC (OHH Acquisition Corporation) | |
| 639,800 | | |
| 2,029 | | |
| 1,916 | | |
| - | | |
- |
| 2018 | |
6/30/2018 | |
1133 Poplar Creek Rd. | |
Henderson | |
NC | |
— | |
Staples, Inc. | |
| 196,946 | | |
| 825 | | |
| 815 | | |
| - | | |
- |
| | |
| |
1650-1654 Williams Rd. | |
Columbus | |
OH | |
— | |
ODW Logistics, Inc. | |
| 772,450 | | |
| 1,347 | | |
| 1,342 | | |
| - | | |
- |
| | |
9/30/2018 | |
50 Tyger River Dr. | |
Duncan | |
SC | |
— | |
Plastic Omnium Auto Exteriors, LLC | |
| 221,833 | | |
| 1,025 | | |
| 1,025 | | |
| - | | |
- |
| | |
| |
904 Industrial Rd. | |
Marshall | |
MI | |
— | |
Tenneco Automotive Operating Company, Inc. (Tenneco, Inc.) | |
| 246,508 | | |
| 841 | | |
| 698 | | |
| - | | |
- |
| | |
12/31/2018 | |
120 Southeast Pkwy. Dr. | |
Franklin | |
TN | |
— | |
Essex Group, Inc. (United Technologies Corporation) | |
| 289,330 | | |
| 735 | | |
| 735 | | |
| - | | |
- |
| | |
| |
749 Southrock Dr. | |
Rockford | |
IL | |
— | |
Jacobson Warehouse Company, Inc. (Jacobson Distribution Company,
Inc. and Jacobson Transportation Company, Inc.) | |
| 150,000 | | |
| 476 | | |
| 485 | | |
| - | | |
- |
| 2019 | |
10/17/2019 | |
10345 Philipp Pkwy. | |
Streetsboro | |
OH | |
— | |
L'Oreal USA S/D, Inc. (L’Oreal USA, Inc.) | |
| 649,250 | | |
| 2,817 | | |
| 2,611 | | |
| 17,626 | | |
09/2019 |
| | |
12/31/2019 | |
2415 US Hwy. 78 East | |
Moody | |
AL | |
— | |
Michelin North America, Inc. | |
| 595,346 | | |
| 1,366 | | |
| 1,408 | | |
| - | | |
- |
| 2020 | |
1/31/2020 | |
101 Michelin Dr. | |
Laurens | |
SC | |
— | |
Michelin North America, Inc. | |
| 1,164,000 | | |
| 3,387 | | |
| 3,387 | | |
| - | | |
- |
| | |
3/31/2020 | |
2425 Hwy. 77 North | |
Waxahachie | |
TX | |
— | |
James Hardie Building Products, Inc. (James Hardie NV & James
Hardie Industries NV) | |
| 335,610 | | |
| 3,400 | | |
| 3,400 | | |
| - | | |
- |
| | |
5/31/2020 | |
359 Gateway Dr. | |
Lavonia | |
GA | |
— | |
TI Group Automotive Systems, LLC (TI Automotive Ltd.) | |
| 133,221 | | |
| 1,200 | | |
| 952 | | |
| 7,676 | | |
12/2020 |
| | |
6/30/2020 | |
3102 Queen Palm Dr. | |
Tampa | |
FL | |
— | |
Time Customer Service, Inc. (Time Incorporated) | |
| 229,605 | | |
| 1,413 | | |
| 1,276 | | |
| - | | |
- |
| | |
9/30/2020 | |
3350 Miac Cove Rd. | |
Memphis | |
TN | |
— | |
Mimeo.com, Inc. | |
| 107,400 | | |
| 438 | | |
| 409 | | |
| - | | |
- |
| | |
12/19/2020 | |
1901 Ragu Dr. | |
Owensboro | |
KY | |
6 | |
Unilever Supply Chain, Inc. (Unilever United States, Inc.) | |
| 443,380 | | |
| 1,196 | | |
| 1,492 | | |
| - | | |
- |
| 2021 | |
3/31/2021 | |
2455 Premier Dr. | |
Orlando | |
FL | |
— | |
Walgreen Co. / Walgreen Eastern Co. | |
| 205,016 | | |
| 508 | | |
| 786 | | |
| - | | |
- |
| | |
5/31/2021 | |
477 Distribution Pkwy. | |
Collierville | |
TN | |
— | |
Federal Express Corporation / FedEx Techconnect, Inc. | |
| 126,213 | | |
| 825 | | |
| 749 | | |
| - | | |
- |
| | |
9/30/2021 | |
3820 Micro Dr. | |
Millington | |
TN | |
— | |
Ingram Micro L.P. (Ingram Micro Inc.) | |
| 701,819 | | |
| 1,691 | | |
| 1,812 | | |
| - | | |
- |
| | |
10/25/2021 | |
6938 Elm Valley Dr. | |
Kalamazoo | |
MI | |
— | |
Dana Commercial Vehicle Products, LLC (Dana Holding Corporation
and Dana Limited) | |
| 150,945 | | |
| 2,027 | | |
| 1,747 | | |
| - | | |
- |
| | |
11/30/2021 | |
2880 Kenny Biggs Rd. | |
Lumberton | |
NC | |
— | |
Quickie Manufacturing Corporation | |
| 423,280 | | |
| 1,374 | | |
| 1,356 | | |
| - | | |
- |
| 2022 | |
3/31/2022 | |
5417 Campus Dr. | |
Shreveport | |
LA | |
— | |
The Tire Rack, Inc. | |
| 257,849 | | |
| 1,276 | | |
| 1,339 | | |
| - | | |
- |
| 2023 | |
2/28/2023 | |
7670 Hacks Cross Rd. | |
Olive Branch | |
MS | |
— | |
MAHLE Aftermarket Inc. (MAHLE Industries, Incorporated) | |
| 268,104 | | |
| 954 | | |
| 853 | | |
| - | | |
- |
| | |
12/31/2023 | |
1601 Pratt Ave. | |
Marshall | |
MI | |
— | |
Autocam Corporation | |
| 58,707 | | |
| 305 | | |
| 305 | | |
| - | | |
- |
| 2024 | |
4/30/2024 | |
113 Wells St. | |
North Berwick | |
ME | |
— | |
United Technologies Corporation | |
| 993,685 | | |
| 1,992 | | |
| 1,827 | | |
| 4,810 | | |
04/2019 |
| | |
5/31/2024 | |
901 East Bingen Point Way | |
Bingen | |
WA | |
— | |
The Boeing Company | |
| 124,539 | | |
| 2,516 | | |
| 2,636 | | |
| - | | |
- |
| 2025 | |
6/30/2025 | |
10000 Business Blvd. | |
Dry Ridge | |
KY | |
— | |
Dana Light Axle Products, LLC (Dana Holding Corporation and Dana
Limited) | |
| 336,350 | | |
| 1,346 | | |
| 1,346 | | |
| - | | |
- |
| | |
| |
301 Bill Bryan Rd. | |
Hopkinsville | |
KY | |
— | |
Metalsa Structural Products, Inc. / Dana Structural Products, LLC
(Dana Holding Corporation and Dana Limited) | |
| 424,904 | | |
| 1,687 | | |
| 1,687 | | |
| - | | |
- |
| | |
| |
4010 Airpark Dr. | |
Owensboro | |
KY | |
— | |
Metalsa Structural Products, Inc. / Dana Structural Products, LLC
(Dana Holding Corporation and Dana Limited) | |
| 211,598 | | |
| 1,208 | | |
| 1,208 | | |
| - | | |
- |
| | |
| |
730 North Black Branch Rd. | |
Elizabethtown | |
KY | |
— | |
Metalsa Structural Products, Inc. / Dana Structural Products, LLC
(Dana Holding Corporation and Dana Limited) | |
| 167,770 | | |
| 537 | | |
| 537 | | |
| - | | |
- |
| | |
| |
750 North Black Branch Rd. | |
Elizabethtown | |
KY | |
— | |
Metalsa Structural Products, Inc. / Dana Structural Products, LLC
(Dana Holding Corporation and Dana Limited) | |
| 539,592 | | |
| 2,838 | | |
| 2,838 | | |
| - | | |
- |
| | |
7/14/2025 | |
590 Ecology Ln. | |
Chester | |
SC | |
— | |
Boral Stone Products LLC (Boral Limited) | |
| 420,597 | | |
| 2,240 | | |
| 1,646 | | |
| 8,738 | | |
08/2025 |
| | |
7/31/2025 | |
7005 Cochran Rd. | |
Glenwillow | |
OH | |
— | |
Royal Appliance Mfg. Co. | |
| 458,000 | | |
| 2,065 | | |
| 2,172 | | |
| 15,326 | | |
09/2016 |
| | |
12/31/2025 | |
1700 47th Ave North | |
Minneapolis | |
MN | |
— | |
Owens Corning Roofing and Asphalt, LLC | |
| 18,620 | | |
| 550 | | |
| 550 | | |
| - | | |
- |
| 2026 | |
3/30/2026 | |
121 Technology Dr. | |
Durham | |
NH | |
15 | |
Heidelberg Americas, Inc. (Heidelberger Druckmaschinen AG) / Goss
International Americas, Inc. (Goss International Corporation) | |
| 500,500 | | |
| 2,480 | | |
| 2,537 | | |
| - | | |
- |
| | |
3/31/2026 | |
633 Garrett Pkwy. | |
Lewisburg | |
TN | |
— | |
Calsonic Kansei North America, Inc. | |
| 310,000 | | |
| 1,206 | | |
| 1,299 | | |
| - | | |
- |
| | |
6/30/2026 | |
351 Chamber Dr. | |
Chillicothe | |
OH | |
— | |
The Kitchen Collection, Inc. | |
| 475,218 | | |
| 1,075 | | |
| 1,159 | | |
| - | | |
- |
LEXINGTON REALTY TRUST
Property Leases and Vacancies - Consolidated Portfolio -
12/31/2015
Year
of Lease
Expiration | |
Date
of Lease
Expiration | |
Property
Location | |
City | |
State | |
Note | |
Primary
Tenant (Guarantor) | |
Sq.
Ft.
Leased or
Available (1) | | |
Cash
Rent
as of
12/31/2015
($000) (2) | | |
GAAP
Rent
as of
12/31/2015
($000) (3) | | |
12/31/2015
Debt Balance
($000) | | |
Debt
Maturity |
| INDUSTRIAL PROPERTIES |
| |
| |
| |
| |
| | | |
| | | |
| | | |
| | | |
|
| | |
9/30/2026 | |
900 Industrial Blvd. | |
Crossville | |
TN | |
— | |
Dana Commercial Vehicle Products, LLC | |
| 222,200 | | |
| 578 | | |
| 578 | | |
| - | | |
- |
| | |
10/31/2026 | |
5001 Greenwood Rd. | |
Shreveport | |
LA | |
— | |
Libbey Glass Inc. (Libbey Inc.) | |
| 646,000 | | |
| 2,113 | | |
| 2,165 | | |
| 19,000 | | |
07/2017 |
| | |
11/30/2026 | |
250 Rittenhouse Cir. | |
Bristol | |
PA | |
— | |
Northtec LLC (The Estée Lauder Companies Inc.) | |
| 241,977 | | |
| 1,092 | | |
| 1,146 | | |
| - | | |
- |
| | |
| |
736 Addison Rd. | |
Erwin | |
NY | |
— | |
Corning Property Management Corporation | |
| 408,000 | | |
| 1,320 | | |
| 1,284 | | |
| 7,887 | | |
10/2018 |
| 2027 | |
2/28/2027 | |
554 Nissan Parkway | |
Canton | |
MS | |
— | |
Nissan North America, Inc. | |
| 1,466,000 | | |
| 4,292 | | |
| 4,667 | | |
| - | | |
- |
| | |
4/30/2027 | |
2424 Alpine Rd. | |
Eau Claire | |
WI | |
20 | |
Silver Spring Foods, Inc. (Huntsinger Farms, Inc.) | |
| 159,000 | | |
| 1,070 | | |
| 1,002 | | |
| - | | |
- |
| | |
12/31/2027 | |
10590 Hamilton Ave. | |
Cincinnati | |
OH | |
— | |
The Hillman Group, Inc. | |
| 264,598 | | |
| 781 | | |
| 813 | | |
| - | | |
- |
| 2028 | |
3/31/2028 | |
29-01-Borden Ave./29-10 Hunters Point Ave. | |
Long Island City | |
NY | |
— | |
FedEx Ground Package System, Inc. (FedEx Corporation) | |
| 140,330 | | |
| 4,770 | | |
| 5,135 | | |
| 49,144 | | |
03/2028 |
| | |
8/31/2028 | |
1420 Greenwood Rd. | |
McDonough | |
GA | |
19 | |
Americold Logistics, LLC / United States Cold Storage, Inc | |
| 296,972 | | |
| 2,721 | | |
| 2,541 | | |
| 22,224 | | |
11/2017 |
| 2029 | |
11/24/2029 | |
318 Pappy Dunn Blvd. | |
Anniston | |
AL | |
— | |
International Automotive Components Group North America, Inc. | |
| 276,782 | | |
| 1,574 | | |
| 1,740 | | |
| - | | |
- |
| 2030 | |
3/31/2030 | |
549 Wingo Rd. | |
Byhalia | |
MS | |
— | |
Asics America Corporation (Asics Corporation) | |
| 855,878 | | |
| 3,600 | | |
| 4,045 | | |
| 15,000 | | |
06/2016 |
| | |
5/31/2030 | |
3301 Stagecoach Rd. NE | |
Thomson | |
GA | |
— | |
Hollander Sleep Products, LLC (Hollander Home Fashions
Holdings) | |
| 208,000 | | |
| 550 | | |
| 610 | | |
| - | | |
- |
| 2031 | |
5/31/2031 | |
671 Washburn Switch Rd. | |
Shelby | |
NC | |
— | |
Clearwater Paper Corporation | |
| 673,518 | | |
| 2,297 | | |
| 2,601 | | |
| - | | |
- |
| 2033 | |
10/31/2033 | |
1001 Innovation Road | |
Rantoul | |
IL | |
— | |
Easton-Bell Sports, Inc. | |
| 813,126 | | |
| 3,487 | | |
| 4,146 | | |
| - | | |
- |
| 2034 | |
9/30/2034 | |
5625 North Sloan Ln. | |
North Las Vegas | |
NV | |
— | |
Nicholas and Co., Inc. | |
| 180,235 | | |
| 2,151 | | |
| 2,557 | | |
| - | | |
- |
| 2035 | |
3/31/2035 | |
7007 F.M. 362 | |
Brookshire | |
TX | |
— | |
Orizon Industries, Inc. (Spitzer Industries, Inc.) | |
| 262,095 | | |
| 1,201 | | |
| 1,458 | | |
| - | | |
- |
| | |
| |
13863 Industrial Road | |
Houston | |
TX | |
— | |
Curtis Kelly, Inc. (Spitzer Industries, Inc.) | |
| 187,800 | | |
| 1,531 | | |
| 1,859 | | |
| - | | |
- |
| | |
6/30/2035 | |
111 West Oakview Pkwy. | |
Oak Creek | |
WI | |
— | |
Stella & Chewy's, LLC | |
| 164,007 | | |
| 837 | | |
| 942 | | |
| - | | |
- |
| | |
8/31/2035 | |
2800 Polar Way | |
Richland | |
WA | |
21 | |
Preferred Freezer Services of Richland LLC (Preferred Freezer Services,
LLC & Preferred Freezer Services Operating, LLC) | |
| 456,412 | | |
| 1,559 | | |
| 1,897 | | |
| 110,000 | | |
01/2026 |
| N/A | |
Vacancy | |
324 Industrial Park Rd. | |
Franklin | |
NC | |
11 | |
(Available for Lease) | |
| 72,868 | | |
| 150 | | |
| 150 | | |
| - | | |
- |
| | |
| |
3350 Miac Cove Rd. | |
Memphis | |
TN | |
— | |
(Available for Lease) | |
| 32,679 | | |
| - | | |
| - | | |
| - | | |
- |
| INDUSTRIAL TOTAL/WEIGHTED AVERAGE | |
| |
| |
| |
99.6% Leased | |
| 25,561,136 | | |
$ | 105,032 | | |
$ | 107,263 | | |
$ | 292,293 | | |
|
LEXINGTON REALTY TRUST
Property Leases and Vacancies - Consolidated Portfolio -
12/31/2015
Year
of Lease
Expiration |
|
Date
of Lease
Expiration |
|
Property
Location |
|
City |
|
State |
|
Note |
|
|
Primary
Tenant (Guarantor) |
|
Sq.Ft.
Leased or
Available (1) |
|
|
Cash
Rent
as of
12/31/2015
($000) (2) |
|
|
GAAP
Rent
as of
12/31/2015
($000) (3) |
|
|
12/31/2015
Debt Balance
($000) |
|
|
Debt
Maturity |
| LAND AND INFRASTRUCTURE PROPERTIES |
|
|
|
|
|
|
|
|
|
|
|
|
|
|
|
|
|
|
|
|
|
|
|
|
|
|
|
| 2029 |
|
1/31/2029 |
|
175 Holt Garrison Pkwy. |
|
Danville |
|
VA |
|
— |
|
|
Home Depot USA, Inc. |
|
|
- |
|
|
|
260 |
|
|
|
216 |
|
|
|
- |
|
|
- |
| 2032 |
|
4/30/2032 |
|
13930 Pike Rd. |
|
Missouri City |
|
TX |
|
— |
|
|
Vulcan Construction Materials, LP (Vulcan Materials
Company) |
|
|
- |
|
|
|
1,843 |
|
|
|
2,123 |
|
|
|
- |
|
|
- |
| 2038 |
|
3/31/2038 |
|
13901/14035 Industrial Rd. |
|
Houston |
|
TX |
|
— |
|
|
Industrial Terminals Management, L.L.C. (Maritime
Holdings (Delaware) LLC) |
|
|
132,449 |
|
|
|
5,473 |
|
|
|
6,773 |
|
|
|
- |
|
|
- |
| 2048 |
|
12/31/2048 |
|
30 Light St |
|
Baltimore |
|
MD |
|
— |
|
|
30 Charm City, LLC |
|
|
- |
|
|
|
120 |
|
|
|
120 |
|
|
|
- |
|
|
- |
| 2055 |
|
1/31/2055 |
|
499 Derbyshire Drive |
|
Venice |
|
FL |
|
— |
|
|
Littlestone Brotherhood LLC |
|
|
31,180 |
|
|
|
1,196 |
|
|
|
1,805 |
|
|
|
- |
|
|
- |
| 2112 |
|
8/31/2112 |
|
201-215 N. Charles St. |
|
Baltimore |
|
MD |
|
— |
|
|
201 NC Leasehold LLC |
|
|
- |
|
|
|
23 |
|
|
|
23 |
|
|
|
- |
|
|
- |
| |
|
10/31/2112 |
|
350 and 370-372 Canal St. |
|
New York |
|
NY |
|
— |
|
|
FC-Canal Ground Tenant LLC |
|
|
- |
|
|
|
4,946 |
|
|
|
14,890 |
|
|
|
69,265 |
|
|
01/2027 |
| |
|
|
|
309-313 West 39th St. |
|
New York |
|
NY |
|
17 |
|
|
SM Ascott LLC |
|
|
- |
|
|
|
5,771 |
|
|
|
17,373 |
|
|
|
80,818 |
|
|
01/2027 |
| |
|
|
|
8-12 Stone St. |
|
New York |
|
NY |
|
— |
|
|
AL-Stone Ground Tenant LLC |
|
|
- |
|
|
|
4,514 |
|
|
|
13,590 |
|
|
|
63,218 |
|
|
01/2027 |
| 2113 |
|
10/31/2113 |
|
15 West 45th St. |
|
New York |
|
NY |
|
— |
|
|
ZE-45 Ground Tenant LLC |
|
|
- |
|
|
|
1,505 |
|
|
|
4,621 |
|
|
|
29,193 |
|
|
01/2025 |
| LAND AND INFRASTRUCTURE TOTAL/WEIGHTED
AVERAGE |
|
|
|
|
100.0% Leased |
|
|
163,629 |
|
|
$ |
25,651 |
|
|
$ |
61,534 |
|
|
$ |
242,494 |
|
|
|
LEXINGTON REALTY TRUST
Property Leases and Vacancies - Consolidated Portfolio -
12/31/2015
Year
of Lease
Expiration | |
Date
of Lease
Expiration | |
Property
Location | |
City | |
State | |
Note | |
Primary
Tenant | |
Sq.Ft. | | |
Percentage
Leased | | |
Cash
Rent
as of
12/31/2015
($000) (2) | | |
GAAP
Rent
as of
12/31/2015
($000) (3) | | |
12/31/2015
Debt
Balance
($000) | | |
Debt
Maturity |
| MULTI-TENANT PROPERTIES (8,14) | |
| |
| |
| |
| |
| | | |
| | | |
| | | |
| | | |
| | | |
|
| Various | |
Various | |
13430 North Black Canyon Fwy. | |
Phoenix | |
AZ | |
— | |
Multi-Tenant | |
| 138,940 | | |
| 92 | % | |
| 2,392 | | |
| 2,368 | | |
| - | | |
- |
| | |
| |
1501 Nolan Ryan Expy. | |
Arlington | |
TX | |
— | |
Multi-Tenant | |
| 74,739 | | |
| 0 | % | |
| 0 | | |
| 0 | | |
| - | | |
- |
| | |
| |
2210 Enterprise Dr. | |
Florence | |
SC | |
— | |
Caliber Funding, LLC | |
| 176,557 | | |
| 28 | % | |
| 787 | | |
| 746 | | |
| - | | |
- |
| | |
| |
26555 Northwestern Pkwy. | |
Southfield | |
MI | |
11 | |
Multi-Tenant | |
| 359,645 | | |
| 0 | % | |
| 97 | | |
| 216 | | |
| - | | |
- |
| | |
| |
275 Technology Dr. | |
Canonsburg | |
PA | |
— | |
Multi-Tenant | |
| 107,872 | | |
| 0 | % | |
| 0 | | |
| 0 | | |
| - | | |
- |
| | |
| |
33 Commercial St. | |
Foxborough | |
MA | |
11 | |
Multi-Tenant | |
| 160,719 | | |
| 5 | % | |
| 3,797 | | |
| 3,797 | | |
| - | | |
- |
| | |
| |
3165 McKelvey Rd. | |
Bridgeton | |
MO | |
— | |
BJC Health System | |
| 51,067 | | |
| 50 | % | |
| 434 | | |
| 403 | | |
| - | | |
- |
| | |
| |
4200 Northcorp Pkwy. | |
Palm Beach Gardens | |
FL | |
— | |
Multi-Tenant | |
| 95,065 | | |
| 100 | % | |
| 1,212 | | |
| 1,231 | | |
| - | | |
- |
| | |
| |
6050 Dana Way | |
Antioch | |
TN | |
— | |
Multi-Tenant | |
| 674,528 | | |
| 98 | % | |
| 1,947 | | |
| 1,930 | | |
| - | | |
- |
| | |
| |
700 US Hwy. Route 202-206 | |
Bridgewater | |
NJ | |
— | |
Multi-Tenant | |
| 115,558 | | |
| 0 | % | |
| 0 | | |
| 0 | | |
| 14,118 | | |
03/2016 |
| | |
| |
700 Oakmont Ln. | |
Westmont | |
IL | |
— | |
Multi-Tenant | |
| 269,715 | | |
| 0 | % | |
| 0 | | |
| 0 | | |
| - | | |
- |
| | |
| |
King St./1042 Fort St. Mall | |
Honolulu | |
HI | |
— | |
Multi-Tenant | |
| 77,459 | | |
| 63 | % | |
| 759 | | |
| 759 | | |
| - | | |
- |
| MULTI-TENANT TOTAL/WEIGHTED AVERAGE | |
| |
| |
| |
44.1% Leased | |
| 2,301,864 | | |
| | | |
$ | 11,425 | | |
$ | 11,450 | | |
$ | 14,118 | | |
|
LEXINGTON REALTY TRUST
Property Leases and Vacancies - Consolidated Portfolio -
12/31/2015
Year of Lease
Expiration | |
Date of Lease
Expiration | |
Property Location | |
City | |
State | |
Note | |
Primary Tenant (Guarantor) | |
Sq.Ft.
Leased or Available
(1) | | |
Cash
Rent
as of
12/31/2015
($000) (2) | | |
GAAP
Rent
as of
12/31/2015
($000) (3) | | |
12/31/2015
Debt Balance
($000) | | |
Debt Maturity |
| RETAIL/SPECIALTY PROPERTIES | |
| |
| |
| |
| |
| | | |
| | | |
| | | |
| | | |
|
| 2017 | |
6/30/2017 | |
1600 East 23rd St. | |
Chattanooga | |
TN | |
— | |
BI-LO, LLC / K-VA-T Food Stores, Inc. | |
| 42,130 | | |
| 129 | | |
| 128 | | |
| - | | |
- |
| | |
12/31/2017 | |
11411 North Kelly Ave. | |
Oklahoma City | |
OK | |
— | |
American Golf Corporation | |
| 13,924 | | |
| 475 | | |
| 324 | | |
| - | | |
- |
| 2018 | |
2/26/2018 | |
4831 Whipple Ave., Northwest | |
Canton | |
OH | |
— | |
Best Buy Co., Inc. | |
| 46,350 | | |
| 465 | | |
| 465 | | |
| - | | |
- |
| | |
2/28/2018 | |
291 Talbert Blvd. | |
Lexington | |
NC | |
— | |
Food Lion, LLC / Delhaize America, Inc. | |
| 23,000 | | |
| 138 | | |
| 138 | | |
| - | | |
- |
| | |
| |
2411 West Beverly St. | |
Staunton | |
VA | |
— | |
Food Lion, LLC / Delhaize America, Inc. | |
| 23,000 | | |
| 166 | | |
| 166 | | |
| - | | |
- |
| | |
7/1/2018 | |
1053 Mineral Springs Rd. | |
Paris | |
TN | |
— | |
The Kroger Co. | |
| 31,170 | | |
| 159 | | |
| 169 | | |
| - | | |
- |
| | |
9/30/2018 | |
835 Julian Ave. | |
Thomasville | |
NC | |
— | |
Mighty Dollar, LLC | |
| 23,767 | | |
| 79 | | |
| 79 | | |
| - | | |
- |
| | |
10/31/2018 | |
130 Midland Ave. | |
Port Chester | |
NY | |
— | |
St. Anthony Supermarket Corp (Anthony Pena, Marina Pena, Anthony
Corona, Robert Corona) | |
| 59,613 | | |
| 458 | | |
| 975 | | |
| - | | |
- |
| | |
| |
5104 North Franklin Rd. | |
Lawrence | |
IN | |
— | |
Marsh Supermarkets, Inc. / Marsh Supermarkets, LLC | |
| 28,721 | | |
| 193 | | |
| 193 | | |
| - | | |
- |
| | |
12/31/2018 | |
1150 West Carl Sandburg Dr. | |
Galesburg | |
IL | |
— | |
Kmart Corporation/ Project Bay Exchange LLC (Sears, Roebuck and
Co.) | |
| 94,970 | | |
| 216 | | |
| 329 | | |
| 468 | | |
07/2018 |
| | |
| |
12080 Carmel Mountain Rd. | |
San Diego | |
CA | |
— | |
Kmart Corporation/ Project Bay Exchange LLC (Sears, Roebuck and
Co.) | |
| 107,210 | | |
| 245 | | |
| 751 | | |
| 532 | | |
07/2018 |
| | |
| |
21082 Pioneer Plaza Dr. | |
Watertown | |
NY | |
— | |
Kmart Corporation/ Project Bay Exchange LLC (Sears, Roebuck and
Co.) | |
| 120,727 | | |
| 362 | | |
| 482 | | |
| 785 | | |
07/2018 |
| | |
| |
255 Northgate Dr. | |
Manteca | |
CA | |
— | |
Kmart Corporation/ Project Bay Exchange LLC (Sears, Roebuck and
Co.) | |
| 107,489 | | |
| 385 | | |
| 555 | | |
| 834 | | |
07/2018 |
| | |
| |
5350 Leavitt Rd. | |
Lorain | |
OH | |
— | |
Kmart Corporation/ Project Bay Exchange LLC (Sears, Roebuck and
Co.) | |
| 193,193 | | |
| 545 | | |
| 731 | | |
| 1,181 | | |
07/2018 |
| | |
| |
97 Seneca Trail | |
Fairlea | |
WV | |
— | |
Kmart Corporation/ Project Bay Exchange LLC (Sears, Roebuck and
Co.) | |
| 90,933 | | |
| 254 | | |
| 347 | | |
| 551 | | |
07/2018 |
| 2019 | |
3/31/2019 | |
B.E.C. 45th St./Lee Blvd. | |
Lawton | |
OK | |
— | |
Associated Wholesale Grocers, Inc. / Safeway, Inc. | |
| 30,757 | | |
| 185 | | |
| 189 | | |
| - | | |
- |
| | |
12/31/2019 | |
1066 Main St. | |
Forest Park | |
GA | |
— | |
Bank of America, N.A. (Bank of America Corporation) | |
| 14,859 | | |
| 200 | | |
| 200 | | |
| - | | |
- |
| | |
| |
1698 Mountain Industrial Blvd. | |
Stone Mountain | |
GA | |
— | |
Bank of America, N.A. (Bank of America Corporation) | |
| 5,704 | | |
| 95 | | |
| 95 | | |
| - | | |
- |
| | |
| |
201 West Main St. | |
Cumming | |
GA | |
— | |
Bank of America, N.A. (Bank of America Corporation) | |
| 14,208 | | |
| 198 | | |
| 198 | | |
| - | | |
- |
| | |
| |
2223 North Druid Hills Rd. | |
Atlanta | |
GA | |
— | |
Bank of America, N.A. (Bank of America Corporation) | |
| 6,260 | | |
| 112 | | |
| 112 | | |
| - | | |
- |
| | |
| |
4545 Chamblee – Dunwoody Rd. | |
Dunwoody | |
GA | |
— | |
Bank of America, N.A. (Bank of America Corporation) | |
| 4,565 | | |
| 88 | | |
| 88 | | |
| - | | |
- |
| | |
| |
825 Southway Dr. | |
Jonesboro | |
GA | |
— | |
Bank of America, N.A. (Bank of America Corporation) | |
| 4,894 | | |
| 77 | | |
| 77 | | |
| - | | |
- |
| | |
| |
956 Ponce de Leon Ave. | |
Atlanta | |
GA | |
— | |
Bank of America, N.A. (Bank of America Corporation) | |
| 3,900 | | |
| 79 | | |
| 79 | | |
| - | | |
- |
| 2023 | |
2/28/2023 | |
733 East Main St. | |
Jefferson | |
NC | |
— | |
Food Lion, LLC / Delhaize America, Inc. | |
| 34,555 | | |
| 160 | | |
| 156 | | |
| - | | |
- |
| 2026 | |
5/31/2026 | |
6910 South Memorial Hwy. | |
Tulsa | |
OK | |
— | |
Toys “R” Us, Inc. / Toys "R" Us-Delaware, Inc. | |
| 43,123 | | |
| 255 | | |
| 255 | | |
| - | | |
- |
| | |
8/31/2026 | |
25500 State Hwy. 249 | |
Tomball | |
TX | |
22 | |
Parkway Chevrolet, Inc. (Jean W. Durdin) | |
| 77,076 | | |
| 1,445 | | |
| 1,404 | | |
| 8,373 | | |
11/2016 |
| 2028 | |
8/31/2028 | |
9803 Edmonds Way | |
Edmonds | |
WA | |
— | |
Pudget Consumers Co-op d/b/a PCC Natural Markets | |
| 35,459 | | |
| 646 | | |
| 646 | | |
| - | | |
- |
| | |
11/30/2028 | |
832 N. Westover Blvd . | |
Albany | |
GA | |
— | |
Gander Mountain Company | |
| 45,554 | | |
| 628 | | |
| 693 | | |
| - | | |
- |
| 2043 | |
2/28/2043 | |
1237 W. Sherman Avenue | |
Vineland | |
NJ | |
— | |
HealthSouth Rehabilitation Hospital of South Jersey, LLC (HealthSouth
Corporation) | |
| 39,287 | | |
| 1,120 | | |
| 1,120 | | |
| - | | |
- |
| N/A | |
Vacancy | |
1084 East Second St. | |
Franklin | |
OH | |
11 | |
(Available for Lease) | |
| 29,119 | | |
| - | | |
| 735 | | |
| - | | |
- |
| RETAIL/SPECIALTY TOTAL/WEIGHTED AVERAGE | |
| |
| |
97.9% Leased | |
| 1,395,517 | | |
$ | 9,557 | | |
$ | 11,879 | | |
$ | 12,724 | | |
|
| | |
| |
| |
| |
| |
| |
| |
| | | |
| | | |
| | | |
| | | |
|
| TOTAL CONSOLIDATED PORTFOLIO/WEIGHTED
AVERAGE | |
| |
| |
| |
96.5% Leased (4) | |
| 42,270,023 | | |
$ | 334,914 | | |
$ | 384,989 | | |
$ | 891,325 | | |
|
Footnotes
| 1 | Square foot leased or available. |
| 2 | Twelve months ended 12/31/2015 cash rent. |
| 3 | Twelve months ended 12/31/2015 GAAP rent. |
| 4 | Consolidated portfolio is 96.8% leased, excluding property owned subject to a mortgage in default. |
| 5 | Tenant terminated its lease effective 1/31/2017 for a cash payment of $3.5 million. |
| 6 | Lexington has a 71.1% interest in this property. |
| 7 | Subsequent to 12/31/2015, lease extended to 05/2021. |
| 8 | Multi-tenant properties are properties less than 50% leased to a single tenant. |
| 9 | Tenant terminated its lease effective 6/30/2017 for a cash payment of $0.4 million. |
| 10 | Educational Policy Improvement Center lease for 10,791 square feet expires 11/2019; however, space is then leased to Oregon
Research Institute through 11/2027. |
| 11 | Cash and GAAP rent amounts represent/include prior tenant. |
| 12 | 21,365 square feet is leased to 7/31/2025. |
| 13 | Tenant terminated its lease effective 7/8/2016 for a cash payment of $1.5 million. |
| 14 | The multi-tenanted properties incurred approximately $6.1 million in operating expenses, net for the twelve months ended 12/31/2015. |
| 15 | Heidelberg Americas, Inc. lease expires 3/30/2021, however, new tenant (Goss International Americas, Inc.) lease expires 3/30/2026. |
| 16 | Tenant terminated its lease effective 1/31/2017 for a cash payment of $2.0 million received in July 2015 and an additional
$2.0 million is due in 2017. |
| 17 | Assignee of LG-39 Ground Tenant LLC. |
| 18 | TD Auto Finance LLC lease rent terminated effective 2/29/2016 for a payment estimated to be $7.7 million to be paid by 4/30/2016.
New lease with Charles Schwab & Co. Inc. estimated to commence 3/1/2016. |
| 19 | Americold Logistics, LLC lease terminated effective 4/15/2016 for $1.0 million to be paid over an 18 month period. New lease
with United States Cold Storage, Inc. commences 4/15/2016. |
| 20 | Tenant exercised purchase option for $13.6 million. Property classified as held for sale. |
| 21 | ConAgra Foods, Inc. provides credit support. |
| 22 | Property classified as held for sale. |
| 23 | Subsequent to 12/31/2015, lease extended to 08/2026. |
| 24 | Subsequent to 12/31/2015, lease extended to 12/2019. |
| LEXINGTON REALTY TRUST |
| Select Credit Metrics Summary |
| | |
2011 | | |
2012 | | |
2013 | | |
2014 | | |
2015 | |
| | |
| | |
| | |
| | |
| | |
| |
| Company FFO Payout Ratio | |
| 48.5 | % | |
| 56.1 | % | |
| 60.3 | % | |
| 60.8 | % | |
| 61.8 | % |
| | |
| | | |
| | | |
| | | |
| | | |
| | |
| Unencumbered Assets (1)(2) | |
$ | 1.15 billion | | |
$ | 1.76 billion | | |
$ | 2.59 billion | | |
$ | 2.87 billion | | |
$ | 3.30 billion | |
| | |
| | | |
| | | |
| | | |
| | | |
| | |
| Unencumbered NOI (1) | |
| 25.9 | % | |
| 34.5 | % | |
| 55.3 | % | |
| 59.9 | % | |
| 69.2 | % |
| | |
| | | |
| | | |
| | | |
| | | |
| | |
| (Debt + Preferred) / Gross Assets | |
| 48.7 | % | |
| 46.6 | % | |
| 43.0 | % | |
| 44.0 | % | |
| 45.9 | % |
| | |
| | | |
| | | |
| | | |
| | | |
| | |
| Debt/Gross Assets | |
| 40.9 | % | |
| 41.1 | % | |
| 41.1 | % | |
| 42.0 | % | |
| 44.0 | % |
| | |
| | | |
| | | |
| | | |
| | | |
| | |
| Market Cap Leverage | |
| 52.5 | % | |
| 46.6 | % | |
| 45.4 | % | |
| 43.7 | % | |
| 52.5 | % |
| | |
| | | |
| | | |
| | | |
| | | |
| | |
| Secured Debt / Gross Assets (1) | |
| 31.9 | % | |
| 30.9 | % | |
| 23.9 | % | |
| 19.0 | % | |
| 17.7 | % |
| | |
| | | |
| | | |
| | | |
| | | |
| | |
| Net Debt / EBITDA (4) | |
| 5.5 | x | |
| 6.5 | x | |
| 6.4 | x | |
| 5.7 | x | |
| 6.7 | x |
| | |
| | | |
| | | |
| | | |
| | | |
| | |
| (Net Debt + Preferred) / EBITDA (4) | |
| 6.6 | x | |
| 7.3 | x | |
| 6.7 | x | |
| 6.0 | x | |
| 7.0 | x |
| | |
| | | |
| | | |
| | | |
| | | |
| | |
| Credit Facilities Availability (3) | |
$ | 294.3 million | | |
$ | 296.3 million | | |
$ | 443.4 million | | |
$ | 385.4 million | | |
$ | 223.0 million | |
| | |
| | | |
| | | |
| | | |
| | | |
| | |
| Development / Gross Assets | |
| 0.9 | % | |
| 1.6 | % | |
| 1.6 | % | |
| 2.4 | % | |
| 2.1 | % |
| | |
| | | |
| | | |
| | | |
| | | |
| | |
| EBITDA / Revenue (4) | |
| 77.0 | % | |
| 76.5 | % | |
| 74.4 | % | |
| 71.8 | % | |
| 71.8 | % |
| | |
| | | |
| | | |
| | | |
| | | |
| | |
| EBITDA / (PrefDiv + Interest Expense) (4) | |
| 2.3 | x | |
| 2.4 | x | |
| 3.1 | x | |
| 3.1 | x | |
| 3.3 | x |
| | |
| | | |
| | | |
| | | |
| | | |
| | |
| (JV + Advisory Income or (loss)) / Revenues | |
| 8.5 | % | |
| 4.4 | % | |
| 0.5 | % | |
| 0.4 | % | |
| 0.4 | % |
Footnotes:
| (1) | Revolving credit facility and term loans are currently unsecured thus all periods reflect such borrowings as unsecured. |
| (2) | Includes loans receivable. |
| (3) | Subject to covenant compliance. |
| (4) | EBITDA is defined as GAAP net income (loss) adjusted for (i) interest expense, (ii) income tax expense (benefit), (iii) depreciation
and amortization, (iv) gains and impairments relating to assets, (v) debt satisfaction charges (gains), (vi) the impact of straight-line
rent on contractual lease terms, excluding tenant lease termination adjustments, (vii) above and below market lease amortization,
(viii) non-cash charges and gains, (ix) minority interests, net, (x) equity in earnings of non-consolidated entities, and (xi)
our share of EBITDA for non-consolidated entities calculated in the same manner. |
| LEXINGTON REALTY TRUST |
| FINANCIAL COVENANTS (1) |
| Corporate Level Debt |
| Bank
Loans: |
|
Must be: |
|
12/31/2015 |
| |
|
|
|
|
| Maximum Leverage |
|
< 60% |
|
48.4% |
| Fixed Charge Coverage |
|
> 1.5X |
|
2.6X |
| Recourse Secured Indebtedness Ratio |
|
< 10% cap value |
|
0.0% |
| Secured Indebtedness Ratio |
|
< 45% |
|
20.1% |
| Unsecured Debt Service Coverage |
|
> 2.0X |
|
4.7X |
| Unencumbered Leverage |
|
< 60% |
|
40.5% |
| |
|
|
|
|
| Bonds: |
|
|
|
|
| |
|
|
|
|
| Debt to Total Assets |
|
< 60% |
|
45.0% |
| Secured Debt to Total Assets |
|
< 40% |
|
18.1% |
| Debt Service Coverage |
|
> 1.5X |
|
4.0X |
| Unencumbered Assets to Unsecured Debt |
|
> 150% |
|
263.5% |
Footnotes
| (1) | As defined in respective loan/bond agreements. |
LEXINGTON REALTY TRUST
Consolidated Properties: Mortgages
and Notes Payable
12/31/2015
| Property | |
Footnotes | |
Debt
Balance
($000) | | |
Interest
Rate
(%) | | |
Maturity (a) | |
Current
Estimated
Annual Debt
Service ($000)
(d) | | |
Balloon
Payment
($000) | |
| Mortgages with Balloons | |
| |
| | | |
| | | |
| |
| | | |
| | |
| Temple, TX | |
(o) | |
$ | 7,463 | | |
| 6.090 | % | |
01/2016 | |
$ | 22 | | |
$ | 7,463 | |
| Bridgewater, NJ | |
(b) | |
| 14,118 | | |
| 5.732 | % | |
03/2016 | |
| 1,443 | | |
| 14,118 | |
| Omaha, NE | |
| |
| 7,608 | | |
| 5.610 | % | |
04/2016 | |
| 192 | | |
| 7,560 | |
| Bremerton, WA | |
| |
| 5,534 | | |
| 6.090 | % | |
04/2016 | |
| 97 | | |
| 5,479 | |
| Tempe, AZ | |
| |
| 7,185 | | |
| 5.610 | % | |
04/2016 | |
| 181 | | |
| 7,140 | |
| Byhalia, MS | |
(j) | |
| 15,000 | | |
| 4.710 | % | |
06/2016 | |
| 361 | | |
| 15,000 | |
| Lisle, IL | |
| |
| 9,449 | | |
| 6.500 | % | |
06/2016 | |
| 383 | | |
| 9,377 | |
| Farmers Branch, TX | |
| |
| 18,380 | | |
| 5.939 | % | |
07/2016 | |
| 663 | | |
| 18,363 | |
| Glenwillow, OH | |
| |
| 15,326 | | |
| 6.130 | % | |
09/2016 | |
| 907 | | |
| 15,132 | |
| Plymouth, IN | |
| |
| 5,807 | | |
| 6.315 | % | |
09/2016 | |
| 362 | | |
| 5,723 | |
| Tomball, TX | |
| |
| 8,373 | | |
| 6.063 | % | |
11/2016 | |
| 592 | | |
| 8,041 | |
| Memphis, TN | |
| |
| 3,555 | | |
| 5.710 | % | |
01/2017 | |
| 275 | | |
| 3,484 | |
| Huntington, WV | |
| |
| 6,500 | | |
| 4.150 | % | |
02/2017 | |
| 270 | | |
| 6,500 | |
| Orlando, FL | |
| |
| 9,471 | | |
| 5.722 | % | |
02/2017 | |
| 696 | | |
| 9,309 | |
| Dubuque, IA | |
| |
| 9,055 | | |
| 5.402 | % | |
06/2017 | |
| 733 | | |
| 8,727 | |
| Shreveport, LA | |
| |
| 19,000 | | |
| 5.690 | % | |
07/2017 | |
| 1,099 | | |
| 19,000 | |
| McDonough, GA | |
| |
| 22,224 | | |
| 6.110 | % | |
11/2017 | |
| 1,674 | | |
| 21,651 | |
| Erwin, NY | |
| |
| 7,887 | | |
| 5.910 | % | |
10/2018 | |
| 728 | | |
| 6,637 | |
| Boston, MA | |
| |
| 12,302 | | |
| 6.100 | % | |
12/2018 | |
| 996 | | |
| 11,520 | |
| Overland Park, KS | |
| |
| 34,134 | | |
| 5.891 | % | |
05/2019 | |
| 2,657 | | |
| 31,812 | |
| Kansas City, MO | |
| |
| 16,271 | | |
| 5.883 | % | |
05/2019 | |
| 1,268 | | |
| 15,179 | |
| Columbus, IN | |
| |
| 20,986 | | |
| 2.210 | % | |
07/2019 | |
| 4,757 | | |
| 4,993 | |
| Meridian, ID | |
| |
| 9,322 | | |
| 6.010 | % | |
08/2019 | |
| 753 | | |
| 7,675 | |
| Streetsboro, OH | |
| |
| 17,626 | | |
| 5.749 | % | |
09/2019 | |
| 1,344 | | |
| 16,338 | |
| Lenexa, KS | |
| |
| 9,463 | | |
| 6.270 | % | |
12/2019 | |
| 774 | | |
| 7,770 | |
| Boca Raton, FL | |
| |
| 19,624 | | |
| 6.470 | % | |
02/2020 | |
| 1,542 | | |
| 18,414 | |
| Oakland, ME | |
| |
| 8,850 | | |
| 5.930 | % | |
10/2020 | |
| 750 | | |
| 7,660 | |
| Lavonia, GA | |
| |
| 7,676 | | |
| 5.460 | % | |
12/2020 | |
| 741 | | |
| 5,895 | |
| Charleston, SC | |
| |
| 7,185 | | |
| 5.850 | % | |
02/2021 | |
| 520 | | |
| 6,632 | |
| Whippany, NJ | |
| |
| 13,700 | | |
| 6.298 | % | |
11/2021 | |
| 1,344 | | |
| 10,400 | |
| New York, NY | |
| |
| 29,193 | | |
| 4.100 | % | |
01/2025 | |
| 1,217 | | |
| 29,193 | |
| Chester, SC | |
| |
| 8,738 | | |
| 5.380 | % | |
08/2025 | |
| 1,144 | | |
| 362 | |
| Richland, WA | |
| |
| 110,000 | | |
| 4.000 | % | |
01/2026 | |
| 4,400 | | |
| 99,492 | |
| New York, NY | |
(e) | |
| 213,301 | | |
| 4.660 | % | |
01/2027 | |
| 10,260 | | |
| 200,632 | |
| Lenexa, KS | |
| |
| 36,666 | | |
| 3.700 | % | |
11/2027 | |
| 3,026 | | |
| 10,000 | |
| Subtotal/Wtg. Avg./Years Remaining (l) | |
| |
$ | 766,972 | | |
| 4.990 | % | |
6.6 | |
$ | 48,171 | | |
$ | 672,671 | |
LEXINGTON REALTY TRUST
Consolidated Properties: Mortgages
and Notes Payable
12/31/2015
| Property | |
Footnotes | |
Debt
Balance
($000) | | |
Interest
Rate
(%) | | |
Maturity (a) | |
Current
Estimated
Annual Debt
Service ($000)
(d) | | |
Balloon
Payment
($000) | |
| | |
| |
| | |
| | |
| |
| | |
| |
| Full Amortizing Mortgages | |
| |
| | | |
| | | |
| |
| | | |
| | |
| Lorain, OH | |
| |
| 1,181 | | |
| 7.750 | % | |
07/2018 | |
| 499 | | |
| - | |
| Manteca, CA | |
| |
| 834 | | |
| 7.750 | % | |
07/2018 | |
| 353 | | |
| - | |
| Watertown, NY | |
| |
| 785 | | |
| 7.750 | % | |
07/2018 | |
| 332 | | |
| - | |
| Fairlea, WV | |
| |
| 551 | | |
| 7.750 | % | |
07/2018 | |
| 233 | | |
| - | |
| San Diego, CA | |
| |
| 532 | | |
| 7.750 | % | |
07/2018 | |
| 225 | | |
| - | |
| Galesburg, IL | |
| |
| 468 | | |
| 7.750 | % | |
07/2018 | |
| 198 | | |
| - | |
| North Berwick, ME | |
| |
| 4,810 | | |
| 3.560 | % | |
04/2019 | |
| 1,532 | | |
| - | |
| Wall, NJ | |
| |
| 17,536 | | |
| 6.250 | % | |
01/2021 | |
| 3,774 | | |
| - | |
| Palo Alto, CA | |
| |
| 48,512 | | |
| 3.970 | % | |
12/2023 | |
| 7,059 | | |
| - | |
| Long Island City, NY | |
| |
| 49,144 | | |
| 3.500 | % | |
03/2028 | |
| 4,538 | | |
| - | |
| | |
| |
| | | |
| | | |
| |
| | | |
| | |
| Subtotal/Wtg. Avg./Years Remaining (l) | |
| |
$ | 124,353 | | |
| 4.222 | % | |
8.8 | |
$ | 18,743 | | |
$ | - | |
| | |
| |
| | | |
| | | |
| |
| | | |
| | |
| Subtotal/Wtg. Avg./Years Remaining (l) | |
| |
$ | 891,325 | | |
| 4.883 | % | |
6.9 | |
$ | 66,914 | | |
$ | 672,671 | |
| | |
| |
| | | |
| | | |
| |
| | | |
| | |
| Corporate (k) | |
| |
| | | |
| | | |
| |
| | | |
| | |
| Revolving Credit Facility | |
(p) | |
$ | 177,000 | | |
| 1.260 | % | |
08/2019 | |
$ | 2,261 | | |
$ | 177,000 | |
| Term Loan | |
(m) | |
| 250,000 | | |
| 2.192 | % | |
08/2020 | |
| 5,556 | | |
| 250,000 | |
| Term Loan | |
(n) | |
| 255,000 | | |
| 2.523 | % | |
01/2021 | |
| 6,523 | | |
| 255,000 | |
| Senior Notes | |
(h) | |
| 250,000 | | |
| 4.250 | % | |
06/2023 | |
| 10,625 | | |
| 250,000 | |
| Senior Notes | |
(f) | |
| 250,000 | | |
| 4.400 | % | |
06/2024 | |
| 11,000 | | |
| 250,000 | |
| Convertible Notes | |
(i)(c) | |
| 12,400 | | |
| 6.000 | % | |
01/2030 | |
| 744 | | |
| 12,400 | |
| Trust Preferred Notes | |
(g) | |
| 129,120 | | |
| 6.804 | % | |
04/2037 | |
| 8,785 | | |
| 129,120 | |
| Subtotal/Wtg. Avg./Years Remaining (l) | |
| |
$ | 1,323,520 | | |
| 3.423 | % | |
7.4 | |
$ | 45,494 | | |
$ | 1,323,520 | |
| Total/Wtg. Avg./Years Remaining (l) | |
| |
$ | 2,214,845 | | |
| 4.010 | % | |
7.2 | |
$ | 112,408 | | |
$ | 1,996,191 | |
Footnotes
| (a) | Subtotal and total based on weighted-average term to maturity (or put dates) shown in years based on debt balance. |
| (c) | Represents full payable of notes; discount of $220 excluded from balance. |
| (d) | Remaining payments for debt with less than 12 months to maturity, all others are debt service for next 12 months. |
| (e) | Loan is cross-collateralized on three properties. |
| (f) | Represents full payable of notes; discount of $247 excluded from balance. |
| (g) | Rate fixed through 04/2017; thereafter, LIBOR plus 170 bps. |
| (h) | Represents full payable of notes; discount of $1,806 excluded from balance. |
| (i) | Holders have the right to redeem the notes on 01/15/17, 01/15/20 and 01/15/25. |
| (j) | Property was expanded. Mortgage is recourse during expansion and Lexington was not released from the guaranty as of 12/31/2015. |
| (l) | Total shown may differ from detailed amounts due to rounding. |
| (m) | Rate ranges from LIBOR plus 0.90% to 1.75%. LIBOR rate fixed at 1.09% through February 2018 via interest rate swap agreements. |
| (n) | Rate ranges from LIBOR plus 0.90% to 1.75%. LIBOR rate fixed at 1.42% through January 2019 via interest rate swap agreements. |
| (o) | Subsequent to 12/31/2015, loan is in default. |
| (p) | Rate ranges from LIBOR plus 0.85% and 1.55%. |
| LEXINGTON REALTY TRUST |
| Non- Consolidated Investments: Mortgages & Notes Payable |
| 12/31/2015 |
| Joint
Venture | |
Debt
Balance
($000) | | |
LXP
Proportionate
Share
($000) (3) | | |
Interest
Rate
(%) | | |
Maturity | | |
Current
Estimated Annual
Debt Service
($000) | | |
Balloon
Payment
($000) | | |
Proportionate
Share Balloon
Payment
($000) (3) | |
| Rehab Humble Lessee | |
$ | 14,359 | | |
$ | 2,154 | | |
| 4.700 | % | |
05/2017 | |
$ | 950 | | |
$ | 13,982 | | |
$ | 2,097 | |
| Gan Palm Beach Lessee | |
| 14,471 | | |
| 3,618 | | |
| 3.700 | % | |
03/2018 | |
| 842 | | |
| 13,768 | | |
| 3,442 | |
| BP Lessee | |
| 18,791 | | |
| 2,819 | | |
| 4.010 | % | |
11/2018 | |
| 764 | | |
| 18,791 | | |
| 2,819 | |
| Total/Wtg.
Avg. (1)/Years Remaining (2) | |
$ | 47,621 | | |
$ | 8,591 | | |
| 4.052 | % | |
| 2.2 | | |
$ | 2,556 | | |
$ | 46,541 | | |
$ | 8,358 | |
Footnotes
| (1) | Weighted-average interest rate based on proportionate share. |
| (2) | Weighted-average years remaining on maturities based on proportionate debt balance. |
| (3) | Total balance shown may differ from detailed amounts due to rounding. |
| LEXINGTON REALTY TRUST |
| Debt Maturity Schedule |
| 12/31/2015 |
| ($000) |
| Consolidated Properties |
| Year | |
Mortgage
Scheduled
Amortization | | |
Mortgage
Balloon Payments | | |
Corporate Debt | |
| 2016 | |
$ | 26,465 | | |
$ | 113,396 | | |
$ | - | |
| 2017 | |
| 26,834 | | |
| 68,671 | | |
| 12,400 | |
| 2018 | |
| 26,507 | | |
| 18,157 | | |
| - | |
| 2019 | |
| 22,580 | | |
| 83,767 | | |
| 177,000 | |
| 2020 | |
| 18,787 | | |
| 31,969 | | |
| 250,000 | |
| | |
$ | 121,173 | | |
$ | 315,960 | | |
$ | 439,400 | |
| Non-Consolidated Investments - LXP Proportionate Share | |
| Year | |
Mortgage
Scheduled
Amortization | | |
Mortgage
Balloon Payments | | |
| |
| 2016 | |
$ | 118 | | |
$ | - | | |
| | |
| 2017 | |
| 94 | | |
| 2,097 | | |
| | |
| 2018 | |
| 21 | | |
| 6,261 | | |
| | |
| 2019 | |
| - | | |
| - | | |
| | |
| 2020 | |
| - | | |
| - | | |
| | |
| | |
$ | 233 | | |
$ | 8,358 | | |
| | |

Footnotes
| (1) | Percentage denotes weighted-average interest rate. |
| LEXINGTON REALTY TRUST |
| Mortgage Loans Receivable |
| 12/31/2015 |
| Collateral | |
| | |
| | |
| |
Current | | |
| |
| | |
City | |
State | |
Loan Balance ($000)(1) | | |
Interest
Rate | | |
Maturity
Date | |
Estimated
Annual
Debt Service
($000)(2) | | |
Balloon Payment
($000) | |
| Office | |
Oklahoma City (3) | |
OK | |
$ | 8,501 | | |
| 11.50 | % | |
03/2016 | |
$ | 323 | | |
$ | 8,420 | |
| Retail | |
Various | |
Various | |
| 895 | | |
| 8.00 | % | |
02/2021 | |
| 219 | | |
| - | |
| | |
Various | |
Various | |
| 418 | | |
| 8.00 | % | |
12/2021 | |
| 94 | | |
| - | |
| | |
Various | |
Various | |
| 552 | | |
| 8.00 | % | |
03/2022 | |
| 112 | | |
| - | |
| Hospital | |
Kennewick | |
WA | |
| 85,505 | | |
| 9.00 | % | |
05/2022 | |
| 7,438 | | |
| 87,245 | |
| | |
Total Mortgage Loans Receivable | |
$ | 95,871 | | |
| | | |
| |
$ | 8,186 | | |
$ | 95,665 | |
Footnotes
| (1) | Includes accrued interest receivable, loan losses, and
net origination fees. |
| (2) | Remaining collections for debt less than 12 months to
maturity, all others are debt service for next 12 months. |
| (3) | Short-term loan to joint venture partner. |
| LEXINGTON REALTY TRUST |
| Partnership Interests |
| Twelve months ended December 31, 2015 |
| ($000) |
| Noncontrolling Interest Properties - Partners' Proportionate Share (1) | |
| |
| | |
| |
| EBITDA | |
$ | 193 | |
| Interest expense | |
$ | 23 | |
| Depreciation and amortization | |
$ | 245 | |
| | |
| | |
| Non-Consolidated Net Leased Real Estate - Lexington's Share | |
| | |
| | |
| | |
| EBITDA | |
$ | 3,675 | |
| Interest expense | |
$ | 510 | |
Footnotes
| (1) | Excludes OP unit noncontrolling interests. |
| LEXINGTON REALTY TRUST |
| Selected Balance Sheet and Income Statement Account Data |
| 12/31/2015 |
| ($000) |
| Balance Sheet | |
| |
| | |
| |
| Other assets | |
$ | 18,505 | |
| | |
| | |
| The components of other assets are: | |
| | |
| | |
| | |
| Deposits | |
$ | 2,796 | |
| Equipment | |
| 727 | |
| Prepaids | |
| 890 | |
| Other receivables | |
| 784 | |
| Deferred lease incentives | |
| 13,120 | |
| Deferred tax asset | |
| 59 | |
| Interest rate swap derivative asset | |
| 4 | |
| Other | |
| 125 | |
| | |
| | |
| Accounts payable and other liabilities | |
| | |
| | |
| | |
| The components of accounts payable and other liabilities are: | |
$ | 41,479 | |
| | |
| | |
| Accounts payable and accrued expenses | |
$ | 16,883 | |
| CIP accruals and other | |
| 4,282 | |
| Taxes | |
| 2,062 | |
| Deferred lease and loan costs | |
| 4,904 | |
| Deposits | |
| 1,192 | |
| Escrows | |
| 1,091 | |
| Transaction / build-to-suit costs | |
| 9,122 | |
| Interest rate swap derivative liability | |
| 1,943 | |
| | |
| | |
| Income Statement - Twelve months ended December 31, 2015 | |
| | |
| | |
| | |
| Non-cash interest expense, net | |
$ | (1,371 | ) |
Investor Information
| Computershare |
Overnight Correspondence: |
| PO Box 30170 |
211 Quality Circle, Suite 210 |
| College Station, TX 77842-3170 |
College Station, TX, 77845 |
| (800) 850-3948 |
|
| www-us.computershare.com/investor |
|
| Heather Gentry |
|
| Senior Vice President, Investor Relations |
| Telephone (direct) |
(212) 692-7219 |
| Facsimile (main) |
(212) 594-6600 |
| E-mail |
hgentry@lxp.com |
| Bank of America/Merrill Lynch |
|
|
Ladenburg Thalmann & Co., Inc. |
|
| James Feldman |
(646) 855-5808 |
|
Daniel P. Donlan |
(212) 409-2056 |
| |
|
|
|
|
| Barclays Capital |
|
|
Stifel Nicolaus |
|
| Ross L. Smotrich |
(212) 526-2306 |
|
John W. Guinee |
(443) 224-1307 |
| |
|
|
|
|
| Evercore Partners |
|
|
Wells Fargo Securities, LLC |
|
| Sheila K. McGrath |
(212) 497-0882 |
|
Todd J. Stender |
(212) 214-8067 |
| |
|
|
|
|
| J.P. Morgan Chase |
|
|
Jeffries & Company, Inc. |
|
| Anthony Paolone |
(212) 622-6682 |
|
Omotayo Okusanya |
(212) 336-7076 |
| |
|
|
|
|
| KeyBanc Capital Markets Inc. |
|
|
|
|
| Craig Mailman |
(917) 368-2316 |
|
|
|
Exhibit 99.2
Lexington Realty Trust – UNEDITED
TRANSCRIPT
Q4 2015 Earnings Call
Company Participants
T. Wilson Eglin, Chief Executive Officer and President
E. Robert Roskind, Chairman
Richard J. Rouse, Vice Chairman and Chief Investment Officer
Patrick F. Carroll, Chief Financial Officer
Heather Gentry, Senior Vice President of Investor Relations
Operator:
Greetings and welcome to the Lexington Realty Trust fourth quarter 2015 earnings conference call. (Operator Instructions) I would
now like to turn the call over to your host, Heather Gentry, Vice President of Investor Relations at Lexington Realty Trust. Thank
you, you may now begin.
Heather Gentry:
Thank you Operator. Good morning and welcome to the Lexington Realty Trust fourth quarter 2015 conference call. The earnings press
release was distributed over the wire this morning and the release and supplemental disclosure package will be furnished on a Form
8-K.
In the press release and supplemental disclosure package, Lexington
has reconciled all historical non-GAAP financial measures to the most directly comparable GAAP measure in accordance with Reg.
G requirements. If you did not receive a copy, these documents are available on Lexington's website at www.lxp.com in the Investor
Relations section. Additionally, we are hosting a live webcast of today's call, which you can access in the same section of our
website.
At this time we would like to inform you that certain statements
made during this conference call which are not historical may constitute forward-looking statements within the meaning of the Private
Securities Litigation Reform Act of 1995. Although Lexington believes the expectations reflected in any forward-looking statements
are based on reasonable assumptions, Lexington can give no assurance that its expectations will be attained.
Factors and risks that could cause actual results to differ
materially from those expressed or implied by forward-looking statements are detailed in today's press release and from time to
time in Lexington's filings with the SEC and include the successful consummation of any lease, acquisition, build to suit, financing,
disposition or other transaction for the final terms of any such transaction.
Except as required by law, Lexington does not undertake a duty
to update any forward-looking statements. Operating performance measures of an individual investment are not presented or intended
to be the liquidity or performance measures that present a numerical measure of Lexington's historical or future financial performance,
financial position or cash flows.
Joining me today from management are Will Eglin, Chief Executive
Officer; Robert Roskind, Chairman; Dick Rouse, Vice Chairman and Chief Investment Officer; Pat Carroll, Chief Financial Officer;
Beth Boulerice, Chief Accounting Officer and other members of management. Now I will turn call over to Will.
Will Eglin:
Thanks, Heather, and welcome everyone and thank you for joining the call today.
I would like to begin by reviewing our operating results and
accomplishments for the quarter and the full-year. For the fourth quarter of 2015, Company funds from operations were $0.29 per
share which brought our total for the year to $1.10 per share. These were very strong results in relation to our guidance of $1.05
to $1.07 per share as updated in November and reflects better than expected execution in all aspects of our business including
the early closing of acquisitions, share repurchases and lower general and administrative costs.
We provided initial 2016 Company FFO guidance this morning in
the range of $1.00 to $1.10 per share. As you may recall from our third-quarter 2015 call, we discussed the possibility of monetizing
our New York City ground investments which generate very high FFO due to GAAP revenue recognition over the life of the 99 year
leases. We have begun marketing these assets for sale and the midrange of guidance assumes that they are sold as of June 30, 2016,
at a sub 5% cap rate.
While the 2016 Company FFO guidance we initiated today represents
a decrease compared to 2015 Company FFO, we expect our underlying cash flows to remain strong in 2016 due to reduced capital expenditures,
share repurchases, accretion from investment activity in 2015, the redeployment of sale proceeds from the potential New York City
ground sale, scheduled rent escalation and refinancing savings. More details on our underlying guidance assumptions will be discussed
later and the call.
Overall we had a good quarter of leasing and executed new leases
and lease extensions of approximately 900,000 square feet ending the quarter 96.8% leased. Renewal rents during the quarter were
essentially flat on both a cash and GAAP basis. Subsequent to quarter end, we have completed approximately 700,000 square feet
of lease extensions.
On the investment front in the fourth quarter we invested approximately
$45.4 million in ongoing build to suit projects and $2.1 million for Gateway Plaza, a build to suit in Richmond, Virginia with
an initial basis of approximately $101 million. This building which we acquired in December 2015 is the new headquarters for the
McGuire Woods Law Firm.
We recently closed on a $57.5 million mortgage on this property
at a fixed rate of 5.2% and a 15 year term to maturity. The cash-on-cash yield is expected to be about 12% in the first year and
the 15 year financing should generate a very attractive internal rate of return.
During the fourth quarter we also acquired the newly constructed
preferred Freezer industrial facility in Washington state for $152 million and obtain $110 million of 10 year mortgage financing
at a fixed rate of 4%. Our cash from cash return this year on this investment will be about 15% and we have very strong credit
quality underlying the lease on this state-of-the-art facility.
Also during the fourth quarter we committed to acquire and finance
the construction of a new six-story 201,000 square-foot class A office property in Charlotte, North Carolina for an estimated maximum
cost of approximately $62 million. This property will be the headquarters for Avid Exchange, a fast-growing financial technology
provider of accounts payable and payment automation. The going in cap rate on this 15 year lease is expected to be 8.3% and there
are annual rent escalations of approximately 2%.
Overall, in 2015 we invested $516 million closing $483 million
of investments which will produce approximately $41.7 million of annual GAAP revenue in 2016. The average initial cap rate on these
investments is 7.4% with a weighted average lease term of approximately 18 years and rent escalation that averaged 2% per year.
Subsequent to quarter end, we closed on a newly constructed
190,000 square-foot industrial facility in Detroit, Michigan for $29.7 million, with expected cash and estimated GAAP yield of
7.4%. The property is 100% leased for a 20 year term to Fiat Chrysler Automobiles. This adds another strong tenant to our portfolio
in an industry that continues to perform well.
We disposed of one property in the quarter which brought our
total disposition volume for the year to $265.2 million. This activity remains consistent with our portfolio management and capital
recycling objectives which include reducing our exposure to suburban office properties in certain markets, monetizing multi tenant
properties upon stabilization of occupancy, selling vacant properties and transitioning the portfolio so that more revenue is derived
from long-term leases.
The average cap rate on properties we disposed of in 2015 was
6.3% which proved to be accretive compared to our 2015 acquisition cap rate of 7.4%. We continue to see steady volume of opportunities
on the investment front but we remain disciplined and cautious on pricing recognizing that our own shares offer an unusually compelling
value at this point in the cycle compared to many other investment choices.
In July we announced a share repurchase program of up to 10
million common shares inclusive of all outstanding prior authorizations. During the fourth quarter approximately 900,000 shares
were repurchased at an average price of $8.12 per share. To date we have repurchased approximately 3.2 million shares at an average
price of $8.05 per share which includes just under $1 million additional shares repurchased in 2016 at an average price of $7.48
per share. Our plan is to continue to execute on share repurchases in the context of our overall capital plan and to the extent
market volatility offers a meaningful disconnect between our share price and net asset value per share as it does now.
We still find build to suit transactions our most attractive
property investment option because there is less competition in this market and a corresponding higher probability for us to garner
a yield premium. As a result, we could add to our 2017 acquisition pipeline if we find the right opportunity.
Looking at the year ahead, we expect to be a net seller of property
in 2016 and we have done considerable work on refining our disposition program to achieve our objectives which include the sale
of some vacant and multi tenant buildings, the monetization of our New York City ground parcels in a sale or joint venture, and
the sale of other single tenant properties.
Our current sell programs includes up to 30 properties with
expected proceeds ranging from $600 million to $700 million and representing an average cap rate range of 5.75% to 6.5%. These
properties are encumbered by approximately $300 million of mortgage debt so the 2016 disposition program would net between approximately
$300 million and $400 million excluding transaction costs to be used to fund our investment commitments, retire debt, repurchase
stock or acquire properties. We can give no assurances that we will meet these objectives or the timeframe to complete the program.
With regard to our leasing outlook, as a result of our proactive
approach, our current 2016 expirations comprise just 3.6% of our revenue and total 2.1 million square feet. In addition we have
active lease negotiations underway on approximately 1.5 million square feet and expect to be able to report progress throughout
the year.
In general, our markets remain strong in terms of the balance
of supply and demand and we believe that our negotiating position on most lease renewals is stronger than it was a year ago.
Given the ongoing volatility in the energy industry, I want
to give some color on the Houston, Texas market as well as our exposure. General occupancies in Houston for both office and industrial
properties is north of 86% although additional supply is coming into the market in 2016 which could cause higher vacancy going
forward.
We presently own six office properties, two industrial properties,
two infrastructure properties and one specialty property would generate approximately $21.5 million of annual cash revenue and
have a weighted average lease term of approximately 13.6 years. In addition we have a joint venture investment involving a build
to suit private school in Houston.
We have no leases expiring in 2016 and only one lease expiration
in 2017 with Transocean a drilling company who exercised its early termination option in December. This 155,000 square-foot space
is currently being marketed for lease and while this could prove challenging, we do not expect any material impact given the size
of our portfolio. Other than that, we see no near term risk to occupancy in our Houston portfolio.
At year-end 2015 we had four million square feet of space which
is vacant or subject to leases that expire through 2016. We believe that by the end of 2016 we can address roughly 21% of expiring
or vacant square footage through disposition and our guidance assumes 19% is addressed through leasing. We continue to manage down
our shorter-term leases and extend our weighted average lease term which is now approximately 12.6 years on a cash basis and 9.1
years after adjusting our New York City ground parcels lease term to their first purchase option.
Looking past 2016, we believe our overall lease maturity schedule
is well staggered which provides us with cash flow stability. Each of these metrics is an important measure of cash flow stability
and we will continue to focus on further improvement. Additionally, approximately 80% of our revenue is from leases with built-in
escalations which bodes well for long-term cash flow growth.
We had great success in 2015 taking advantage of opportunities
to enhance our balance sheet. As a result, we were able to achieve significant savings from refinancing our bank lending facilities
and extending the maturities of our two term loans and revolving credit facility by two years.
Our refinancing efforts have extended our weighted average debt
maturity to 7.2 years, lowered our weighted average borrowing cost by 50 basis points to 4% and increased our unencumbered assets
to now represent approximately 69% of net operating income.
We continue to focus on maintaining maximum balance sheet flexibility
to access which ever source of capital is most advantageous. Our 2016 mortgage maturities total $113 million and a have weighted
average interest rate of 5.8% representing further opportunity to unencumber assets and lower our financing cost. We expect to
lock in long-term financing this year with the objective of substantially paying down a revolving credit facility which presently
has $177 million outstanding.
Before turning the call over to Pat I would like to sum up where
we expect to be by year-end. We expect sources of capital from sales and new long-term financing to total between $785 million
and $885 million which will be used to retire $375 million of mortgage debt, fund $265 million of investment commitments and pay
transaction costs with the balance available to repurchase stock, invest elsewhere or retire bank debt.
We expect portfolio occupancy to stay strong throughout 2016
and we are comfortable with the portfolio percentage lease target for year-end of approximately 96% to 97%. A successful execution
of our current plan should reduce our leverage, generate a high level of company funds from operations and company funds from operations
per share in relation to our dividend and share price and meaningfully upgrade our portfolio.
Now I'll turn the call over to Pat who will review our financial
results in more detail.
Pat Carroll:
Thanks, Will. Prior to discussing our quarterly and annual results, I just want to point out that a new FASB rule went into effect
in 2015 so property sales are no longer reclassified to discontinued operations on the income statement. So income statement fluctuations
between periods generally relate to this new FASB requirement.
During the quarter we had gross revenues of $106.6 million comprised
primarily of lease rents and tenant reimbursements. The decrease compared to the fourth quarter of 2014 of $1.2 million relates
primarily to the sales of property and changes in occupancy and lease terms offset in part by acquisition and build to suit projects
coming online. For the year revenues increased to $430.8 million compared to $423.8 million in 2014.
As Will mentioned earlier on the call, during the quarter we
generated company FFO of $69.6 million or $0.29 per diluted common share compared to $66.3 million or $0.27 per diluted common
share for the quarter ended December 31, 2014. For the year, we generated company FFO of $268 million or $1.10 per diluted common
share.
Our company FFO 2016 guidance is in the range of $1.00 to $1.10
coming in lower than the 2015 company FFO due to the possible sale of our New York City land investments we are currently marketing.
These investments generated $50.5 million of GAAP revenue and $16.7 million of cash revenue in 2015.
The most significant assumptions for guidance include the timing
and amount of property sales included in New York City land positions, coupled with the retirement of debt and common share purchases
as described by Will in his commentary. We are also projecting that we will complete the $10 million common share repurchase authorization
during 2016. Keep in mind this guidance is forward-looking, excludes the impact of certain items and is based on current expectations.
For the quarter ended December 31, 2015, GAAP rents were in
excess of cash rents by approximately $11.7 million and for the year ended December 31, 2015, GAAP rents were in excess of cash
rents by $45.9 million, $33.8 million of which relates to our New York City land investments. We believe the Company can redeploy
cash from the potential New York City land sale and assets at higher initial cap rate so the dilution is not expected to be meaningful
and the Company would shed $242 million in mortgage debt in connection with the sale. The New York City land investments currently
generate approximately $5.3 million in after debt service cash flow.
On page 17 of the supplement, we have included our estimates
of both cash and GAAP rents for 2016 and 2017 for leases in place at December 31, 2015. This disclosure does not assume any tenant
releasing of vacant space, tenant lease extension on properties with scheduled lease expirations, property sales or property acquisitions.
Property operating costs decreased $3 million in the fourth quarter of 2015 primarily due to the sale of multi tenanted properties.
Interest expense decreased $2.4 million in the fourth quarter
of 2015 primarily due to lowering borrowing costs on outstanding debt offset by an increase in capitalized interest. During the
fourth quarter of 2015 we incurred impairment charges of $2.8 million relating to an impairment taken on an office property in
Garland, Texas and vacant land in Clive, Iowa. The land was sold in the first quarter of 2016 and the Garland property will come
off lease in May of 2016.
G&A expenses came in at $29.3 million for 2015 and we are
projecting that G&A for 2016 to be comparable at approximately $30 million. For the year ended December 31, 2015, our interest
coverage was approximately 3.5 times and net debt to EBITDA was approximately 6.7 times. Debt increased in the fourth quarter of
2015 by $191.1 million, primarily due to $110 million financing in our Richland, Washington acquisition and line borrowing to finance
build to suit funding.
The fourth quarter acquisitions contributed $2.6 million in
rental revenue due to the timing of the acquisitions during the quarter compared with $22.7 million of rental revenue that would
be expected to be realized if the properties were owned for the entire year. In addition build-to-suit fundings provide no rental
revenue until the property is closed. While we remain comfortable with our leverage level, we are targeting a net debt to EBITDA
of approximately 6.5 times or less at year-end 2016.
Now turning to the balance sheet. Our balance sheet continues
to be in good shape. We had $103.9 million of cash at quarter end, including cash classified as restricted. Restricted cash balances
relate to money primarily held with lenders as escrow deposits on mortgages. At year-end we had about $2.2 billion of consolidated
debt outstanding which had a weighted average interest rate of 4% of which approximately 92% of that fixed rate including debt
currently covered by interest rate swap agreements.
We have entered into LIBOR swaps on both the $255 million outstanding
on our term loan which matures in 2021 and a $250 million outstanding on our term loan, which materials in 2020. The swaps are
effective through January 2019 and February 2018 respectively. The current spread components on both term loans our 1.1%.
In February of 2016, the Company closed on a 15 year mortgage
financing on Gateway Plaza in Richmond, Virginia. The loan bears interest at fixed rate of 5.2% and the terms maturity matches
the lease term of the McGuire Woods lease which occupies approximately 68% of the property.
As of December 31, 2015, our unencumbered asset base was approximately
$3.3 billion or 69.2% of our NOI. We have approximately $113.4 million of mortgage balloon debt at an average interest rate of
5.8% coming due this year which are expected to be retired in connection with dispositions, cash from dispositions and financing
proceeds. Over the course of the year we expect to add $175 million to $200 million of long term fixed rate debt to the balance
sheet and retire shorter-term maturities including the 2016 maturing mortgage debt and amounts outstanding under our revolving
credit facility.
During the quarter ended December 31, 2015, we paid approximately
$2.4 million in lease costs and approximately $7.2 million in tenant improvements. For the full year we spent approximately $27.1
million in TIs and leasing costs. Our budget for 2016 for these items is approximately $25 million so we expect see an overall
decrease of roughly $2 million.
We have also included on page 14 of the supplement the funding
projection our build-to-suit projects and forward commitments along with historical NOI recognized on build-to-suit projects that
have come online. For the schedule, the Company has investment commitments this coming year of $265 million as of year-end 2015,
of which approximately $48.3 million has already been funded in 2016.
As it relates to build-to-suit projects, since we fund the construction
costs and got a take out upon completion, we do not recognize interest income during the construction or any rental revenue until
the project is complete and the tenant takes occupancy. Our basis of the project upon completion is the actual cash we spend in
the funding plus any capitalized costs we recognize in accordance with GAAP. We capitalize interest using our overall borrowing
rate.
Now I would like to turn the back over to Will.
Will Eglin:
Thanks, Pat. Operator, I have no further comments at this time so we are ready for you to conduct the question and answer portion
of the call.
Operator
Thank you.
QUESTIONS AND ANSWERS
Operator
(Operator Instructions). Sheila McGrath, Evercore ISI.
Sheila McGrath, Evercore ISI – Analyst:
Yes, good morning. Will, I was wondering if you can give us some insight on where you are in the sale of the ground lease process?
What the guidance assumes in terms of timing? And what would make a JV a more desirable outcome, that you mentioned in your remarks?
Will Eglin:
We are marketing the positions as we speak; and our guidance assumes that we have a transaction that closes at June 30. So to the
extent that it takes longer to sell them, it adds about a penny to FFO for every month that we hold on to the asset. We are exploring
both the sale and a joint venture just to make sure that we have the most options to choose from. But the assumption is that there's
a transaction roughly in the middle of the year.
Sheila McGrath:
Okay. Is the interest level and pricing -- does it compare favorably to what you purchased the ground lease positions at?
Will Eglin:
Yes. Our expectation is that we will do well on price. It is certainly, if you recall, we did the first three properties in one
transaction and the fourth in a separate transaction a year later. And it is possible that, that fourth transaction would be sold
separately and that we will sell the three together. But no, our expectation is that we will do well on the sale.
Sheila McGrath:
Okay. Then just quickly on buyback -- Pat, I think you mentioned by year end you will be at net debt to EBITDA of 6.5. How much
buyback is assumed in your guidance? Or how much is feasible given where you want to keep leverage?
Pat Carroll:
We have an authorization for $10 million. We bought back $3.2 million, roughly, through today. So the model assumes the rest of
it is acquired.
Sheila McGrath:
Okay. All right, thank you.
Operator:
Craig Mailman, KeyBanc.
Laura Dickson, KeyBanc Capital Markets – Analyst:
Hey, guys, it is actually Laura in for Craig. Just a follow-up on the share buyback program. I guess, if you guys are assuming
that you complete it in your guidance, what's the potential for -- would a bigger buyback program be in order once this one is
complete?
Will Eglin:
It is certainly possible. We are focused on executing on the initial authorization, and we think the stock is very inexpensive
and a great value. So management, which views themselves as long-term investors in the Company, view this honestly as a great opportunity
to buy in stock at very good level. It is certainly possible that, after we work through the first authorization, there would be
more. But we will have to see how the year progresses.
Laura Dickson:
Okay, great, thanks. Then I guess also on the Manhattan office ground portfolio sale. What percentage of disposition guidance would
that represent?
Will Eglin:
Approximately half at the top end.
Laura Dickson:
Okay. Great. Thank you.
Operator:
Anthony Paolone, JPMorgan.
Anthony Paolone, JPMorgan – Analyst:
Thanks, good morning. Will, can you talk about the competitive landscape for the build-to-suits, given the volatility in the capital
markets? And whether that competition is pulled back at all? Or how those spreads have looked lately?
Will Eglin:
Sure, Tony. We definitely believe that there will be opportunity to look at 12- to 24-month forwards right now at higher cap rates.
If you recall, most of the things that we've closed recently were transactions we committed to a year or two ago, when cap rates
were attractive and spreads were wide. As spreads compressed, we slowed down in terms of looking at our pipeline. But we do believe
that the competition is less and we are continuing to see some opportunities in the forward commitment space. Obviously, competing
with the share buyback, given where the stock is right now, is hard for build-to-suit to measure up, but we are still seeing good
transaction flow, and, for sure, cap rates have inched up in that space.
Anthony Paolone:
Can you put any brackets around where a forward yield may need to be, to look more interesting than a share buyback?
Will Eglin:
We committed to one transaction in fourth quarter, which is a 15-year lease at an 8.30% cap rate. And we had felt like, if that
transaction was in the market a year ago, it probably would have been 100 basis points lower. So it is not totally an apples to
apples comparison, right, comparing the acquisition of newly constructed properties with 15- and 20-year leases to buying in stock.
But in terms of this year, we're not particularly interested in any acquisition activity. We find buybacks much more attractive
compared to purchasing property in the auction market. But at the same time, there is a spread between where you can sell this
year on a cap rate basis and where you might be able to redeploy capital the year or two out. We are still looking at some forward
commitments.
Anthony Paolone:
Okay. Can you remind me -- the South Carolina industrial asset, it's got one of the lower yields in the pack. What was, who's the
tenant, what's the story on that one?
Will Eglin:
Yes, that was a lower-yield transaction that we committed to quite a while ago. It is a 20-year industrial lease at a price per
foot of $52, which we thought was appealing from the standpoint of basis. It has 20 years with annual escalations, but that 5.9%
cap rate did represent, in our minds, the low point of capitalization rates on new construction.
Anthony Paolone:
Okay. Thank you.
Operator:
Jon Petersen, Jefferies.
Jon Petersen, Jefferies & Co. – Analyst:
Thank you. I think previously, you had talked about selling a portfolio of suburban office buildings? Can you give us an update
on what your plans are in terms of selling things besides the ground leases in Manhattan? And what we should expect going into
this year?
Will Eglin:
Yes, the numbers that we put out on this year's disposition program of $600 million to $700 million represent the end result of
a process that we went through, looking at a bigger pool of assets inside the Company. And our view is that we can capture the
most value by transacting on a one-off basis. So there are some properties that might have been looked at in the context of a portfolio
sale in the past, where our plan this year is to execute on individual transactions. It doesn't mean that there may not be portfolio
transactions that are considered as we go through the year, but the plan put out today contemplates one-off disposition activity.
Jon Petersen:
Then, I guess along those same lines, clearly there's been volatility in the market, some of the economic indicators have been
somewhat weak. So I'm curious, since I know you guys have been active sellers over the last few quarters, if you see anything change
from what buyers are willing to buy? If you've seen pricing compressed at all over the last couple months versus what we were seeing
a couple quarters ago?
Will Eglin:
We have not. We've done extensive valuation work on the assets that we are interested in selling, consulting with brokers and getting
broker estimates of value, that in many cases, have in our minds seemed extremely strong. So we still view this as being a good
market to sell into.
Jon Petersen:
Okay, thanks, that's helpful. Then just one more on the new build-to-suit that you guys announced this quarter in Charlotte, 8.3%
going in cash yield, obviously very high relative to the other properties you have. Just kind of curious, I know you mentioned
being more selective in terms of doing more build-to-suit projects, but what is your minimum yield return threshold, given your
current cost of capital?
Will Eglin:
We are not looking at anything, generally 7% to 8.5% are transactions that we are looking at, but that doesn't mean we would be
committing to anything toward the low end. If we were, it would probably be only for very high grade credit with high-quality industrial
property.
Jon Petersen:
Okay. All right, that's helpful, thank you.
Operator:
John Guinee, Stifel.
John Guinee, Stifel Nicolaus – Analyst:
Thank you. A couple questions, just purely out of curiosity. You did two big loans: Richmond, Virginia, and the State of Washington.
What's the amortization schedule on those loans? I.e., what's the principal balance of the debt when the lease matures?
Will Eglin:
In the case of Preferred Freezer, it is a 10-year financing, 5 years of interest-only payments, and 5 years of 30-year amortization.
So there's a little bit of amortization at the tail end. And in the case of McGuire Woods, it's ten years of interest-only payments
and the last 5 years are on a 30-year schedule. Little bit of amortization, but not a huge amount.
John Guinee:
So, basically, if a lender's lending on the Freezer, they've still got 10 years left on the lease term and then --
Will Eglin:
That's correct.
John Guinee:
With McGuire Woods they also have what, five years left on the lease term?
Pat Carroll:
No, it is exactly match funded to the McGuire Woods lease.
John Guinee:
Okay, what does the basis does the lender have on the McGuire Woods building? At the end of the lease? Are they in it at $250 or
$300 a foot still?
Will Eglin:
It is a $57.5 million loan, with a 30-year schedule on the backend, so it is probably like mid-$50 million, $55 million, $54 million.
Pat Carroll:
On the other one, John, on Richland Washington, the balloon is $99.5 million.
John Guinee:
Got you. Okay. The lenders are back, wow. Okay. The second question -- if I'm doing the math right based on Sheila's question,
the fall off, quarter over quarter, with the sales of just the ground-lease assets is about $0.03 a share. Is that the right way
to look at it?
Will Eglin:
Per quarter, that's about right. It might be $0.035 on a quarterly basis, John.
Pat Carroll:
John, in 2015, the four land parcels generated about $0.16 of FFO.
John Guinee:
Okay. So, essentially, you are talking about the first half of the year maybe $1.10 to $1.15 run rate, and the last half of the
year maybe a $0.95 to $0.99 run rate for annualized FFO?
Will Eglin:
We don't give guidance on a quarterly basis, but obviously --
John Guinee:
We are asking you to.
Will Eglin:
(laughter) I understand. But we walked through the FFO impact from the sales, and I think that we would encourage people to focus
on the transactions from the standpoint of really looking at our after-debt-service cash flow which is, as Pat said, $5.3 million
on a position where we have $242 million of leverage. So for sure we can reinvest the money in a way that provides more current-period
accretion. And the key to deleveraging the balance sheet this year, beyond the 6.5 times net debt to EBITDA that Pat mentioned,
would be a result of selling the land position.
John Guinee:
Okay. Then, if I'm looking at page 38 and all of your mortgage and notes payable, are we done with asset sales via conveyance back
to the lender? Or are there more on this list that would be asset sale versus conveyance back to the lender?
Will Eglin:
No, there are still several that may be conveyed back to lenders, John, as we go forward.
Pat Carroll:
John, on page 38 the footnotes O and footnote B, are two loans that are currently in default, where obviously those are definitely
candidates to give back to lenders.
John Guinee:
Any more that we expect to have footnotes O and footnote B in the future?
Pat Carroll:
It is always possible, John. There's a property out in Bremerton, Washington, that I can think of, that potentially could fall
into that category.
John Guinee:
Great, okay. Thanks a lot. Thank you.
Operator:
William Seagall, Development Associates Inc.
William Seagall, Development Associates, Inc. –
Investor:
Thank you, gentlemen. I've been an investor in your Company for many years and it is certainly an unusual time. And Will I appreciate
you getting to what I think is the elephant in the room very quickly in your talk. And in your words, how unusually compelling
the value of our own common stock is right now, vis a vis other ways you could deploy your capital. And I think you did a good
job of covering it, and some of the analysts cut your, your answers on perhaps buying more than $10 million this year, and that
would be up for debate with your Board. Unusual times. Do you retire the stock? Or is it treasury stock?
Pat Carroll: It is retired.
William Seagall:
Okay, all right. Thank you very much for those answers. Number two, thanks for touching on Houston. Any other areas that might
be impacted by the fall in oil and hydrocarbons?
Pat Carroll:
No, we discussed the area of the concern, which is Houston. We can't really see any other place where we are. I think we're pretty
well-diversified by industry type and markets, so we feel because of that diversification we have a level of safety.
William Seagall:
Okay. I noticed, was surprised when you went into Detroit -- and here again that's just part of this opportunistic diversification
that you do -- and you had no hesitation about Detroit or the automobile industry, et cetera?
Will Eglin:
No, in fact automotive has been very strong and suburban Detroit has been doing extremely well. So there are areas in and around
Detroit where we think that automotive can be a good play.
William Seagall:
Heard a first-hand report on that the other night and curious, where is the plant? The Detroit property? In other words, is it
the outskirts?
Will Eglin: No, it is a few miles from their headquarters.
William Seagall:
Very good. Gentlemen, thank you very much.
Will Eglin:
Thank you.
Operator:
(Operator Instructions). Sheila McGrath, Evercore.
Sheila McGrath:
Yes, I was wondering if you could tell us how the capital expenditures are looking in 2016 versus 2015, not on build-to-suit, but
rather on the leasing costs?
Pat Carroll:
Yes, we came in at like $27.1 million in 2015, to TIs and leasing costs, and we project it in 2016 to be about $25 million.
Sheila McGrath:
Okay, great. And then, Will, usually you bump the dividend later in the year. I'm just wondering, often when you announced third-quarter
earnings, I'm just wondering how you view a dividend bump versus the stock buyback at this point?
Will Eglin:
Time will tell how things are looking when we get to that point later in the year. Right now we continue to view the buyback as
the better use of capital.
Sheila McGrath:
Okay, great.
Operator:
John Guinee, Stifel.
John Guinee:
I had the exact same question Sheila did, thank you.
Operator:
At this time we have no further questions. I will turn the call back to our speakers for closing comments.
Will Eglin:
Great, thanks to all of you again for joining us this morning. We think we're going to have a terrific year and we're looking forward
to reporting our results to you every quarter. Thanks again.
Operator:
Thank you. This does conclude the teleconference. You may disconnect your lines at this time. Thank you for your participation.
Exhibit 99.3

INVESTOR PRESENTATION FEBRUARY 2016 LEXINGTON REALTY TRUST

Disclosure This presentation contains certain forward - looking statements within the meaning of Section 27 A of the Securities Act of 1933 , as amended, and Section 21 E of the Securities Exchange Act of 1934 , as amended, which involve known and unknown risks, uncertainties or other factors not under Lexington Realty Trust’s (“Lexington” or “LXP”) control which may cause actual results, performance or achievements of Lexington to be materially different from the results, performance, or other expectations implied by these forward - looking statements . These factors include, but are not limited to, those factors and risks detailed in Lexington’s filings with the Securities and Exchange Commission . Except as required by law, Lexington undertakes no obligation to ( 1 ) publicly release the results of any revisions to those forward - looking statements which may be made to reflect events or circumstances after the occurrence of unanticipated events or ( 2 ) update or supplement forward - looking statements that become untrue because of subsequent events . Accordingly, there is no assurance that Lexington’s expectations will be realized . 2

Company Overview LEXINGTON REALTY TRUST (NYSE: LXP) Long History Portfolio Snapshot Experienced Team Franchise founded in 1973 Public since 1993 Consistent dividend paying company for 22 years Investment grade credit ratings by S&P, Moody’s and Fitch $5.0 billion company (gross book value) 215 properties, including land, across 42.3 million square feet in 40 U.S. states Approximately 97% leased Pay quarterly annualized dividend of $0.68 per common share Seasoned executive management averaging 19 years with LXP Consistently improving portfolio quality Prudent managers of capital Experienced portfolio and asset management teams focused on enhancing operating results As of 12/31/2015. 3

Investment Features Focused Single - Tenant, Net - Lease Strategy Diversified Portfolio Attractive Growth Prospects Active Portfolio Management Consistent Operating Performance Flexible Balance Sheet Strong Dividend with Conservative Payout Ratio 4

Focused Investment Strategy 5 INVESTMENT FOCUS ▪ Build - to - suit and sale - leaseback investments ▪ Long - term net leases, typically 15 - 20 years ▪ Single - tenant properties SECTOR ▪ Industrial, o ffice and select specialty r eal estate PORTFOLIO MANAGEMENT ▪ Originate , operate and sell certain properties with more than 10 years of remaining lease term ▪ Continue to manage and operate properties in “core” markets or which are mission critical facilities ASSET MANAGEMENT PORTFOLIO REPOSITIONING ▪ Reduce multi - tenant exposure ▪ Exit “non - core” office markets ▪ Sales proceeds used for deleveraging and investments that maximize value ▪ Tenant relationship focus ▪ Proactively manage lease expirations and weighted - average lease term ▪ Sustain high levels of occupancy BALANCE SHEET ▪ Maintain modest leverage ▪ Access to secured and investment - grade unsecured debt with balanced maturities ▪ Hold predominately long - term, fixed - rate debt
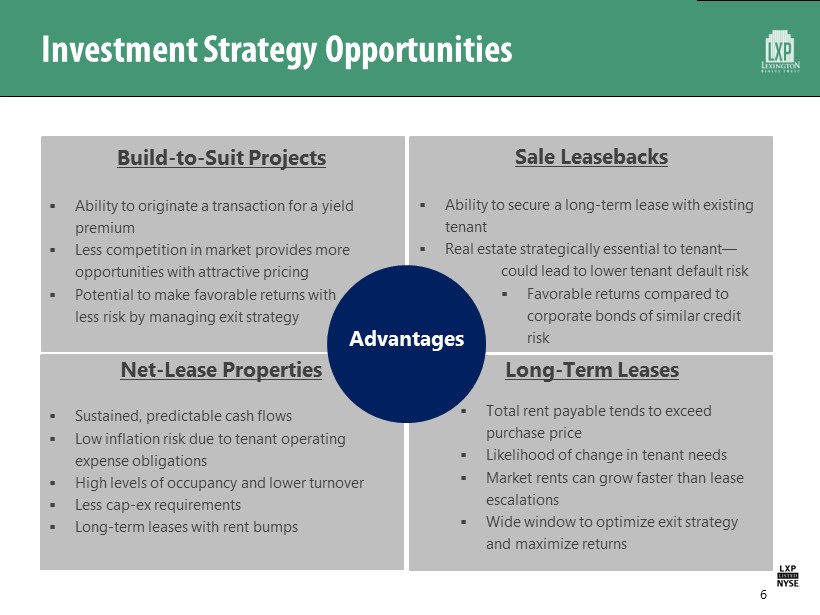
Investment Strategy Opportunities 6 Build - to - Suit Projects ▪ Ability to originate a transaction for a yield premium ▪ Less competition in market provides more opportunities with attractive pricing ▪ Potential to make favorable returns with less risk by managing exit strategy Sale Leasebacks ▪ Ability to secure a long - term lease with existing tenant ▪ Real estate strategically essential to tenant — could lead to lower tenant default risk ▪ Favorable returns compared to corporate bonds of similar credit risk Net - Lease Properties ▪ Sustained, predictable cash flows ▪ Low inflation risk due to tenant operating expense obligations ▪ High levels of occupancy and lower turnover ▪ Less cap - ex requirements ▪ Long - term leases with rent bumps Long - Term Leases ▪ Total rent payable tends to exceed purchase price ▪ Likelihood of change in tenant needs ▪ Market rents can grow faster than lease escalations ▪ Wide window to optimize exit strategy and maximize returns Advantages

7 Through its focused strategy, Lexington continues to show meaningful progress towards creating a best - in - class net - lease REIT. Portfolio Metrics 2013 (1) 2015 (2) Status Office Exposure (3) 61.3% 50.1% i Multi - Tenant Exposure (3) 7.9% 3.0% i % of Revenue from Long - Term Leases (4) 30.1% 40.8% h Average Lease Duration (years) (5) 11.2 12.6 h Unencumbered Asset Base $2.6 Billion $3.3 Billion h Weighted - Avg . Debt Maturity (years) 7.0 7.2 h Weighted - Avg . Interest Rate 4.71% 4.01% i (1) As of 12/31/13. (2) As of 12/31/15. (3 ) As a percentage of GAAP rent for the respective year ended for consolidated properties owned as of such year end. (4) Leases with remaining term of 10 years or longer. (5) Cash basis for consolidated properties owned as of each respective year end. Not adjusted to reflect NY land leases through the first purchase option date. Portfolio Transformation Continues…

2016 Business Plan Highlights Dispositions ▪ Dispose of approximately $600 - $700 million of office, multi - tenant, and NYC land investments (30 assets) Acquisitions ▪ Committed to $265 million in build - to - suit projects to be primarily funded with disposition proceeds ▪ Potential to acquire additional build - to - suits or sale leasebacks with attractive pricing Balance sheet ▪ Retire approximately $375 million of secured debt with disposition proceeds ▪ Add approximately $175 - $200 million of longer - term debt and pay down bank line ▪ Target net debt to EBITDA of 6.5x or less by end of 2016 Capital Markets ▪ Buy back 6.8 million common shares remaining under share repurchase plan ▪ Do not need to raise equity in 2016 Leasing Costs/TIs ▪ Expected to be approximately $25 million, a $2 million decrease compared to 2015 2016 Company FFO Guidance range of $1.00 to $1.10 per diluted common share. (1) Forward - looking statements; see disclaimer on page 2. (1) 2016 Company FFO guidance assumes NYC land investments sold as of June 30, 2016 at a sub 5% cap rate, the retirement of $ 375 million of secured debt, and the repurchase of 6.8 million shares under the share repurchase plan among other things. Guidance is forward looking, bas ed on current expectations, and excludes the impact of certain items. 8

25.6 12.8 2.3 1.4 0.2 Square Footage (Millions) Industrial Office Multi-Tenant Retail/ Specialty Land/ Infrastructure Well Diversified by Geography/Property Type 9 24 5 7 1 2 2 2 3 3 1 2 3 4 2 3 7 14 13 13 2 2 8 5 9 4 6 15 5 9 10 2 2 8 1 2 1 1 5 2 States with rental revenue greater than $10 million on an annualized GAAP basis. Note: All information as of 12/31/15. Numbers indicated in the individual states represent number of properties owned in each st ate. 96 67 30 12 10 Office Industrial Retail Multi-Tenant Land/Infrastructure Number of Properties 5

Revenue Sources by Property Type 10 3.4% 61.3% 24.6% 7.9% 2.8% 16.0% 50.1% 27.9% 3.0% 3.0% Land/Infrastructure Office Industrial Multi-Tenant Retail/Specialty 2013 (1) 2015 (2) Lexington continues to improve and diversify its revenue sources. (1) GAAP revenue as of 12/31/13. (2) GAAP revenue as of 12/31/15.

Strong Tenant Diversification Top 10 Tenants (1) Revenue by Credit Rating (2) (1) Based on cash rent for the year ended 12/31/15, for consolidated properties owned as of 12/31/15. (2) Based on GAAP rent for the year ended 12/31/15, for consolidated properties owned as of 12/31/15 . (3) Total shown may differ from detailed amounts due to rounding. (4) Credit ratings are based upon either tenant, guarantor or parent entity. 14.9% Non - IG 50.6% Unrated 34.5% Investment Grade 11 Top 10 Tenants/Lease Guarantor Primary Lease Term Expiration Year # of Leases % of Base Rent (3) S&P Moody's FedEx Corporation / Federal Express Corporation 19/21/28 3 3.8% BBB Baa1 Metalsa Structural Products, Inc./ Dana Holding Corporation/ Dana Limited 21/25/26 7 3.1% BB+ Ba3 United States of America 16/18/27/30 4 2.4% AA+ Aaa Nissan North America, Inc. 23/27 2 2.4% A - A3 Swiss RE America Holding Corporation / Westport Insurance Corp. 18/19 2 2.2% A Aa3 Xerox Corporation 2023 1 2.1% BBB Baa2 Michelin North America, Inc. 16/19/20 3 2.1% - - T - Mobile USA, Inc./T - Mobile West Corporation 19/20 5 2.1% - Ba3 SM Ascott LLC 2112 1 1.7% - - Industrial Terminals Mgmt , LLC/Maritime Holdings (Delaware) LLC 2038 1 1.6% - - % of Top10 Tenants 23.4% Strong, brand name tenants with more than half of top 10 tenants investment - grade rated. Credit Rating (4)

Execution: Strong Acquisition Activity (1) Includes 100% of joint venture acquisitions ($39.5 million in 2013, $57.5 million in 2012 and $15.3 million in 2011) and excl ude s the acquisition of NLS on 9/1/2012. $128.2 $247.0 $590.4 $212.3 $483.0 8.8% 8.4% 5.9% 7.6% 7.4% 0.0% 1.0% 2.0% 3.0% 4.0% 5.0% 6.0% 7.0% 8.0% 9.0% 10.0% $0.0 $100.0 $200.0 $300.0 $400.0 $500.0 $600.0 $700.0 2011 2012 2013 2014 2015 Property Acquisition Volume and Cap Rate (1) 12 Lexington has been able to maintain strong acquisition activity with attractive pricing.

External Growth Prospects - Build - to - Suit Pipeline (1) No assurances can be given that any of these investments will be completed or, if completed, will perform to our expectation s. (2) Forward purchase commitment. Closed in the first quarter of 2016. (3) Lexington has a 25% interest in the joint venture as of the date of this presentation. Detroit, MI (2) Anderson, SC Houston, TX (3) Lake Jackson, TX Charlotte, NC Type Industrial Industrial Private School Office Office Square Feet 189,960 1,325,000 274,000 664,000 201,000 Estimated Completion Cost (millions) $29.7 $70.0 $86.5 $166.2 $62.4 Investment Balance 12/31/15 (millions) -- $23.8 $38.4 $62.4 $9.2 Lease Term 20 years 20 years 20 years 20 years 15 years Initial Cap Rate 7.4% 5.9% 7.5% 7.3% 8.3% Escalations Flat 2% annually Lesser of 2% or 2X CPI increase 2% annually 2% annually Estimated / Completion Date 1Q16 2Q 16 3Q16 4Q16 Q1 2017 13 Future build - to - suit investments are estimated to add annual revenue of $29.9 million to the portfolio. (1)

▪ Acquired in Q4 1015 for approx. $152 million ▪ Attractive cash cap rate of 7.1% and GAAP cap rate of 8.6 % ▪ 456,400 sq. foot state - of - the - art industrial facility located in Washington State ▪ Lease payments backed by strong credit tenant — ConAgra Foods, Inc. ▪ Obtained $110 million 10 - year mortgage financing at a 4% fixed rate ▪ Long - term lease of 20 years ▪ 2016 cash - on - cash return of approximately 15% ▪ Attractive long - term internal rate of returns (IRR): 14 Investment Hold (years ) Exit Cap Rate IRR 10 7.0% 20.3% 10 8.0% 18.3% 10 9.0% 16.4% 10 10.0% 14.6% Build - to - Suit Investment Rationale: Preferred Freezer Note: Initial cash cap rate, IRR, and cash - on - cash return are measures of operating performance used to evaluate the individual performance of an investment. These measures are not presented or intended to be viewed as liquidity or performance measures that present a numerical measu re of Lexington’s historical or future financial performance, financial position or cash flows. Expectations may not be realized.

Build - to - Suit Investment Rationale: McGuireWoods 15 ▪ Acquired in Q4 1015 for approx. $101.5 million (1) ▪ Attractive initial cash cap rate of 8.2% and GAAP cap rate of 9.0% (1) ▪ 330,000 sq. foot new office building in desired Richmond, VA location ▪ Match - funded 15 - year financing with 15 - year lease ▪ 5.2% fixed interest rate, 10 - yr interest only followed by 30 - year ammortization ▪ Significantly reduces residual risk ▪ As is, cash - on - cash returns ranging from 10.5% - 13.6% (life of lease) ▪ Strong tenant, McGuireWoods , occupying majority of building ▪ Ability to lease up 15.6% of space for further value creation Internal Rate of Return (IRR) Scenarios Price/SF Sold $ 250 $ 225 $200 $162 ( Debt Balance) IRR 10.35% 9.79% 9.16% 8.14% Price/SF Sold $ 250 $ 225 $200 $ 162 (Debt Balance) IRR 12.20% 11.76% 11.28% 10.54% Conservative Scenario (2) Lease - up scenario (3) (2) Assumes remaining two floors stay vacant over the hold period. (3) Assumes remaining two floors are leased by July 1, 2016 and McGuireWoods exercises their expansion options for this space in year 5 and 10. Note: Initial cash cap rate, IRR, and cash - on - cash return are measures of operating performance used to evaluate the individual performance of an investment. These measures are not presented or intended to be viewed as liquidity or performance measures that present a numerical measure of Lexington’s historical or future financial performance, financial position or cash flows. Expectations may not be realized. (1) Initial basis does not include $8.1 million for estimated earnout lease payments for developer leased space. Initial yields include $4.0 million of earnout lease payments earned but not yet paid as of 12/31/15.

Portfolio Repositioning Activity 16 Disposition Volume and Cap Rate (1) Lexington has consistently used proceeds from non - core dispositions to recycle capital into higher - quality properties. 7.4% 7.2% 6.5% 3.6% 6.3% 0.0% 2.0% 4.0% 6.0% 8.0% 10.0% $0 $50 $100 $150 $200 $250 $300 2011 2012 2013 2014 2015 Disposition Volume (millions) (1) Includes assets disposed of that were either vacant or not stabilized. (2) Revenue from leases longer than ten years. Based o n c onsolidated GAAP rent. Long - term Lease Revenue (2) 15% 23% 30% 41% 41% 0% 10% 20% 30% 40% 50% 60% 2011 2012 2013 2014 2015

Asset Repositioning Case Study: Sea Harbor Center 17 ▪ Vacated in 2008 ▪ Conversion to multi - tenant ▪ Lexington invested $39 million ▪ Occupancy raised to 99.7% (1) ▪ Sold for $64.7 million in June 2015 Sea Harbor Center Orlando, Florida $(0.4) $(0.8) $(0.8) $(0.6) $2.7 $(2.0) $(1.0) $- $1.0 $2.0 $3.0 2010 2011 2012 2013 2014 Millions Net Operating Income 0.0% 0.0% 74.5% 86.9% 99.7% 0.0% 20.0% 40.0% 60.0% 80.0% 100.0% 2010 2011 2012 2013 2014 Occupancy (1) At closing in June 2015. Note: Net operating income (NOI) is a measure of operating performance used to evaluate the individual performance of an inve stm ent. This measure is not presented or intended to be viewed as a liquidity or performance measure that presents a numerical measure of Lexington’s historical or future financi al performance, financial position or cash flows.

Asset Repositioning Case Study: Transamerica Tower ▪ 27% occupancy at the end of 2009 ▪ Lexington invested $55 million (1) ▪ Occupancy raised to 94.2% (2) ▪ NOI grew from $(3.8) million to $8.5 million ▪ Sold for $121.0 million in August 2015 $(3.8) $(1.1) $4.7 $7.5 $8.5 $(6.0) $(4.0) $(2.0) $- $2.0 $4.0 $6.0 $8.0 $10.0 2010 2011 2012 2013 2014 Millions Net Operating Income 74.9% 95.1% 95.4% 95.4% 92.1% 40.0% 50.0% 60.0% 70.0% 80.0% 90.0% 100.0% 2010 2011 2012 2013 2014 Occupancy Transamerica Tower Baltimore, MD 18 (1) Since single - tenant termination in 2008. Amount is net of $27.0 million termination fee, but includes adjacent garage construction funding since single - tenant termination. (2) Tower only at 6/30/15. Note: Net operating income (NOI) is a measure of operating performance used to evaluate the individual performance of an investment. This measure is not presented or intended to be viewed as a liquidity or performance measure that presents a numerical measure of Lexington’s historical or future financial performance, financial position or cash flows.

Asset Repositioning Case Study: Corporate Center At The Gardens ▪ Vacated in 2011 ▪ Lexington invested $11.6 million ▪ Occupancy raised to 100.0% ▪ NOI expected to grow from $(0.3) million to $1.6 million at forecasted stabilization ▪ Currently under contract to be sold for $30.1 million (1) $(0.3) $(0.4) $(0.1) $0.1 $1.1 $1.6 $(0.5) $- $0.5 $1.0 $1.5 $2.0 2011 2012 2013 2014 2015 2016 Millions Net Operating Income 19.6% 26.4% 36.3% 94.9% 100.0% 0.0% 20.0% 40.0% 60.0% 80.0% 100.0% 2011 2012 2013 2014 2015 Occupancy Corporate Center At The Gardens Palm Beach Gardens, FL 19 (1) We can provide no assurance that the property will be sold or the stated price achieved. (2) Forecasted based on signed leases. (2) Note: Net operating income (NOI) is a measure of operating performance used to evaluate the individual performance of an investment. This measure is not presented or intended to be viewed as a liquidity or performance measure that presents a numerical measure of Lexington’s historical or future financial performance, financial position or cash flows.
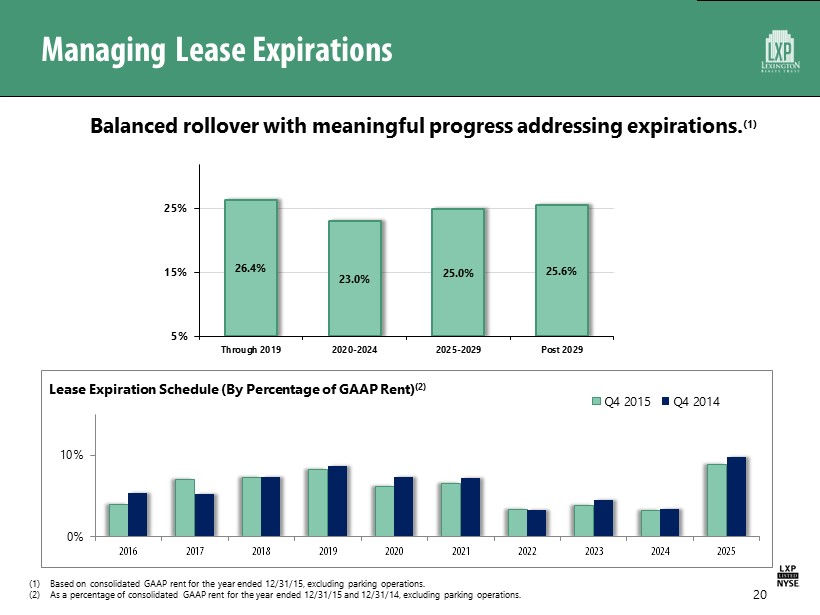
Managing Lease Expirations Balanced rollover with meaningful progress addressing expirations. (1) 0% 10% 2016 2017 2018 2019 2020 2021 2022 2023 2024 2025 Lease Expiration Schedule (By Percentage of GAAP Rent) (2) Q4 2015 Q4 2014 (1) Based on consolidated GAAP rent for the year ended 12/31/15, excluding parking operations. (2) As a percentage of consolidated GAAP rent for the year ended 12/31/15 and 12/31/14, excluding parking operations. 20 26.4% 23.0% 25.0% 25.6% 5% 15% 25% Through 2019 2020-2024 2025-2029 Post 2029 Lease Rollover Distribution(1)

21 64.5% 19.6% 15.9% Annual increases Flat Other scheduled increases 6.9 11.2 12.1 12.6 4.0 6.0 8.0 10.0 12.0 14.0 2012 2013 2014 2015 (1) Cash basis for consolidated properties. As of 12/31/15. (2) Based on consolidated cash rent for the year ended 12/31/15 for single - tenant leases . Excludes parking operations and $7.8 million in step - down lease. (3) Based on GAAP rent for the year ended 12/31/2015. Weighted - Average Lease Term (1) (In Years) Scheduled Rental Increases (2) Stable and Predictable Cash Flows 59.2% 40.8% Leases Under 10 Years Remaining Leases Over 10 Years Remaining Lease Type (3) Approximately 66% of office revenue is derived from long - term leases or leases executed after January 1, 2009.

22 93.4% 95.9% 97.3% 97.6% 96.4% 96.8% 85.0% 90.0% 95.0% 100.0% - 2,000 4,000 6,000 8,000 2010 2011 2012 2013 2014 2015 Leasing Volume SF in 000s Strong Operational Performance Historical Occupancy and Leasing Volume LXP continues to maintain high occupancy through its proactive leasing efforts.

Flexible Capital Structure (1) 23 (1) Data reflects balances at 12/31/15. (2) Data includes OP Units and reflects a common share price of $7.11 at 2/19/16. Debt Amount ($ in Millions) Interest Rate/ Coupon Unsecured Credit Facility – 2019 $ 177.0 L + 100 bps Unsecured Term Loan Due 2020 250.0 2.19% Unsecured Term Loan Due 2021 255.0 2.52% Convertible Guaranteed Notes 12.4 6.00% Unsecured bonds due 2023 250.0 4.25% Unsecured bonds due 2024 250.0 4.40% Mortgages 891.3 4.88% Trust Preferred 129.1 6.80% Total – Debt $ 2,214.8 4.01% Preferred Preferred C $ 96.8 6.50% Total – Preferred $ 96.8 Total – Common equity (2) $1,695.0 Total $4,006.6 Common Equity , 42.3% Unsecured Credit Facility , 4.4% Mortgage Debt , 22.3% Preferred Equity , 2.4% Unsecured Term Debt , 12.6% Trust Preferred , 3.2% Convertible Debt , 0.3% Unsecured Bond Debt , 12.5% Focus on maintaining maximum flexibility to access most advantageous source of capital.

Balance Sheet Strategy 24 Lexington will focus on extending maturities, unencumbering assets, maintaining its investment - grade ratings and selectively utilizing secured financing. LXP Debt Maturity Profile ($000’s ) (1) (1) As of 12/31/2015. Percentage denotes weighted - average interest rate . 5.8% 5.6% 6.0% 5.7% 6.2% 6.1% 4.1% 6.0% 1.3% 2.2% 2.5% 4.3% 4.4% $- $50,000 $100,000 $150,000 $200,000 $250,000 $300,000 2016 2017 2018 2019 2020 2021 2022 2023 2024 2025 Actual Mortgage Balloon Debt Corporate Debt

Strong Dividend Yield Strong dividend yield relative to its peers, REITs and other equity investments. Current Dividend Yield 25 Source: KeyBanc and Bloomberg as of 2/19/16. LXP’s current dividend yield reflects common share price of $7.11 at 2/19/16. 9.6% 7.0% 4.1% 4.8% 2.7% 2.3% 1.8% 0.0% 2.0% 4.0% 6.0% 8.0% 10.0% 12.0% LXP Net Lease Off/Ind REITs All REITs Dow Jones S&P 500 Russell 2000

Conservative Payout Ratio LXP believes its low payout ratio relative to its peers could improve growth prospects over time. 26 (1) Source: KeyBanc as of 2/19/16. 2016 Estimated FFO Payout Ratio (1) 63.6% 62.3% 52.6% 74.4% 0% 10% 20% 30% 40% 50% 60% 70% 80% LXP Industrial REITs Office REITs Net-Lease REITs 2016 Estimated AFFO Multiples (1) 8.7x 19.1x 18.2x 11.8x 0.0 5.0 10.0 15.0 20.0 25.0 LXP Industrial REITs Office REITs Net-Lease REITs

Investment Features ▪ Focused Single - Tenant, Net - Lease Strategy ▪ Diversified Portfolio ▪ Attractive Growth Prospects ▪ Active Portfolio Management ▪ Consistent Operating Performance ▪ Flexible Balance Sheet ▪ Strong Dividend with Conservative Payout Ratio 27

LEXINGTON REALTY TRUST A real estate investment trust specializing in single - tenant commercial properties.
LXP Industrial (NYSE:LXP)
Historical Stock Chart
From Mar 2024 to Apr 2024

LXP Industrial (NYSE:LXP)
Historical Stock Chart
From Apr 2023 to Apr 2024
