ISM Manufacturing Index Signals Continued Expansion in April
May 02 2016 - 11:10AM
Dow Jones News
WASHINGTON—A closely watched gauge of U.S. factory activity
slipped in April but continued to signal growth in the
manufacturing sector, which has been battered by low oil prices and
a strong dollar.
The Institute for Supply Management on Monday said its index of
manufacturing activity fell to 50.8 in April from 51.8 in March. A
reading above 50 indicates that factory activity is expanding while
a reading below 50 points to contraction.
Economists surveyed by The Wall Street Journal had expected an
April reading of 51.2.
Industrial output has weakened since the end of 2014 as low oil
prices depressed domestic energy production and export demand
faltered due to weak growth overseas and the strong dollar, which
makes U.S.-made goods more expensive for foreign customers.
The Federal Reserve's industrial-production index fell 2% in
March from a year earlier, reflecting sharp declines in mining and
utility output. Manufacturing production rose a modest 0.4% from
March 2015. The ISM factory gauge fell to 50 last September and
slipped into contractionary territory for the next five months.
The pressure on manufacturers may be easing. Oil prices have
moved higher in recent months. The dollar has weakened as Fed
policy makers signaled a willingness to move slowly on raising
short-term interest rates. Worries about economic growth overseas,
especially in China, have diminished somewhat though they haven't
disappeared.
There remain mixed signals for factory activity around the
world. Markit on Monday said its eurozone manufacturing-activity
gauge ticked higher in April, signaling continued modest expansion,
but the data provider saw factory conditions deteriorating last
month in Japan and Brazil.
"I'm hopeful that there's a global economic rebound, but we're
certainly not going to count on it," Honeywell International Inc.
Chief Executive David Cote told analysts last month. "Right now,
we're going to stay with this whole idea that this is a slow-growth
global environment."
Write to Ben Leubsdorf at ben.leubsdorf@wsj.com
(END) Dow Jones Newswires
May 02, 2016 10:55 ET (14:55 GMT)
Copyright (c) 2016 Dow Jones & Company, Inc.
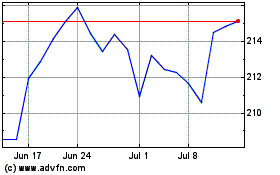
Honeywell (NASDAQ:HON)
Historical Stock Chart
From Mar 2024 to Apr 2024

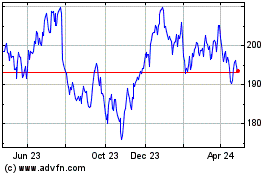
Honeywell (NASDAQ:HON)
Historical Stock Chart
From Apr 2023 to Apr 2024
