Metals Advance Ahead of U.S. Rates Decision
March 13 2017 - 8:25AM
Dow Jones News
By Katherine Dunn
LONDON--Copper prices rose to a one-week high on Monday as the
dollar weakened and traders refocused on supply disruptions at
mines in Chile and Indonesia.
The three-month London Metal Exchange copper price rose 0.97% to
$5,789.50 a metric ton in midmorning trade in Europe.
Gold prices were also higher, gaining 0.32% to $1,208.46 a troy
ounce.
Over the weekend, the union at Escondida--the world's largest
copper mine--rejected efforts by BHP Billiton, the majority-owner
of the mine, to restart talks. The strike has now been running for
more than a month.
Those renegotiations are unlikely to restart before new Chilean
labor regulations go into force at the start of April that could
affect future negotiations, according to David Wilson, an analyst
at Citi in London.
"It's quite obvious that Escondida is going to go on for a
while," said Mr. Wilson.
On Friday, a strike at the Cerro Verde mine in Peru, which is
owned by Freeport-McMoRan Inc. began. A dispute over the terms of
an export license for Freeport's Grasberg mine in Indonesia also
continues to drag on.
Prices for both base metals and precious metals were also
gaining on the back of a weaker dollar on Monday, as traders
awaited a busy week of market news ahead of a potential rate
increase.
The WSJ Dollar Index, which weighs the dollar against a basket
of other currencies, was down 0.13%.
The Federal Reserve will meet on Tuesday and Wednesday, and are
widely expected to raise rates for the first time this year, while
offering cues on the timing of future rate increases this year.
Among the base metals, aluminum was up 0.29% at $1,886.50 a
metric ton, lead was up 0.69% at $2,276.50 a ton, zinc was up 1.40%
at $2,747.50 a ton, nickel was up 1.61% at $10,080 a ton and tin
was up 0.75% at $19,360 a ton.
Precious metals also advanced. Silver was up 0.12% at $17.05 a
troy ounce, platinum was up 0.09% at $943.85 a troy ounce, and
palladium was up 0.36% at $750.75 a troy ounce.
Riva Gold contributed to this article
Write to Katherine Dunn at Katherine.Dunn@wsj.com
(END) Dow Jones Newswires
March 13, 2017 08:10 ET (12:10 GMT)
Copyright (c) 2017 Dow Jones & Company, Inc.
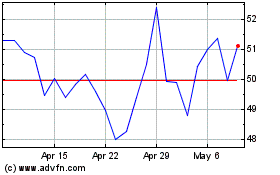
Freeport McMoRan (NYSE:FCX)
Historical Stock Chart
From Mar 2024 to Apr 2024

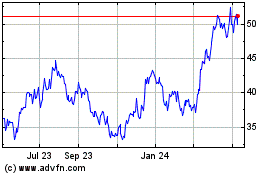
Freeport McMoRan (NYSE:FCX)
Historical Stock Chart
From Apr 2023 to Apr 2024
