Goldman Sachs Profit Climbs on Trading Revenue
October 18 2016 - 8:20AM
Dow Jones News
Goldman Sachs Group Inc. said its quarterly earnings rose 47% as
the firm continues to rebound from a slow start to the year.
The New York-based firm reported a profit of $2.09 billion, or
$4.88 a share. That compares with $1.43 billion, or $2.90 a share,
in the same period last year.
Revenue grew to $8.17 billion from $6.86 billion a year earlier,
when sluggish trading activity across Wall Street—particularly in
fixed-income, where Goldman is strongest—dragged down earnings.
Analysts polled by Thomson Reuters had expected Goldman to earn
$3.82 a share on revenue of $7.42 billion.
Shares climbed 1.6% premarket.
"We saw solid performance across the franchise that helped
counter typical seasonal weakness," Chief Executive Lloyd Blankfein
said in prepared remarks. "We continue to manage our balance sheet
conservatively and are benefiting from the breadth of our offerings
to clients."
Goldman's return on equity, a closely watched measure of
profitability, stood at 11.2% in the third quarter. It was 7% in
the year-earlier quarter and hadn't exceeded 10%—the firm'
theoretical cost of capital—since early 2015.
Investors' expectations of a strong quarter built in recent days
after rivals including J.P. Morgan Chase & Co. and Citigroup
Inc. reported big boosts in their trading businesses.
Goldman's trading revenue increased 17%, driven largely by a 34%
increase in revenue from fixed income, currency and commodities
trading. Meanwhile, equities trading revenue edged up 2%.
The bank gets the biggest chunk of its revenue from trading,
where it buys and sells stocks, bonds, currencies and other
instruments on behalf of investing clients.
Goldman shares are up 14% since the end of the second quarter
but remain down 6.2% year to date, worse than a 2.9% decline in the
KBW Nasdaq Bank index.
Write to Liz Hoffman at liz.hoffman@wsj.com
(END) Dow Jones Newswires
October 18, 2016 08:05 ET (12:05 GMT)
Copyright (c) 2016 Dow Jones & Company, Inc.
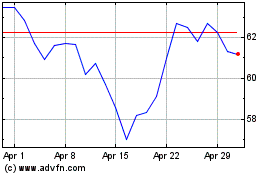
Citigroup (NYSE:C)
Historical Stock Chart
From Mar 2024 to Apr 2024

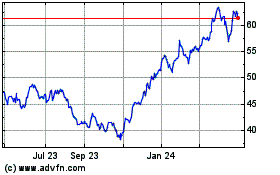
Citigroup (NYSE:C)
Historical Stock Chart
From Apr 2023 to Apr 2024
