FORM 6-K
SECURITIES AND EXCHANGE COMMISSION
Washington, D.C. 20549
Report of Foreign Private Issuer
Pursuant to Rule 13a-16 or 15d-16
of the Securities Exchange Act of 1934
October 27, 2015
| Commission File Number |
001-31335 |
| |
. |
| |
AU Optronics Corp. |
| |
(Translation of registrant’s
name into English) |
| |
|
| |
No. 1 Li-Hsin Road 2 |
| |
Hsinchu Science Park |
| |
Hsinchu, Taiwan |
| |
(Address of principal executive
offices) |
| |
|
|
Indicate by check mark whether the registrant files or will
file annual reports under cover Form 20-F or Form 40-F.
| Form 20-F X Form 40-F ___ |
Indicate by check mark if the registrant is submitting the Form
6-K in paper as permitted by Regulation S-T Rule 101(b)(1):
____
Note: Regulation S-T Rule 101(b)(1) only permits the
submission in paper of a Form 6-K if submitted solely to provide an attached annual report to security holders.
Indicate by check mark if the registrant is submitting the Form
6-K in paper as permitted by Regulation S-T Rule 101(b)(7):
____
Note: Regulation S-T Rule 101(b)(7) only permits the
submission in paper of a Form 6-K if submitted to furnish a report or other document that the registrant foreign private issuer
must furnish and make public under the laws of the
jurisdiction in which the registrant is incorporated, domiciled or legally organized
(the registrant's "home country"), or under the rules of the home country exchange on which the registrant's securities
are traded, as long as the report or other document is not a press release, is not required to be and has not been distributed
to the registrant's security holders, and, if discussing a material event, has already been the subject of a Form 6-K submission
or other Commission filing on EDGAR.
Indicate by check mark whether by furnishing the information
contained in this Form, the registrant is also thereby furnishing the information to the Commission pursuant to Rule 12g3-2(b)
under the Securities Exchange Act of 1934.
If "Yes" is marked, indicate below the file number
assigned to the registrant in connection with Rule 12g3-2(b):
Not applicable
INDEX TO EXHIBITS
Item
| 1. | Press release entitled, “AU Optronics Corp. Reports Third Quarter 2015 Financial Results” dated October 27, 2015. |
| 2. | Investor Conference Materials entitled, “AU Optronics Corp. Third Quarter 2015 Results”, dated October 27, 2015. |
Signatures
Pursuant to the requirements of the Securities Exchange Act
of 1934, the registrant has duly caused this report to be signed on its behalf by the undersigned, thereunto duly authorized.
| |
AU Optronics Corp. |
|
| |
|
|
| |
|
|
| Date: October 27, 2015 |
By: |
/s/ Andy Yang |
|
| |
|
Name: |
Andy Yang |
|
| |
|
Title: |
Chief Financial Officer |
|
Item 1

News Release
AU Optronics Corp. Reports Net Profit
of NT$3.38 billion for Third Quarter 2015
Issued by:
AU Optronics Corp.
Issued on: October 27, 2015
Hsinchu, Taiwan, October 27, 2015–
AU Optronics Corp. ("AUO" or the
"Company") (TAIEX: 2409; NYSE: AUO) today held its investor conference and announced its unaudited consolidated financial
results for the third quarter of 2015(1).
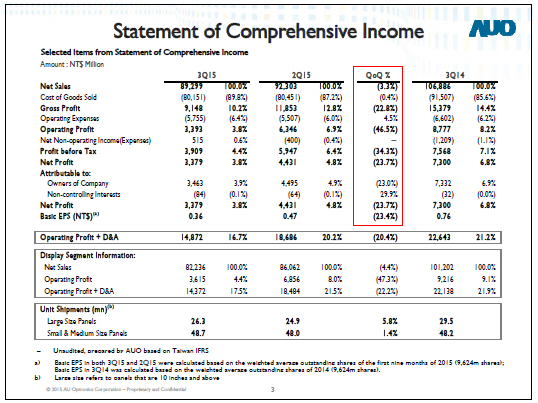
Consolidated revenues in the third quarter
of 2015 were NT$89.30 billion, down 3.3% from the previous quarter. Gross profit was NT$9.15 billion, with a gross margin of 10.2%.
Operating profit was NT$3.39 billion, with an operating margin of 3.8%. AUO’s net profit for the third quarter of 2015 was
NT$3.38 billion. Net profit attributable to owners of the Company was NT$3.46 billion, with a basic EPS(2) of NT$0.36.
For the first nine months of 2015, AUO reported
consolidated revenues of NT$276.90 billion. Net profit was NT$13.08 billion, with a basic EPS(2) of NT$1.36.
In the third quarter of 2015, large-sized
panel(3) shipments exceeded 26.34 million units, up by 5.8% quarter-over-quarter.
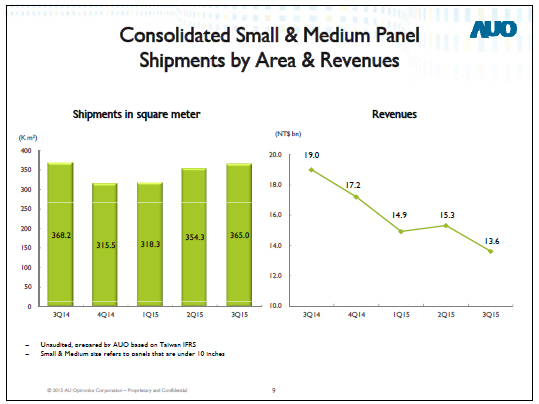
Shipments of small-and-medium-sized panels in the same quarter were around 48.71 million units, an increase of 1.4% quarter-over-quarter.
AUO’s unaudited consolidated results
for the third quarter of 2015 were highlighted as below:
| Ÿ | Revenues of NT$89.30 billion |
| Ÿ | Operating profit of NT$3.39 billion |
| Ÿ | Net profit of NT$3.38 billion |
1/3

News
Release
| Ÿ | Operating margin was 3.8% |
| Ÿ | EBITDA(4)
margin was 16.7% |
| Ÿ | Operating margin of Display Segment was
4.4% |
| Ÿ | EBITDA(4)
margin of Display Segment was 17.5% |
Looking back to the third quarter, AUO’s
revenue declined by 3.3% quarter-over-quarter due to decline of panel prices. AUO has proactively responded to the challenges with
diversified product portfolios, and has dynamically adjusted its capacity allocation. As a result, AUO’s operating profit
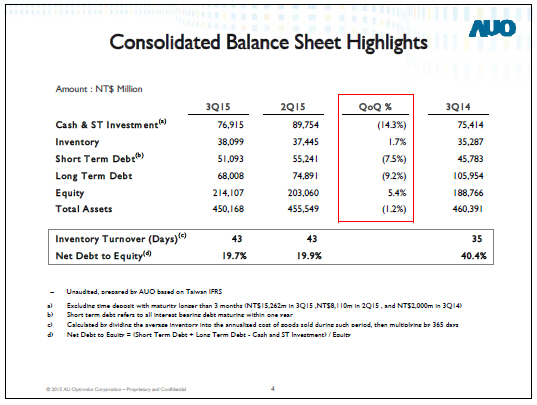
margin and EBITDA margin still achieved 3.8% and 16.7%, respectively. In addition, the Company continues to strengthen AUO’s
financial structure to counter industry fluctuations. As a result, the Company's net debt to equity ratio was further lowered to
19.7%, the lowest since 2009.
Stepping into the fourth quarter, AUO faces
the challenges from both the traditional slow season for the display panel industry and the macroeconomic uncertainties. AUO will
accelerate the development of new products for next year, and lay a foundation for its ability to capture orders and for its manufacturing
capabilities next year. AUO expects to bring in fresh momentum through the organizational structure optimization and the brand
new management arrangements. At the same time, AUO hopes the new management team can lead the Company to surpass scale competition
in the industry, aiming to build long-term competitiveness in value-creation.
(1) All
financial information was unaudited and was prepared by the Company in accordance with Taiwan IFRS.
(2) Basic
EPS in the third quarter of 2015 and the first nine months of 2015 were calculated based on the weighted average outstanding shares
of the first nine months of 2015 (9,624 million shares).
(3) Large
size refers to panels that are 10 inches and above in diagonal measurement.
(4) EBITDA
= Operating Profit + D&A, that is, operating profit before depreciation and amortization.
###
ABOUT AU OPTRONICS
AU Optronics Corp. (AUO) is one of the world’s
leading providers of optoelectronic solutions. AUO offers a full range of panel sizes and comprehensive applications ranging from
1.4 inches to 85 inches. Based on its
2/3

News
Release
profound R&D and manufacturing experience, AUO continues to develop advanced display
technologies of the next generation. AUO extended its market to the green energy industry in 2008. By building a vertically integrated
high-efficiency solar value chain, AUO provides its customers with high-efficiency solar solutions. AUO currently has global operations
in Taiwan, Mainland China, the U.S., Japan, South Korea, Singapore, the Netherlands, Czech and Slovakia. Additionally, AUO is the
first pure TFT-LCD manufacturer to be successfully listed at the New York Stock Exchange (NYSE). AUO has also been named to Dow
Jones Sustainability World Index from 2010 to 2015. AUO generated consolidated revenues of NT$408.18 billion in 2014. For more
information, please visit AUO.com.
Safe
Harbour Notice
AU Optronics Corp. (“AUO” or
the “Company”) (TAIEX: 2409; NYSE: AUO), a global leader of TFT-LCD panels, today announced the above news. Except
for statements in respect of historical matters, the statements contained in this Release are “forward-looking statements”
within the meaning of Section 27A of the U.S. Securities Act of 1933 and Section 21E of the U.S. Securities Exchange Act of 1934.
These forward-looking statements were based on our management's expectations, projections and beliefs at the time regarding matters
including, among other things, future revenues and costs, financial performance, technology changes, capacity, utilization rates,
yields, process and geographical diversification, future expansion plans and business strategy. Such forward looking statements
are subject to a number of known and unknown risks and uncertainties that can cause actual results to differ materially from those
expressed or implied by such statements, including risks related to the flat panel display industry, the TFT-LCD market, acceptance
of and demand for our products, technological and development risks, competitive factors, and other risks described in the section
entitled "Risk Factors" in our Form 20-F filed with the United States Securities and Exchange Commission on March 24th,
2015.
For more information, please contact:
| Gwen Ting |
Jessie Lee |
| Corporate Communications Division |
Corporate Communications Division |
| AU Optronics Corp. |
AU Optronics Corp. |
| Tel: +886-3-5008800 ext 7259 |
Tel: +886-3-5008800 ext 3206 |
| Fax: +886-3-5772730 |
Fax: +886-3-5772730 |
| Email: gwen.ting@auo.com |
Email : jessie.jc.lee@auo.com |
3/3
Item 2
AU
Optronics Corp.
Third Quarter 2015 Results Investor Conference

•
The statements included in this presentation that are not historical in nature are “forward-looking statements” within
the meaning of Section 27A of the United States Securities Act of 1933 and Section 21E of the United States Securities Exchange
Act of 1934. These forward-looking statements, which may include statements regarding AU Optronics’ future results of operations,
financial condition or business prospects, are subject to significant risks and uncertainties and are based on AU Optronics’
current expectations.
•
Actual results may differ materially from those expressed or implied in these forward-looking statements for a variety of reasons,
including, among other things: the cyclical nature of our industry; our dependence on introducing new products on a timely basis;
our dependence on growth in the demand for our products; our ability to compete effectively; our ability to successfully expand
our capacity; our dependence on key personnel; general economic and political conditions, including those related to the TFT-LCD
industry; possible disruptions in commercial activities caused by natural and human-induced disasters, including terrorist activity
and armed conflict; and fluctuations in foreign currency exchange rates.
•
Beginning on January 1, 2013, we have adopted the International Financial Reporting Standards as issued by the International Accounting
Standards Board (“IFRS”) to the extent endorsed by the ROC Financial Supervisory Commission (“FSC”) (“Taiwan
IFRS”) for reporting our annual and interim consolidated financial statements in the ROC in accordance with the requirements
of the FSC. All financial information contained herewithin is presented in conformity with Taiwan IFRS. Readers should be cautioned
that Taiwan IFRS differs in many material respects from IFRS including to the extent that any new or amended standards or interpretations
applicable under IFRS may not be timely endorsed by the FSC.
Our release of financial forecasts
and forward-looking statements at any particular time does not create any duty of disclosure beyond that which is imposed by law,
and we expressly disclaim any obligation to publicly update or revise any forecasts or forward-looking statements, whether as
a result of new information, future events or otherwise.
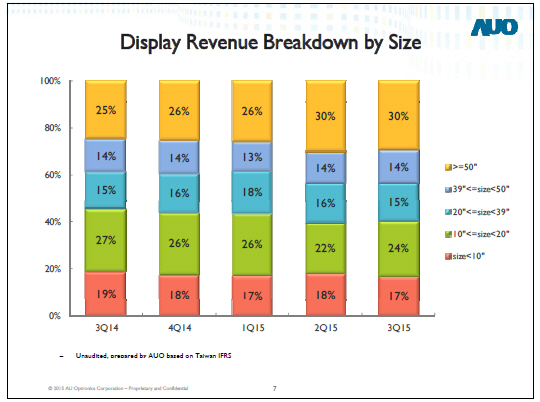
Large size refers to panels that are 10 inches and above


AU OPTRONICS CORP.
CONSOLIDATED COMPREHENSIVE
INCOME STATEMENT
For the Three Months
Ended September 30, 2015 and 2014 and June 30, 2015
(Expressed
in Millions of New Taiwan Dollars (NTD) and US Dollars (USD) except for per share amounts and shares outstanding)
| |
|
|
Year
over Year Comparison |
|
|
|
|
|
Sequential
Comparison |
|
|
| |
3Q 2015 |
|
% of |
|
3Q 2014 |
|
YoY |
|
3Q 2015 |
|
% of |
|
2Q 2015 |
|
QoQ |
| |
USD |
|
NTD |
|
Sales |
|
NTD |
|
Chg
% |
|
USD |
|
NTD |
|
Sales |
|
NTD |
|
Chg
% |
| Net Sales |
2,708 |
89,299 |
100.0 |
106,886 |
(16.5) |
2,708 |
89,299 |
100.0 |
92,303 |
(3.3) |
| Cost of Goods Sold |
2,430 |
|
80,151 |
|
89.8 |
|
91,507 |
|
(12.4) |
|
2,430 |
|
80,151 |
|
89.8 |
|
80,451 |
|
(0.4) |
| Gross Profit |
277 |
|
9,148 |
|
10.2 |
|
15,379 |
|
(40.5) |
|
277 |
|
9,148 |
|
10.2 |
|
11,853 |
|
(22.8) |
| Operating Expenses |
174 |
|
5,755 |
|
6.4 |
|
6,602 |
|
(12.8) |
|
174 |
|
5,755 |
|
6.4 |
|
5,507 |
|
4.5 |
| Operating Profit |
103 |
|
3,393 |
|
3.8 |
|
8,777 |
(61.3) |
|
103 |
|
3,393 |
|
3.8 |
|
6,346 |
|
(46.5) |
| Net Non-Operating Income (Expense) |
16 |
|
515 |
|
0.6 |
|
(1,209) |
|
- |
|
16 |
|
515 |
|
0.6 |
|
(400) |
|
- |
| Profit before Income Tax |
119 |
|
3,909 |
|
4.4 |
|
7,568 |
|
(48.4) |
|
119 |
|
3,909 |
|
4.4 |
|
5,947 |
|
(34.3) |
| Income Tax Expense |
(16) |
|
(529) |
|
(0.6) |
|
(268) |
|
97.4 |
|
(16) |
|
(529) |
|
(0.6) |
|
(1,516) |
|
(65.1) |
| Net Profit |
102 |
3,379 |
3.8 |
7,300 |
(53.7) |
102 |
3,379 |
3.8 |
4,431 |
(23.7) |
| |
|
|
|
|
|
|
|
|
|
|
|
|
|
|
|
|
|
|
|
| Other Comprehensive Income (Loss) |
78 |
|
2,566 |
|
2.9 |
|
1,001 |
|
156.4 |
|
78 |
|
2,566 |
|
2.9 |
|
(1,128) |
|
- |
| Total Comprehensive Income |
180 |
|
5,945 |
|
6.7 |
|
8,301 |
|
(28.4) |
|
180 |
|
5,945 |
|
6.7 |
|
3,303 |
|
80.0 |
| Net Profit Attributable to: |
|
|
|
|
|
|
|
|
|
|
|
|
|
|
|
|
|
|
|
| Owners of Company |
105 |
3,463 |
3.9 |
7,332 |
(52.8) |
105 |
3,463 |
3.9 |
4,495 |
(23.0) |
| Non-controlling Interests |
(3) |
|
(84) |
|
(0.1) |
|
(32) |
|
160.3 |
|
(3) |
|
(84) |
|
(0.1) |
|
(64) |
|
29.9 |
| Net Profit |
102 |
|
3,379 |
|
3.8 |
|
7,300 |
|
(53.7) |
|
102 |
|
3,379 |
|
3.8 |
|
4,431 |
|
(23.7) |
| Total Comprehensive Income Attributable to: |
|
|
|
|
|
|
|
|
|
|
|
|
|
|
|
|
|
|
|
| Owners of Company |
178 |
5,864 |
6.6 |
8,114 |
(27.7) |
178 |
5,864 |
6.6 |
3,555 |
65.0 |
| Non-controlling Interests |
2 |
|
82 |
|
0.1 |
|
187 |
|
(56.5) |
|
2 |
|
82 |
|
0.1 |
|
(252) |
|
- |
| Total Comprehensive Income |
180 |
|
5,945 |
|
6.7 |
|
8,301 |
|
(28.4) |
|
180 |
|
5,945 |
|
6.7 |
|
|
3,303 |
|
80.0 |
| Basic Earnings Per Share |
0.01 |
|
0.36 |
|
|
|
0.76 |
|
|
|
0.01 |
|
0.36 |
|
|
|
0.47 |
|
|
| Basic Earnings Per ADS(3) |
0.11 |
3.60 |
|
|
7.62 |
|
|
0.11 |
3.60 |
|
|
4.67 |
|
|
| Weighted-Average Shares Outstanding ('M) |
|
|
9,624 |
|
|
|
9,624 |
|
|
|
|
|
9,624 |
|
|
|
9,624 |
|
|
| Note: |
(1) Unaudited, prepared by AUO based on Taiwan
IFRS |
| |
|
|
(2) Amounts in New Taiwan dollars were translated into
US dollars at the exchange rate of NTD 32.98 per USD as of September 30, 2015 |
| |
|
|
(3) 1 ADS equals 10 common share |
AU OPTRONICS CORP.
CONSOLIDATED BALANCE SHEET
September 30, 2015 and 2014
(Expressed
in Millions of New Taiwan Dollars (NTD) and US Dollars (USD))
| |
|
|
September 30, 2015 |
|
|
September 30, 2014 |
|
YoY |
|
| ASSETS |
USD |
|
|
NTD |
% |
|
NTD |
% |
|
Change |
% |
| Cash and Cash Equivalents |
|
2,332 |
76,915 |
17.1 |
75,414 |
16.4 |
1,502 |
2.0 |
| Notes & Accounts Receivables |
1,330 |
43,874 |
9.7 |
50,756 |
11.0 |
(6,882) |
(13.6) |
| Other Current Financial Assets |
511 |
16,848 |
3.7 |
4,764 |
1.0 |
12,084 |
253.7 |
| Inventories |
1,155 |
38,099 |
8.5 |
35,287 |
7.7 |
2,812 |
8.0 |
| Other Current Assets |
155 |
|
5,102 |
1.1 |
|
6,088 |
1.3 |
|
(986) |
(16.2) |
| Total Current Assets |
5,483 |
|
|
180,838 |
40.2 |
|
172,308 |
37.4 |
|
8,529 |
4.9 |
| Long-term Investments |
429 |
|
|
14,159 |
3.1 |
|
13,884 |
3.0 |
|
275 |
2.0 |
| Net Fixed Assets |
6,570 |
|
|
216,670 |
48.1 |
|
237,696 |
51.6 |
|
(21,025) |
(8.8) |
| Other Assets |
1,167 |
|
|
38,501 |
8.6 |
|
36,503 |
7.9 |
|
1,998 |
5.5 |
| Total Assets |
13,650 |
|
|
450,168 |
100.0 |
|
460,391 |
100.0 |
|
(10,223) |
(2.2) |
| LIABILITIES |
|
|
|
|
|
|
|
|
|
|
|
| Short-term Borrowings |
|
56 |
1,836 |
0.4 |
677 |
0.1 |
1,160 |
171.4 |
| Accounts Payable |
2,013 |
66,385 |
14.7 |
75,896 |
16.5 |
(9,511) |
(12.5) |
| Current Installments of Long-term Borrowings |
1,476 |
48,691 |
10.8 |
45,107 |
9.8 |
3,584 |
7.9 |
| Current Installments of Bonds Payable |
17 |
566 |
0.1 |
0 |
0.0 |
566 |
- |
| Current Financial Liabilities |
10 |
320 |
0.1 |
377 |
0.1 |
(57) |
(15.1) |
| Accrued Expense & Other Current Liabilities |
978 |
32,263 |
7.2 |
29,430 |
6.4 |
2,833 |
9.6 |
| Machinery and Equipment Payable |
180 |
|
5,936 |
1.3 |
|
4,681 |
1.0 |
|
1,255 |
26.8 |
| Total Current Liabilities |
4,730 |
|
|
155,997 |
34.7 |
|
156,167 |
33.9 |
|
(170) |
(0.1) |
| Long-term Borrowings |
2,062 |
|
68,008 |
15.1 |
90,539 |
19.7 |
(22,531) |
(24.9) |
| Bonds Payable |
0 |
0 |
0.0 |
15,416 |
3.3 |
(15,416) |
(100.0) |
| Non Current Financial Liabilities |
0 |
11 |
0.0 |
1 |
0.0 |
10 |
951.4 |
| Other Long-term Liabilities |
365 |
|
12,046 |
2.7 |
|
9,503 |
2.1 |
|
2,543 |
26.8 |
| Total Long-term Liabilities |
2,428 |
|
|
80,064 |
17.8 |
|
115,458 |
25.1 |
|
(35,394) |
(30.7) |
| Total Liabilities |
7,158 |
|
|
236,062 |
52.4 |
271,626 |
59.0 |
(35,564) |
(13.1) |
| EQUITY |
|
|
|
|
|
|
|
|
|
|
|
| Common Stock |
|
2,918 |
96,242 |
21.4 |
96,242 |
20.9 |
0 |
0.0 |
| Capital Surplus |
1,822 |
60,098 |
13.4 |
59,459 |
12.9 |
639 |
1.1 |
| Retained Earnings |
874 |
28,815 |
6.4 |
15,549 |
3.4 |
13,267 |
85.3 |
| Other Equity |
174 |
5,725 |
1.3 |
3,545 |
0.8 |
2,180 |
61.5 |
| Non-Controlling Interests |
704 |
|
23,226 |
5.2 |
|
13,971 |
3.0 |
|
9,255 |
66.2 |
| Total Equity |
6,492 |
|
|
214,107 |
47.6 |
|
188,766 |
41.0 |
|
25,341 |
13.4 |
| Total Liabilities & Equity |
13,650 |
|
|
450,168 |
100.0 |
|
460,391 |
100.0 |
|
(10,223) |
(2.2) |
| Note: |
(1) Unaudited, prepared by
AUO based on Taiwan IFRS |
| |
|
| |
(2)
Amounts in New Taiwan dollars were translated into US dollars at the exchange rate of NTD 32.98 per USD as of September
30, 2015 |
| |
|
| |
(3) Cash
and Cash Equivalents excluding time deposit with maturity longer than 3 months |
AU OPTRONICS
CORP.
CONSOLIDATED
STATEMENT OF CASH FLOW
For
the Period Ended September 30, 2015 and 2014
(Expressed
in Millions of New Taiwan Dollars (NTD) and US Dollars (USD))
| |
Nine
Months 2015 |
|
Nine Months
2014 |
| |
USD |
|
NTD |
|
NTD |
| Cash Flow from Operating Activities: |
|
|
|
|
|
| Profit before Income Taxes |
474 |
15,629 |
12,047 |
| Depreciation & Amortization |
1,128 |
37,204 |
43,387 |
| Share of Profit of Equity-Accounted Investees |
(13) |
(433) |
(343) |
| Changes in Working Capital |
(501) |
(16,537) |
(9,179) |
| Changes in Others |
25 |
|
822 |
|
(392) |
| Net Cash Provided by Operating Activities |
1,112 |
36,685 |
45,520 |
| Cash Flow from Investing Activities: |
|
|
|
|
|
| Proceeds from Disposal of AFS Investments |
0 |
0 |
417 |
| Acquisition of Property, Plant and Equipment |
(591) |
(19,504) |
(13,919) |
| Proceeds from Disposal of Property, Plant and Equipment |
26 |
869 |
888 |
| Acquisition of Financial Assets Carried at Cost |
(0) |
(1) |
(2) |
| Proceeds from Disposal of Equity-Accounted Investees and Financial
Assets Carried at Cost |
3 |
97 |
1,146 |
| Decrease(Increase) in Other Financial Assets |
4 |
148 |
(143) |
| Increase in Intangible Assets |
(9) |
(301) |
(18) |
| Decrease(Increase) in Other Assets |
(0) |
|
(4) |
|
64 |
| Net Cash Used in Investing Activities |
(567) |
(18,696) |
(11,567) |
| Cash Flow from Financing Activities: |
|
|
|
|
|
| Increase(Decrease) in Short-term Borrowings |
44 |
1,455 |
(2,781) |
| Decrease in Long-term Borrowings and Bonds Payable |
(793) |
(26,137) |
(30,812) |
| Increase(Decrease) in Guarantee Deposits |
1 |
31 |
(94) |
| Cash Dividends and Cash Distributed from Capital Surplus |
(146) |
(4,812) |
(1,444) |
| Changes in Non-Controlling Interests and Others |
161 |
|
5,299 |
|
119 |
| Net Cash Used by Financing Activities |
(733) |
(24,165) |
(35,011) |
| Effect of Exchange Rate Changes on Cash |
34 |
|
1,125 |
|
159 |
| Net Decrease in Cash and Cash Equivalents |
(153) |
(5,050) |
(899) |
| Cash and Cash Equivalents at Beginning of Period |
2,485 |
|
81,965 |
|
76,312 |
| Cash and Cash Equivalents at End of Period |
2,332 |
|
76,915 |
|
75,414 |
| Note: |
(1) Unaudited, prepared by
AUO based on Taiwan IFRS |
| |
|
| |
(2) Amounts in New Taiwan dollars were
translated into US dollars at the exchange rate of NTD 32.98 per USD as of September 30, 2015 |
AU Optronics (NYSE:AUO)
Historical Stock Chart
From Mar 2024 to Apr 2024

AU Optronics (NYSE:AUO)
Historical Stock Chart
From Apr 2023 to Apr 2024
