UNITED STATES
SECURITIES AND EXCHANGE COMMISSION
WASHINGTON, D.C. 20549
Form 6-K
REPORT OF FOREIGN PRIVATE ISSUER
PURSUANT TO RULE 13a-16 OR 15d-16 UNDER THE
SECURITIES EXCHANGE ACT OF 1934
For the month of
October 2015
Commission File Number: 1-9059
Barrick Gold
Corporation
(Registrant’s name)
Brookfield
Place, TD Canada Trust Tower, Suite 3700
161 Bay Street, P.O. Box 212
Toronto, Ontario M5J 2S1 Canada
(Address of principal executive offices)
Indicate by check mark whether the registrant files or
will file annual reports under cover of Form 20-F or Form 40-F.
Form
20-F ¨ Form 40-F x
Indicate by check mark if the registrant is submitting the Form 6-K in paper as permitted by Regulation S-T Rule 101(b)(1): ¨
Indicate by check mark if the registrant is submitting the Form 6-K in paper as permitted by Regulation
S-T Rule 101(b)(7): ¨
INCORPORATION BY REFERENCE
This report on Form 6-K is hereby incorporated by reference into the Registration Statement on Form F-3 (File No. 333-206417) filed
with the SEC on August 14, 2015.
SIGNATURES
Pursuant to the requirements of the Securities Exchange Act of 1934, the registrant has duly caused this report to be signed on its behalf by
the undersigned, thereunto duly authorized.
|
|
|
|
|
|
|
|
|
|
|
|
|
|
|
BARRICK GOLD CORPORATION |
|
|
|
|
| Date: October 29, 2015 |
|
|
|
By: |
|
/s/ Richie Haddock |
|
|
|
|
|
|
Name: |
|
Richie Haddock |
|
|
|
|
|
|
Title: |
|
Senior Vice President and |
|
|
|
|
|
|
|
|
General Counsel |
EXHIBIT
|
|
|
| Exhibit |
|
Description of Exhibit |
|
|
| 99.1 |
|
Barrick Gold Corporation Third Quarter Report for 2015, including the Comparative Unaudited Financial Statements prepared in accordance with International Financial Reporting Standards (“IFRS”) and the notes thereto for
the three months ended September 30, 2015 and Management’s Discussion and Analysis (“MD&A”) for the same period. |
Exhibit 99.1

THIRD QUARTER REPORT 2015
All amounts
expressed in US dollars
Barrick Reports Third Quarter 2015 Results
Growing
Free Cash Flow
| |
● |
|
The company reported adjusted net earnings of $131 million ($0.11 per share)1 and a net loss of $264
million ($0.23 per share) in the third quarter. |
| |
● |
|
Third quarter adjusted EBITDA was $942 million1; EBITDA was $490 million1. |
| |
● |
|
Free cash flow was $866 million1, or $256 million excluding proceeds from the Pueblo Viejo streaming
transaction. |
| |
● |
|
Gold production in the third quarter was 1.66 million ounces at all-in sustaining costs (AISC) of $771 per ounce1 |
| |
● |
|
Full-year gold production is expected to be 6.1-6.3 million ounces. |
| |
● |
|
Full-year all-in sustaining cost guidance reduced to $830-$870 per ounce from previous range of $840-$880 per ounce. |
| |
● |
|
On track to achieve $2 billion in cash flow improvements by end of 2016. |
| |
● |
|
Total debt reduced by 15 percent year-to-date, on track to achieve $3 billion debt reduction target. |
| |
● |
|
Progressing drilling and feasibility study work to convert resources to reserves over the next five years at Cortez, Goldstrike, Lagunas Norte, Pueblo Viejo,
Turquoise Ridge and other sites. |
TORONTO,
October 28, 2015 — Barrick Gold Corporation (NYSE:ABX)(TSX:ABX) (Barrick or the “company”) today reported adjusted net earnings of $131 million ($0.11 per share) for the third quarter and a net loss of $264 million ($0.23 per
share). Third quarter adjusted EBITDA was $942 million and EBITDA was $490 million. Free cash flow was $866 million, or $256 million excluding the impact of $610 million in proceeds from the Pueblo Viejo streaming transaction2.
Production in the third quarter was in line with expectations at
1.66 million ounces of gold. All-in sustaining costs were $771 per ounce and cash costs were $570 per ounce1. Full-year 2015 gold production is expected to be 6.1-6.3 million ounces at
lower all-in sustaining costs of $830-$870 per ounce.
Our objective is to grow free cash flow per share from a portfolio of
high-quality gold assets through disciplined capital allocation and operational excellence. In support of this objective, we have returned to a leaner, decentralized operating model designed to maximize free cash flow and
1 Adjusted net earnings, adjusted net earnings per share, adjusted EBITDA, EBITDA, free cash flow, all-in sustaining costs per ounce and cash costs per ounce are non-GAAP financial performance measures
with no standardized definition under IFRS. For further information and detailed reconciliations, please see pages 52-58 of Barrick’s Third Quarter 2015 Report.
2 Please see page 23 of Barrick’s Third Quarter 2015 Report for more information about the
Pueblo Viejo streaming transaction.
|
|
|
|
|
| BARRICK THIRD QUARTER 2015 |
|
1 |
|
PRESS RELEASE |
improve execution. Clear capital allocation criteria, including a 15 percent hurdle rate for all investments, are driving greater financial rigor and stronger returns. The divestment of non-core
assets has refocused our portfolio and we have formed vital new strategic partnerships that will drive new opportunities in the future.
All of this is driving stronger performance across the business, reflected by two consecutive quarters of positive free cash flow and
improved costs. At the same time, we are strengthening our balance sheet and remain on track to reduce debt by $3 billion. This momentum will support our overriding objective of growing free cash flow per share, underpinned by a strong pipeline of
organic projects and mine site expansion opportunities in our core regions.
STRENGTHENING THE BALANCE SHEET
Earlier this year, we set a $3 billion debt reduction target for 2015. We said we would achieve this through the disciplined sale of non-core assets,
the formation of new joint ventures and partnerships, and by maximizing free cash flow from our operations. Thus far, we have completed or announced asset sales, joint ventures and partnerships valued at $2.46 billion. We have also generated $282
million in positive free cash flow in the last two quarters despite a lower gold price, reflecting the impact of our efforts to maximize free cash flow across the company. Both asset sales and cash flow improvements have been credit positive, and
have resulted in improvements to our debt-to-EBITDA ratio. Achieving our $3 billion debt reduction target will also reduce annual pre-tax interest payments by approximately $140 million.
So far this year, total debt has been reduced by 15 percent, from $13.1 billion to $11.2 billion3, significantly reducing our near-term debt repayment obligations. We currently have less than $250 million in debt due before 2018 and approximately $5 billion of our $11.2 billion in outstanding
debt matures after 2032. Building on $1.9 billion in repayments already completed this year, we intend to use approximately $1 billion in proceeds from the sale of 50 percent of Zaldívar to reduce debt. The sale is expected to close in the
fourth quarter. This would bring total debt repayments to approximately $2.9 billion. We intend to use free cash flow to reach our target of $3 billion.
Assuming the completion of $3 billion in repayments, total debt will have been reduced by 23 percent, from $13.1 billion to $10.1
billion.
We also expect to announce the outcome of a process for the sale of certain non-core U.S. assets in the fourth quarter. As
we move into 2016 and beyond, we will continue to take prudent steps to strengthen our balance sheet, balancing debt repayments with investments in profitable production that will drive growth in free cash flow and EBITDA.
Our liquidity position continues to improve, with strong cash flow generation, very modest near-term debt repayment obligations, a $4
billion undrawn credit facility and $3.34 billion in cash on hand at the end of the third quarter.
3 Total debt as of October 28, 2015.
4 $1.1
billion used for debt retirement purposes subsequent to quarter end. Total includes $449 million held at Acacia and Pueblo Viejo, which may not be readily deployed outside of Acacia and/or Pueblo Viejo.
|
|
|
|
|
| BARRICK THIRD QUARTER 2015 |
|
2 |
|
PRESS RELEASE |
FINANCIAL DISCUSSION
Free cash flow increased to $866 million, or $256 million excluding the impact of $610 million in proceeds from the Pueblo Viejo streaming transaction.
This compares to $26 million in free cash flow in the second quarter of 2015. Two consecutive quarters of positive free cash flow after a prolonged period of negative free cash flow reflects our driving focus on maximizing free cash flow through
greater capital discipline, operational efficiencies and strong cost management.
Third quarter 2015 adjusted net earnings were $131
million ($0.11 per share) compared to $222 million ($0.19 per share) in the prior year period. The net loss for the quarter was $264 million ($0.23 per share) compared to net earnings of $125 million ($0.11 per share) in the prior year quarter.
Lower adjusted net earnings reflect lower realized gold and copper prices and higher depreciation compared to the prior year period, partially offset by increased gold and copper sales. Significant adjusting items for the quarter (net of tax and
non-controlling interest effects) include:
| |
● |
|
$455 million in impairment charges primarily related to the reclassification of our Zaldívar mine as held-for-sale; and |
| |
● |
|
$29 million in costs arising from the write-down of obsolete supplies inventory; partially offset by |
| |
● |
|
$52 million of gains related to the sale of our Cowal mine and 50 percent of our interest in the Porgera mine; and |
| |
● |
|
$45 million in unrealized foreign currency translation gains. |
Third quarter adjusted EBITDA was $942 million compared to $1.1 billion in the prior year period. On an unadjusted basis, EBITDA was
$490 million for the third quarter compared to $1.0 billion in the prior year period. Operating cash flow was $1.26 billion compared to $852 million in the prior year period. Higher operating cash flow in the quarter reflects the impact of $610
million in proceeds from the Pueblo Viejo streaming transaction.
OPERATING HIGHLIGHTS AND GUIDANCE
Barrick’s operations continued to perform in line with expectations for the year, meeting cost and production targets for the third quarter while
generating stronger free cash flow. We have tightened our gold production guidance range for 2015, from 6.1-6.4 million ounces to 6.1-6.3 million ounces, reflecting lower anticipated gold production from Acacia Mining plc.
All-in sustaining cost guidance for the year has been reduced to $830-$870 per ounce from the previous range of $840-$880 per ounce.
Average all-in sustaining costs for our five core mines are now expected to be $700-$725 per ounce in 2015, down from $725-$775 per ounce at the start of this year. These mines are expected to account for about 75 percent of free cash flow from
operations and 60-65 percent of production in 2015.
Fourth quarter all-in sustaining costs are now expected to be similar to the
third quarter while production is expected to be slightly higher, primarily driven by the impact of higher sustaining capital expenditures offset by higher production at Cortez, Pueblo Viejo, Lagunas Norte and
|
|
|
|
|
| BARRICK THIRD QUARTER 2015 |
|
3 |
|
PRESS RELEASE |
Veladero. We expect significantly higher depreciation in the fourth quarter, primarily related to a drawdown in inventory stockpiles at Cortez, Lagunas Norte and Goldstrike and higher sales
volumes at Pueblo Viejo.
Total copper guidance for 2015 remains unchanged at 480-520 million pounds. Full-year C1 cash costs
are now expected to be $1.60-$1.85 per pound5, down from $1.75-$2.00 per pound, driven by currency impacts and improved costs at Lumwana.
|
|
|
|
|
|
|
|
|
|
|
|
|
|
|
| |
| Gold |
|
Third Quarter
2015 |
|
|
Current
2015 Guidance |
|
|
Original
2015 Guidance |
|
|
|
| |
|
|
|
|
|
| Production (000s of ounces)6 |
|
|
1,663 |
|
|
|
6,100-6,3007 |
|
|
|
6,200-6,600 |
|
|
|
|
|
|
|
|
| AISC ($ per ounce) |
|
|
771 |
|
|
|
830-870 |
|
|
|
860-895 |
|
|
|
|
|
|
|
|
| Cash costs ($ per ounce) |
|
|
570 |
|
|
|
600-625 |
|
|
|
600-640 |
|
|
|
|
|
|
|
|
| Copper |
|
|
|
|
|
|
|
|
|
|
|
|
|
|
| |
|
|
|
|
|
| Production (millions of pounds) |
|
|
140 |
|
|
|
480-520 |
|
|
|
310-340 |
|
|
|
|
|
|
|
|
| C1 cash costs ($ per pound) |
|
|
1.53 |
|
|
|
1.60-1.85 |
|
|
|
1.75-2.00 |
|
|
|
| |
|
|
|
|
|
| Total Capital Expenditures ($ millions)8 |
|
|
384 |
|
|
|
~1,700 |
|
|
|
1,900-2,200 |
|
|
|
| |
Cortez
The Cortez mine
produced 321,000 ounces at all-in sustaining costs of $501 per ounce in the third quarter. Production benefited from higher open pit tonnage and improved underground productivity through the implementation of short interval controls, an initiative
identified as part of our Value Realization review for Cortez. Higher production, lower operating costs and lower sustaining capital drove improved all-in sustaining costs. Production in 2015 is now forecast to be 900,000-950,000 ounces at all-in
sustaining costs of $675-$725 per ounce. Fourth quarter production at Cortez is expected to be slightly higher than the third quarter, at higher costs.
A prefeasibility study for expanded underground mining in an area known as Deep South below currently permitted levels will be completed
in late 2015 and results are expected to be disclosed with the company’s fourth quarter results. Our Value Realization review at Cortez also identified long-hole stoping as the preferred mining method for the deposit, as compared to the
cut-and-fill method previously contemplated for the underground expansion, which could improve the economics of the project. Mineralization in this zone is primarily oxide and higher grade compared to the current underground mine, which is sulfide
in nature. The limits of the Lower Zone have not yet been defined, and drilling has indicated the potential for new targets at depth.
With a 382-square-mile land package, Cortez remains a highly prospective district for Barrick.
5 C1 cash costs per pound is a non-GAAP financial performance measure. See pages 52-58 of
Barrick’s Third Quarter 2015 Report.
6 Barrick’s share.
7 Guidance reflects lower expected production from Acacia.
8 Barrick’s share on a 100 percent accrued basis.
|
|
|
|
|
| BARRICK THIRD QUARTER 2015 |
|
4 |
|
PRESS RELEASE |
Goldstrike
The
Goldstrike mine contributed 328,000 ounces in the third quarter in line with plan, while all-in sustaining costs of $558 per ounce were better than expected due to lower operating costs and lower sustaining capital. Our innovative thiosulfate (TCM)
circuit achieved commercial production in the third quarter, coming in at a capital cost of $610 million. We expect to complete the ramp up of the TCM circuit in the first half of 2016. Goldstrike’s production for 2015 is forecast to be
1.00-1.10 million ounces at improved all-in sustaining costs of $650-$700 per ounce. Fourth quarter production is expected to be similar to the third quarter, at slightly higher costs.
Exploration at Goldstrike is focused on the underground mine where good potential exists at depth, and we plan to accelerate near-mine
development in 2016. During the quarter, we began development of new areas below existing workings at Meikle and Rodeo in order to access deeper reserves which are expected to come into production at the end of 2016. This work will also open up new
drilling platforms to better define future potential in these areas.
Pueblo Viejo (60 percent)
Barrick’s 60 percent share of production from Pueblo Viejo for the third quarter was 172,000 ounces at all-in sustaining costs of $554 per ounce.
Production was slightly below plan due to lower gold grades and recoveries from a higher proportion of carbonaceous ore. All-in sustaining costs were impacted by lower silver recoveries associated with a combination of scheduled autoclave
maintenance in September, lime boil limitations and unscheduled maintenance on the limestone grinding circuit. Modifications to the lime boil are underway, including the addition of two lime boil tanks which will be operational in November. These
additional tanks are expected to improve silver recoveries to the targeted 80 percent level from around 60 percent currently. We continue to forecast attributable production of 625,000-675,000 ounces at all-in sustaining costs of $540-$590 per ounce
in 2015. Production is expected to be higher and costs lower in the fourth quarter compared to the third quarter on higher grades, improved recoveries and better autoclave availability.
At the end of 2014, Pueblo Viejo had approximately six million ounces of gold and 37 million ounces of silver in the measured and
indicated resource category (Barrick’s 60 percent share)9. A significant portion of these resources are not currently included in reserves due to tailings storage constraints. We have
completed a preliminary economic assessment on a plan to remove these constraints to tailings capacity, which if implemented could significantly extend the life of the mine. We expect to complete further engineering work and commission a
prefeasibility study in the second half of 2016 to refine the technical and financial analysis for the increase in tailings storage capacity and to confirm whether the measured and indicated resources described above can be brought into reserves.
9 Estimated in accordance with National Instrument 43-101 as required by Canadian securities
regulatory authorities. For a breakdown and additional detail on tonnes, grade and ounces, see pages 26-33 of Barrick’s 2014 Form 40-F/Annual Information Form.
|
|
|
|
|
| BARRICK THIRD QUARTER 2015 |
|
5 |
|
PRESS RELEASE |
Lagunas Norte
The Lagunas Norte mine contributed 108,000 ounces at all-in sustaining costs of $581 per ounce in the third quarter, in line with expectations.
Production in 2015 is now anticipated to be 550,000–590,000 ounces at improved all-in sustaining costs of $550-$600 per ounce, with stronger production expected in the fourth quarter driven by improved performance at the Phase Five leach pad.
Fourth quarter all-in sustaining costs are expected to be higher than the third quarter, reflecting the sale of higher cost inventory as well as increased sustaining capital for Phase Six leach pad construction. A pre-feasibility study on a plan to
extend the mine life by up to 12 years by mining nearly two million ounces of sulfide ore below the existing open pit is on schedule for completion in 2015.
Veladero
The Veladero mine produced 143,000 ounces of gold
in the third quarter at all-in sustaining costs of $914 per ounce. Production was below plan primarily due to lower grades in the Federico Phase Three pit and adverse weather events in August which impacted leach operations. All-in sustaining costs
were higher than plan on lower gold ounces sold, timing of sustaining capital and lower silver credits. The addition of reagents to the leach circuit was temporarily halted in September following a valve failure on a pipe carrying processing
solution, which led to a discharge to the environment through a diversion channel gate that was open at the time of the incident. Since the incident occurred, our first priority has been the safety of people and the environment. Water samples
analyzed by independent third-parties, including the United Nations, have confirmed that there are no risks to the health of downstream communities as a result of this incident. Restrictions on leaching activities were lifted following
implementation of additional monitoring and corrective actions. Production guidance for 2015 is unchanged at 575,000-625,000 ounces while all-in sustaining cost guidance has been narrowed to $950-$1,000 per ounce. Fourth quarter production is
expected to be higher, at lower all-in sustaining costs driven by better grades, lower capital expenditures and higher silver and inventory credits.
Turquoise
Ridge (75 percent)
The Turquoise Ridge mine contributed 55,000 ounces in the third quarter at all-in sustaining costs of $738 per ounce, in line
with expectations. The mine is forecast to produce 175,000-200,000 ounces in 2015 at improved all-in sustaining costs of $750-$800 per ounce. Detailed engineering and feasibility work on developing an additional shaft — which could bring
forward more than one million ounces of production and roughly double output to an average of 500,000 ounces per year (100 percent basis) at all-in sustaining costs of about $625-$675 per ounce — is on track to be completed by the end of the
year. Work to install additional ventilation capacity has also been initiated.
Porgera (47.5 percent)
The Porgera mine produced 134,000 ounces at all-in sustaining costs of $986 per ounce, in line with plan. Attributable production in 2015 is now expected
to be 400,000-450,000 ounces at all-in
|
|
|
|
|
| BARRICK THIRD QUARTER 2015 |
|
6 |
|
PRESS RELEASE |
sustaining costs of $1,025-$1,125 per ounce, reflecting Barrick’s reduced interest following the sale of 50 percent of Barrick (Niugini) Ltd. to Zijin Mining. Recent drought conditions are
not expected to have a material impact on production in 2015. We expect to increase our exploration budget at Porgera in 2016 to focus on underground targets which have been identified through a new geological model.
Other Mines
Barrick’s other mines — consisting of
Bald Mountain, 50 percent of Round Mountain, Golden Sunlight, Ruby Hill, Hemlo, Cowal, KCGM and Pierina — contributed 298,000 ounces at all-in sustaining costs of $959 per ounce in the third quarter. A sale process is underway for Bald
Mountain, Round Mountain, Ruby Hill, Golden Sunlight and the Spring Valley and Hilltop properties, with strong interest received to date.
Acacia Mining (63.9
percent)
Barrick’s share of third quarter production was lower than expected at 104,000 ounces at all-in sustaining costs of $1,195 per
ounce due to temporary factors impacting output from Bulyanhulu and Buzwagi. We now expect attributable 2015 production from Acacia to be about 460,000 ounces at all-in sustaining costs of approximately $1,155 per ounce.
Copper
Copper production in the third quarter was
140 million pounds at C1 cash costs of $1.53 per pound. For 2015, copper production is anticipated to be 480-520 million pounds at lower C1 cash costs of $1.60-$1.85 per pound, reflecting currency impacts and improved costs at Lumwana.
Lumwana contributed 77 million pounds at C1 cash costs of $1.59 per pound in the third quarter, in line with expectations.
Power restrictions and potential reductions to smelter capacity in Zambia are not expected to have any material impact on Lumwana’s 2015 production guidance. Production is now anticipated to be 260-280 million pounds at lower C1 cash costs
of $1.80-$2.00 per pound in 2015, reflecting higher grades.
Production of 63 million pounds at Zaldívar at C1 cash costs
of $1.47 per pound in the third quarter was in line with plan.
At Jabal Sayid, first shipments of copper-in-concentrate continue to
be anticipated in early 2016. Once the mine reaches full production, average production in the first full five years is expected to be 100 million pounds per year.
TARGETING $2 BILLION IN CASH FLOW IMPROVEMENTS
This year,
we have taken significant actions to improve our business plans, resulting in positive free cash flow for two consecutive quarters. We remain focused on improving productivity and driving down costs to maximize free cash flow from our assets in any
gold price environment.
In support of this, we are targeting $2 billion in cash flow improvements across the company before the end
of 2016, relative to our original internal plans for 2015 and 2016. These improvements
|
|
|
|
|
| BARRICK THIRD QUARTER 2015 |
|
7 |
|
PRESS RELEASE |
are coming from productivity gains and cost reductions across operating expenses, capital spending and corporate overhead.
While a majority of these actions will be incorporated into our 2016 plans, the initial outcomes are reflected in improvements to our
2015 guidance. Total capital expenditures for the year are expected to be 20 percent lower than 2014. Combined with reductions in corporate overhead and other operating cost savings, this has allowed us to reduce our 2015 all-in sustaining cost
guidance by about $30 per ounce since the start of year, from our original range of $860-$895 per ounce to $830-$870 per ounce in the third quarter. We are now focused on optimizing our 2016 plans, with an emphasis on operating cost and productivity
improvements.
Our temporary suspension plan for Pascua-Lama has now been approved by the mining authority in Chile. This will enable
us to complete the transition to care and maintenance, and should allow us to significantly reduce holding costs at the project in 2016. Implementation of the temporary suspension plan could require adjustments resulting from regulatory and legal
actions and weather conditions, which could increase costs associated with the plan.
CONVERTING RESOURCES TO RESERVES
At the end of 2014, Barrick had 93 million ounces of proven and probable gold reserves and 94 million ounces of measured and indicated gold
resources10. At 1.37 grams per tonne, our reserve grade is more than 50 percent higher than the senior peer average11.
For more than 20 years, Barrick has maintained an average reserve mine life of between 10 to 20 years with a track record of replacing
reserves and resources at our operations. Mine life and production rates at the majority of our mines have far surpassed initial estimates and we continue to identify excellent potential for resource conversion at many of our operations. Of our
exploration budget, 65 percent is focused on opportunities at or near our existing operations. Drilling and feasibility study work to convert resources to reserves over the next five years at Cortez, Goldstrike, Lagunas Norte, Pueblo Viejo and
Turquoise Ridge are progressing well. In addition, recent drilling at Hemlo and Porgera indicates strong potential for resource additions. We are also working to advance our Goldrush project in Nevada and drilling to define the limits of
mineralization at the Alturas project in Chile is expected to resume in the fourth quarter, following the South American winter.
An
illustration of the optionality that exists within our portfolio is the recent drill program at Hemlo. In the first quarter, Barrick completed the acquisition of surface and mineral rights adjacent to the Hemlo property in Ontario from subsidiaries
of Newmont Mining. These claims included an area of geological potential adjacent to Barrick’s existing underground workings. Barrick is currently undertaking an underground diamond drilling program in this area to evaluate its potential. To
date, drilling has encountered a number of high grade intercepts with significant potential. These results highlight the ongoing potential of mineral deposits such as the Hemlo camp, even as they become mature operations.
10 Estimated in accordance with National Instrument 43-101 as required by Canadian securities
regulatory authorities. For a breakdown and additional detail on tonnes, grade and ounces, see pages 26-33 of Barrick’s 2014 Form 40-F/Annual Information Form.
11 Senior peers include Newmont, Goldcorp, Kinross and Newcrest.
|
|
|
|
|
| BARRICK THIRD QUARTER 2015 |
|
8 |
|
PRESS RELEASE |
A detailed update on reserves and resources will be provided with the company’s fourth
quarter results in February 2016.
|
|
|
|
|
| BARRICK THIRD QUARTER 2015 |
|
9 |
|
PRESS RELEASE |
APPENDIX 1 — Detailed 2015 Operating and Capital Expenditure Guidance12
|
|
|
|
|
|
|
|
|
| |
| GOLD PRODUCTION AND COSTS |
|
|
|
|
| |
|
Production
(millions of ounces) |
|
AISC13
($ per ounce) |
|
Cash Costs14
($ per ounce) |
|
|
| |
| Cortez |
|
0.900-0.950 |
|
675-725 |
|
540-560 |
|
|
| Goldstrike |
|
1.000-1.100 |
|
650-700 |
|
525-550 |
|
|
| Pueblo Viejo (60%) |
|
0.625-0.675 |
|
540-590 |
|
450-475 |
|
|
| Lagunas Norte |
|
0.550-0.590 |
|
550-600 |
|
330-370 |
|
|
| Veladero |
|
0.575-0.625 |
|
950-1,000 |
|
550-600 |
|
|
| |
| Sub-total |
|
3.800-4.000 |
|
700-725 |
|
500-525 |
|
|
| |
| Porgera (47.5%) |
|
0.400-0.450 |
|
1,025-1,125 |
|
775-825 |
|
|
| Acacia (63.9%) |
|
~0.460 |
|
~1,155 |
|
~760 |
|
|
| KCGM (50%) |
|
0.315-0.330 |
|
850-900 |
|
725-775 |
|
|
| Cowal15 |
|
0.156 |
|
621 |
|
560 |
|
|
| Hemlo |
|
0.200-0.225 |
|
900-940 |
|
675-715 |
|
|
| Turquoise Ridge (75%) |
|
0.175-0.200 |
|
750-800 |
|
570-600 |
|
|
| Round Mountain (50%) |
|
0.170-0.190 |
|
975-1,025 |
|
725-775 |
|
|
| Bald Mountain |
|
0.170-0.195 |
|
1,125-1,175 |
|
600-640 |
|
|
| Golden Sunlight |
|
0.080-0.090 |
|
1,150-1,200 |
|
925-975 |
|
|
| |
| Total Gold |
|
6.100-6.30016 |
|
830-870 |
|
600-625 |
|
|
| |
| |
|
|
|
|
|
|
|
|
| |
| COPPER PRODUCTION AND COSTS |
|
|
|
|
| |
|
Production
(millions of pounds) |
|
C1 cash costs
($ per pound) |
|
C3 fully allocated costs17
($ per pound) |
|
|
| |
| Zaldívar (50%) |
|
210-230 |
|
1.65-1.85 |
|
1.95-2.20 |
|
|
| |
| Lumwana |
|
260-280 |
|
1.80-2.00 |
|
2.25-2.50 |
|
|
| |
| Total Copper |
|
480-520 |
|
1.60-1.85 |
|
2.10-2.35 |
|
|
| |
| |
|
|
|
|
|
|
|
|
| |
| CAPITAL EXPENDITURES |
|
|
|
|
|
|
| |
|
($ millions) |
|
|
|
|
|
|
| |
| Mine site sustaining |
|
1,400-1,50018 |
|
|
|
|
|
|
| Mine site expansion |
|
100-150 |
|
|
|
|
|
|
| Projects |
|
100-150 |
|
|
|
|
|
|
| |
| Total |
|
~1,70018 |
|
|
|
|
|
|
| |
12 2015 guidance is based on gold, copper and oil price assumptions of $1,125/oz, $2.35/lb, and $60/bbl, respectively, a AUS:US exchange rate of 0.80:1, a CAD:US exchange rate of 1.25:1, a CLP:US
exchange rate of 610:1 and a ARS:US exchange rate of 9.70:1.
13 All-in sustaining costs are calculated in
accordance with the standard published by the World Gold Council (“WGC”). See page 54 of Barrick’s Third Quarter 2015 Report for further details.
14 Cash costs reflect our equity share of unit production costs, including the impact of by-product credits, which is calculated in accordance with the standard published by the WGC. See page 54 of
Barrick’s Third Quarter 2015 Report for further details.
15 The Cowal mine was sold effective July 23,
2015.
16 Operating unit guidance ranges reflect expectations at each individual operating unit, but do not add
up to corporate-wide guidance range total.
17 C3 fully allocated costs per pound is a non-GAAP financial
performance measure. See pages 52-58 of Barrick’s Third Quarter 2015 Report.
18 We now expect minesite
sustaining capital expenditures to be in the range of $1,400-$1,500 million and total capital expenditures to be ~$1,700 million compared to our previous guidance ranges of $1,500-$1,700 million and $1,800-$2,100 million, respectively.
|
|
|
|
|
| BARRICK THIRD QUARTER 2015 |
|
10 |
|
PRESS RELEASE |
APPENDIX 2 — Economic Sensitivity Analysis
|
|
|
|
|
|
|
|
|
|
|
| |
| |
|
Hypothetical
Change |
|
Impact on AISC19
($ per ounce) |
|
EBITDA19
($ millions) |
|
FCF19
($ millions) |
|
|
| |
|
|
|
|
|
|
| Gold revenue, net of royalties |
|
+/- $100/oz |
|
n/a |
|
168 |
|
79 |
|
|
|
|
|
|
|
|
| Copper revenue, net of royalties |
|
+/- $0.50/lb |
|
n/a |
|
66 |
|
31 |
|
|
| |
|
|
|
|
|
|
| Gold all-in sustaining costs |
|
|
|
|
|
|
|
|
|
|
|
|
|
|
|
|
| Gold royalties &
production taxes |
|
$100/oz |
|
(3) |
|
5 |
|
2 |
|
|
|
|
|
|
|
|
| WTI crude oil price20, 21 |
|
$10/bbl |
|
(2) |
|
4 |
|
2 |
|
|
| |
|
|
|
|
|
|
| Australian dollar exchange
rate20,21 |
|
+10% |
|
(1) |
|
2 |
|
1 |
|
|
|
|
|
|
|
|
| Australian dollar exchange
rate20,21 |
|
-10% |
|
1 |
|
(2) |
|
(1) |
|
|
| |
|
|
|
|
|
|
| Canadian dollar exchange
rate20 |
|
+10% |
|
(2) |
|
3 |
|
1 |
|
|
|
|
|
|
|
|
| Canadian dollar exchange
rate20 |
|
-10% |
|
1 |
|
(2) |
|
(1) |
|
|
| |
| Copper C1 cash costs |
|
|
|
Impact on C1
($ per pound) |
|
|
|
|
|
|
|
|
|
|
|
|
| WTI crude oil price20,21 |
|
$10/bbl |
|
(0.01) |
|
1 |
|
0 |
|
|
|
|
|
|
|
|
| Chilean peso exchange rate20 |
|
+10% |
|
0.01 |
|
(2) |
|
(1) |
|
|
|
|
|
|
|
|
| Chilean peso exchange rate20 |
|
-10% |
|
(0.07) |
|
10 |
|
5 |
|
|
| |
19 All-in sustaining costs per ounce, EBITDA and free cash flow are non-GAAP financial performance
measures. See pages 52-58 of Barrick’s Third Quarter 2015 Report.
20 Due to our hedging
activities, which are reflected in these sensitivities, we are partially protected against changes in these factors.
21 Impact on EBITDA only reflects contracts that mature in 2015.
|
|
|
|
|
| BARRICK THIRD QUARTER 2015 |
|
11 |
|
PRESS RELEASE |
|
|
|
|
|
|
|
|
|
|
|
|
|
|
|
|
|
| Key Statistics |
|
|
|
|
|
|
|
|
|
|
|
|
|
|
|
|
| Barrick Gold Corporation |
|
|
|
|
|
|
|
|
|
|
|
|
| (in United States dollars) |
|
Three months ended September 30, |
|
|
Nine months ended September 30, |
|
|
|
|
|
|
| |
|
2015 |
|
|
2014 |
|
|
2015 |
|
|
2014 |
|
| |
|
| Operating Results |
|
|
|
|
|
|
|
|
|
|
|
|
|
|
|
|
| Gold production (thousands of ounces)1 |
|
|
1,663 |
|
|
|
1,649 |
|
|
|
4,498 |
|
|
|
4,722 |
|
| Gold sold (thousands of ounces)1 |
|
|
1,596 |
|
|
|
1,578 |
|
|
|
4,447 |
|
|
|
4,712 |
|
| Per ounce data |
|
|
|
|
|
|
|
|
|
|
|
|
|
|
|
|
| Average spot gold price |
|
$ |
1,124 |
|
|
$ |
1,282 |
|
|
$ |
1,178 |
|
|
$ |
1,288 |
|
| Average realized gold price2 |
|
|
1,125 |
|
|
|
1,285 |
|
|
|
1,176 |
|
|
|
1,286 |
|
| Cash costs2 |
|
|
570 |
|
|
|
589 |
|
|
|
614 |
|
|
|
588 |
|
| All-in sustaining costs2 |
|
|
771 |
|
|
|
834 |
|
|
|
866 |
|
|
|
844 |
|
| All-in costs2 |
|
|
815 |
|
|
|
975 |
|
|
|
932 |
|
|
|
951 |
|
| Cash costs (on a co-product basis)2 |
|
|
592 |
|
|
|
607 |
|
|
|
639 |
|
|
|
609 |
|
| All-in sustaining costs (on a co-product basis)2 |
|
|
793 |
|
|
|
852 |
|
|
|
891 |
|
|
|
865 |
|
| All-in costs (on a co-product basis)2 |
|
|
837 |
|
|
|
993 |
|
|
|
957 |
|
|
|
972 |
|
|
|
|
|
|
| Copper production (millions of pounds) |
|
|
140 |
|
|
|
131 |
|
|
|
373 |
|
|
|
302 |
|
| Copper sold (millions of pounds) |
|
|
145 |
|
|
|
112 |
|
|
|
378 |
|
|
|
296 |
|
|
|
|
|
|
| Per pound data |
|
|
|
|
|
|
|
|
|
|
|
|
|
|
|
|
| Average spot copper price |
|
$ |
2.39 |
|
|
$ |
3.17 |
|
|
$ |
2.58 |
|
|
$ |
3.15 |
|
| Average realized copper price2 |
|
|
2.18 |
|
|
|
3.09 |
|
|
|
2.44 |
|
|
|
3.08 |
|
| C1 cash costs2 |
|
|
1.53 |
|
|
|
1.82 |
|
|
|
1.75 |
|
|
|
1.98 |
|
| Depreciation3 |
|
|
0.13 |
|
|
|
0.44 |
|
|
|
0.21 |
|
|
|
0.40 |
|
| Other4 |
|
|
(0.17 |
) |
|
|
0.10 |
|
|
|
0.11 |
|
|
|
0.12 |
|
| C3 fully allocated costs2 |
|
|
1.49 |
|
|
|
2.36 |
|
|
|
2.07 |
|
|
|
2.50 |
|
| |
|
| Financial Results (millions) |
|
|
|
|
|
|
|
|
|
|
|
|
|
|
|
|
| Revenues |
|
$ |
2,315 |
|
|
$ |
2,624 |
|
|
$ |
6,791 |
|
|
$ |
7,729 |
|
| Net income (loss)5 |
|
|
(264 |
) |
|
|
125 |
|
|
|
(216 |
) |
|
|
(56) |
|
| Adjusted net earnings2 |
|
|
131 |
|
|
|
222 |
|
|
|
253 |
|
|
|
619 |
|
| Adjusted EBITDA2 |
|
|
942 |
|
|
|
1,059 |
|
|
|
2,465 |
|
|
|
3,056 |
|
| Operating cash flow6 |
|
|
1,255 |
|
|
|
852 |
|
|
|
2,096 |
|
|
|
1,925 |
|
| Free cash flow2, 6 |
|
|
866 |
|
|
|
199 |
|
|
|
694 |
|
|
|
40 |
|
| Per Share Data (dollars) |
|
|
|
|
|
|
|
|
|
|
|
|
|
|
|
|
| Net earnings (loss) (basic) |
|
|
(0.23 |
) |
|
|
0.11 |
|
|
|
(0.19 |
) |
|
|
(0.05) |
|
| Adjusted net earnings (basic)2 |
|
|
0.11 |
|
|
|
0.19 |
|
|
|
0.22 |
|
|
|
0.53 |
|
| Net earnings (loss) (diluted) |
|
|
(0.23 |
) |
|
|
0.11 |
|
|
|
(0.19 |
) |
|
|
(0.05) |
|
|
|
|
|
|
| Weighted average basic and diluted common shares (millions) |
|
|
1,165 |
|
|
|
1,165 |
|
|
|
1,165 |
|
|
|
1,165 |
|
| |
|
|
|
|
|
|
|
|
|
|
|
|
| |
|
| |
|
|
|
|
|
|
|
As at
September 30, |
|
|
As at
December 31, |
|
|
|
|
|
|
|
|
|
|
|
|
|
|
| |
|
|
|
|
|
|
|
2015 |
|
|
2014 |
|
| |
|
| Financial Position (millions) |
|
|
|
|
|
|
|
|
|
|
|
|
|
|
|
|
| Cash and equivalents |
|
|
|
|
|
|
|
|
|
$ |
3,317 |
|
|
$ |
2,699 |
|
| Working capital (excluding cash) |
|
|
|
|
|
|
|
|
|
|
1,523 |
|
|
|
1,937 |
|
| |
|
| |
1 |
Production includes Acacia on a 73.9% basis until February 28, 2014 and a 63.9% basis thereafter and Pueblo Viejo on a 60% basis, both of which reflect our equity share of production. Also includes production from
Plutonic up to January 31, 2014, Kanowna up to March 1, 2014, Marigold up to April 4, 2014, Cowal up to July 23, 2015 and Porgera on a 95% basis until August 31, 2015 and a 47.5% basis thereafter, the effective dates of sale
of these assets. Sales include our equity share of gold sales from Acacia and Pueblo Viejo. |
| |
2 |
Realized price, cash costs, all-in sustaining costs, all-in costs, cash costs (on a co-product basis), all-in sustaining costs (on a co-product basis), all-in costs (on a co-product basis), C1 cash costs, C3 fully
allocated costs, adjusted net earnings, adjusted EBITDA and free cash flow are non-GAAP financial performance measures with no standard definition under IFRS. Refer to the Non-GAAP |
| |
Financial |
Performance Measures section of the Company’s MD&A. |
| |
3 |
Represents equity depreciation expense divided by equity pounds of copper sold. |
| |
4 |
For a breakdown, see reconciliation of cost of sales to C1 cash costs and C3 fully allocated costs per pound in the Non-GAAP Financial Performance Measures section of the Company’s MD&A. |
| |
5 |
Net income (loss) represents net income (loss) attributable to the equity holders of the Company. |
| |
6 |
Includes a $610 million deposit received in third quarter 2015 related to the gold and silver streaming agreement. |
|
|
|
|
|
| BARRICK THIRD QUARTER 2015 |
|
12 |
|
SUMMARY INFORMATION |
Production and Cost Summary
|
|
|
|
|
|
|
|
|
|
|
|
|
|
|
|
|
|
|
|
|
|
|
|
|
|
|
|
|
|
|
|
|
| |
|
Gold Production (attributable ounces) (000’s) |
|
|
All-in sustaining costs5 ($/oz) |
|
| |
|
Three months ended
September 30, |
|
|
Nine months ended
September 30, |
|
|
Three months ended
September 30, |
|
|
Nine months ended
September
30, |
|
| |
|
2015 |
|
|
2014 |
|
|
2015 |
|
|
2014 |
|
|
2015 |
|
|
2014 |
|
|
2015 |
|
|
2014 |
|
| |
|
|
|
|
|
|
|
|
|
|
|
|
|
| Gold |
|
|
|
|
|
|
|
|
|
|
|
|
|
|
|
|
|
|
|
|
|
|
|
|
|
|
|
|
|
|
|
|
| Goldstrike |
|
|
328 |
|
|
|
239 |
|
|
|
741 |
|
|
|
715 |
|
|
$ |
558 |
|
|
$ |
923 |
|
|
$ |
698 |
|
|
$ |
849 |
|
| Cortez |
|
|
321 |
|
|
|
273 |
|
|
|
647 |
|
|
|
717 |
|
|
|
501 |
|
|
|
591 |
|
|
|
711 |
|
|
|
667 |
|
| Pueblo Viejo3 |
|
|
172 |
|
|
|
168 |
|
|
|
438 |
|
|
|
488 |
|
|
|
554 |
|
|
|
559 |
|
|
|
628 |
|
|
|
585 |
|
| Lagunas Norte |
|
|
108 |
|
|
|
157 |
|
|
|
441 |
|
|
|
406 |
|
|
|
581 |
|
|
|
554 |
|
|
|
510 |
|
|
|
552 |
|
| Veladero |
|
|
143 |
|
|
|
178 |
|
|
|
443 |
|
|
|
525 |
|
|
|
914 |
|
|
|
822 |
|
|
|
957 |
|
|
|
786 |
|
| Turquoise Ridge |
|
|
55 |
|
|
|
54 |
|
|
|
156 |
|
|
|
156 |
|
|
|
738 |
|
|
|
592 |
|
|
|
745 |
|
|
|
594 |
|
| Porgera4 |
|
|
134 |
|
|
|
138 |
|
|
|
370 |
|
|
|
368 |
|
|
|
986 |
|
|
|
974 |
|
|
|
1,060 |
|
|
|
1,002 |
|
| Kalgoorlie |
|
|
97 |
|
|
|
82 |
|
|
|
237 |
|
|
|
244 |
|
|
|
725 |
|
|
|
1,040 |
|
|
|
923 |
|
|
|
1,004 |
|
| Acacia2 |
|
|
104 |
|
|
|
122 |
|
|
|
339 |
|
|
|
354 |
|
|
|
1,195 |
|
|
|
1,098 |
|
|
|
1,153 |
|
|
|
1,111 |
|
| Other Mines - Gold1 |
|
|
201 |
|
|
|
238 |
|
|
|
686 |
|
|
|
749 |
|
|
|
1,060 |
|
|
|
1,021 |
|
|
|
958 |
|
|
|
1,012 |
|
| |
|
| Total |
|
|
1,663 |
|
|
|
1,649 |
|
|
|
4,498 |
|
|
|
4,722 |
|
|
$ |
771 |
|
|
$ |
834 |
|
|
$ |
866 |
|
|
$ |
844 |
|
| |
|
|
|
|
| |
|
Copper Production (attributable pounds) (millions) |
|
|
C1 Cash Costs5 ($/lb) |
|
| |
|
Three months ended
September 30, |
|
|
Nine months ended
September 30, |
|
|
Three months ended
September 30, |
|
|
Nine months ended
September 30, |
|
| |
|
2015 |
|
|
2014 |
|
|
2015 |
|
|
2014 |
|
|
2015 |
|
|
2014 |
|
|
2015 |
|
|
2014 |
|
| |
|
|
|
|
|
|
|
|
|
|
|
|
|
| Lumwana |
|
|
77 |
|
|
|
75 |
|
|
|
206 |
|
|
|
138 |
|
|
$ |
1.59 |
|
|
$ |
1.84 |
|
|
$ |
1.82 |
|
|
$ |
2.26 |
|
| Zaldívar |
|
|
63 |
|
|
|
56 |
|
|
|
167 |
|
|
|
164 |
|
|
|
1.47 |
|
|
|
1.82 |
|
|
|
1.67 |
|
|
|
1.78 |
|
| |
|
| Total |
|
|
140 |
|
|
|
131 |
|
|
|
373 |
|
|
|
302 |
|
|
$ |
1.53 |
|
|
$ |
1.82 |
|
|
$ |
1.75 |
|
|
$ |
1.98 |
|
| |
|
|
|
|
| |
|
|
|
|
Total Gold Production Costs ($/oz) |
|
| |
|
|
|
|
|
|
|
Three months ended
September 30, |
|
|
Nine months ended
September 30, |
|
| |
|
|
|
|
|
|
|
|
|
|
|
|
|
2015 |
|
|
2014 |
|
|
2015 |
|
|
2014 |
|
| |
|
|
|
|
|
| Direct mining costs before impact of hedges at market foreign exchange rates |
|
|
$ |
538 |
|
|
$ |
585 |
|
|
$ |
588 |
|
|
$ |
592 |
|
| Losses (gains) realized on currency hedge and commodity hedge/economic hedge contracts |
|
|
|
18 |
|
|
|
(17) |
|
|
|
17 |
|
|
|
(20) |
|
| By-product credits |
|
|
|
(22 |
) |
|
|
(18) |
|
|
|
(25 |
) |
|
|
(21) |
|
| Royalties |
|
|
|
36 |
|
|
|
39 |
|
|
|
34 |
|
|
|
37 |
|
| |
|
| Cash costs5 |
|
|
|
570 |
|
|
|
589 |
|
|
|
614 |
|
|
|
588 |
|
| Depreciation |
|
|
|
219 |
|
|
|
198 |
|
|
|
229 |
|
|
|
198 |
|
| |
|
| Total production costs |
|
|
$ |
789 |
|
|
$ |
787 |
|
|
$ |
843 |
|
|
$ |
786 |
|
| |
|
| Cash costs5 |
|
|
$ |
570 |
|
|
$ |
589 |
|
|
$ |
614 |
|
|
$ |
588 |
|
| General & administrative costs |
|
|
|
13 |
|
|
|
41 |
|
|
|
30 |
|
|
|
46 |
|
| Rehabilitation - accretion and amortization (operating sites) |
|
|
|
24 |
|
|
|
19 |
|
|
|
25 |
|
|
|
21 |
|
| Mine on-site exploration and evaluation costs |
|
|
|
6 |
|
|
|
4 |
|
|
|
7 |
|
|
|
3 |
|
| Mine development expenditures |
|
|
|
82 |
|
|
|
94 |
|
|
|
104 |
|
|
|
109 |
|
| Sustaining capital expenditures |
|
|
|
76 |
|
|
|
87 |
|
|
|
86 |
|
|
|
77 |
|
| |
|
| All-in sustaining costs5 |
|
|
$ |
771 |
|
|
$ |
834 |
|
|
$ |
866 |
|
|
$ |
844 |
|
| |
|
| All-in costs5 |
|
|
$ |
815 |
|
|
$ |
975 |
|
|
$ |
932 |
|
|
$ |
951 |
|
| |
|
|
|
|
| |
|
|
|
|
Total Copper Production Costs ($/lb) |
|
| |
|
|
|
|
|
|
|
Three months ended
September 30, |
|
|
Nine months ended
September 30, |
|
| |
|
|
|
|
|
|
|
|
|
|
|
|
|
2015 |
|
|
2014 |
|
|
2015 |
|
|
2014 |
|
| |
|
|
|
|
|
| C1 cash costs5 |
|
|
$ |
1.53 |
|
|
$ |
1.82 |
|
|
$ |
1.75 |
|
|
$ |
1.98 |
|
| Depreciation6 |
|
|
|
0.13 |
|
|
|
0.44 |
|
|
|
0.21 |
|
|
|
0.40 |
|
| Other7 |
|
|
|
(0.17 |
) |
|
|
0.10 |
|
|
|
0.11 |
|
|
|
0.12 |
|
| |
|
| C3 fully allocated costs5 |
|
|
$ |
1.49 |
|
|
$ |
2.36 |
|
|
$ |
2.07 |
|
|
$ |
2.50 |
|
| |
|
| |
1 |
Includes production from Plutonic up to January 31, 2014, Kanowna up to March 1, 2014, Marigold up to April 4, 2014 and Cowal up to July 23, 2015, the effective dates of sale of these assets.
|
| |
2 |
Figures relating to Acacia are presented on a 73.9% basis until February 28, 2014 and a 63.9% basis thereafter, which reflects our equity share of production. |
| |
3 |
Reflects production from Pueblo Viejo on a 60% basis, which reflects our equity share of production. |
| |
4 |
Reflects production on a 95% basis until August 31, 2015 and a 47.5% basis thereafter. |
| |
5 |
Cash costs, all-in sustaining costs, all-in costs, C1 cash costs and C3 fully allocated costs are non-GAAP financial performance measures with no standard meaning under IFRS. Refer to the Non-GAAP Financial Performance
Measures section of the Company’s MD&A. |
| |
6 |
Represents equity depreciation expense divided by equity pounds of copper sold. |
| |
7 |
For a breakdown, see reconciliation of cost of sales to C1 cash costs and C3 fully allocated costs per pound in the Non-GAAP Financial Performance Measures section of the Company’s MD&A. |
|
|
|
|
|
| BARRICK THIRD QUARTER 2015 |
|
13 |
|
SUMMARY INFORMATION |
MANAGEMENT’S DISCUSSION AND ANALYSIS (“MD&A”)
This portion of the Quarterly Report provides management’s discussion and analysis
(“MD&A”) of the financial condition and results of operations to enable a reader to assess material changes in financial condition and results of operations as at and for the three and nine month periods ended September 30, 2015,
in comparison to the corresponding prior–year periods. The MD&A is intended to help the reader understand Barrick Gold Corporation (“Barrick”, “we”, “our” or the “Company”), our operations, financial
performance and present and future business environment. This MD&A, which has been prepared as of October 28, 2015, is intended to supplement and complement the condensed unaudited interim consolidated financial statements and notes
thereto, prepared in accordance with International Accounting Standard 34 Interim Financial Reporting (“IAS 34”) as issued by the International Accounting Standards Board (“IASB”), for the three and nine month periods ended
September 30, 2015 (collectively, the “Financial Statements”), which are included in this Quarterly Report on pages 59 to 84. You are encouraged to review the Financial Statements in conjunction with your review of this MD&A. This
MD&A should be read
in conjunction with both the annual audited consolidated financial statements for the two years ended
December 31, 2014, the related annual MD&A included in the 2014 Annual Report, and the most recent Form 40–F/Annual Information Form on file with the US Securities and Exchange Commission (“SEC”) and Canadian provincial
securities regulatory authorities. Certain notes to the Financial Statements are specifically referred to in this MD&A and such notes are incorporated by reference herein. All dollar amounts in this MD&A are in millions of US dollars, unless
otherwise specified.
For the purposes of preparing our MD&A, we consider the materiality of information. Information is considered material if:
(i) such information results in, or would reasonably be expected to result in, a significant change in the market price or value of our shares; or (ii) there is a substantial likelihood that a reasonable investor would consider it
important in making an investment decision; or (iii) it would significantly alter the total mix of information available to investors. We evaluate materiality with reference to all relevant circumstances, including potential market sensitivity.
CAUTIONARY STATEMENT ON FORWARD-LOOKING INFORMATION
Certain information contained or incorporated by reference in this MD&A, including any information as
to our strategy, projects, plans or future financial or operating performance constitutes “forward-looking statements”. All statements, other than statements of historical fact, are forward-looking statements. The words
“believe”, “expect”, “anticipate”, “contemplate”, “target”, “plan”, “intend”, “project”, “continue”, “budget”, “estimate”,
“potential”, “may”, “will”, “can”, “could” and similar expressions identify forward-looking statements. In particular, this MD&A contains forward-looking statements with respect to cash flow
forecasts, projected capital, operating and exploration expenditures, targeted cash flow improvements and debt reductions, mine life and production rates, potential mineralization and metal or mineral recoveries. Forward-looking statements are
necessarily based upon a number of estimates and assumptions that, while considered reasonable by the Company in light of management’s experience and perception of current conditions and expected developments, are inherently subject to
significant business, economic and competitive uncertainties and contingencies. Known and unknown factors could
cause actual results to differ materially from those projected in the forward-looking statements. Such
factors include, but are not limited to: fluctuations in the spot and forward price of gold, copper or certain other commodities (such as silver, diesel fuel, natural gas and electricity); the speculative nature of mineral exploration and
development; changes in mineral production performance, exploitation and exploration successes; diminishing quantities or grades of reserves; increased costs, delays, suspensions and technical challenges associated with the construction of capital
projects; operating or technical difficulties in connection with mining or development activities, including disruptions in the maintenance or provision of required infrastructure and information technology systems; failure to comply with
environmental and health and safety laws and regulations; timing of receipt of, or failure to comply with, necessary permits and approvals; the impact of global liquidity and credit availability on the timing of cash flows and the values of assets
and liabilities based on projected future cash flows; adverse changes in our credit ratings; the impact of inflation; fluctuations in the currency markets; changes in U.S. dollar interest
|
|
|
|
|
| BARRICK THIRD QUARTER 2015 |
|
14 |
|
MANAGEMENT’S DISCUSSION AND ANALYSIS |
rates; risks arising from holding derivative instruments; changes in national and local government legislation, taxation, controls or regulations and/or changes in the administration of laws,
policies and practices, expropriation or nationalization of property and political or economic developments in Canada, the United States and other jurisdictions in which the Company does or may carry on business in the future; damage to the
Company’s reputation due to the actual or perceived occurrence of any number of events, including negative publicity with respect to the Company’s handling of environmental matters or dealings with community groups, whether true or not;
the possibility that future exploration results will not be consistent with the Company’s expectations; risks that exploration data may be incomplete and considerable additional work may be required to complete further evaluation, including but
not limited to drilling, engineering and socio-economic studies and investment; risk of loss due to acts of war, terrorism, sabotage and civil disturbances; litigation; contests over title to properties, particularly title to undeveloped properties,
or over access to water, power and other required infrastructure; business opportunities that may be presented to, or pursued by, the Company; our ability to successfully integrate acquisitions or complete divestitures; employee relations; increased
costs and risks related to the potential impact of climate change; availability and increased costs associated with mining inputs and labor; and the
organization of our previously held African gold operations and properties under a separate listed company.
In addition, there are risks and hazards associated with the business of mineral exploration, development and mining, including environmental hazards, industrial accidents, unusual or unexpected formations, pressures, cave-ins, flooding and gold
bullion, copper cathode or gold or copper concentrate losses (and the risk of inadequate insurance, or inability to obtain insurance, to cover these risks). Many of these uncertainties and contingencies can affect our actual results and could cause
actual results to differ materially from those expressed or implied in any forward-looking statements made by, or on behalf of, us.
Readers are
cautioned that forward-looking statements are not guarantees of future performance. All of the forward-looking statements made in this MD&A are qualified by these cautionary statements. Specific reference is made to the most recent
Form 40-F/Annual Information Form on file with the SEC and Canadian provincial securities regulatory authorities for a discussion of some of the factors underlying forward-looking statements. We disclaim any intention or obligation to update or
revise any forward-looking statements whether as a result of new information, future events or otherwise, except as required by applicable law.
|
|
|
|
|
| BARRICK THIRD QUARTER 2015 |
|
15 |
|
MANAGEMENT’S DISCUSSION AND ANALYSIS |
INDEX
|
|
|
|
|
| |
|
page |
|
|
|
| Results Overview |
|
|
|
|
|
|
| Review of 2015 Third Quarter Results and Full Year Outlook |
|
|
17 |
|
|
|
| Key Business Developments |
|
|
23 |
|
|
|
| Market Overview |
|
|
25 |
|
|
|
| Review of Financial Results |
|
|
|
|
|
|
| Revenue |
|
|
27 |
|
|
|
| Production Costs |
|
|
27 |
|
|
|
| Capital Expenditures |
|
|
28 |
|
|
|
| Additional Significant Statement of Income Items |
|
|
29 |
|
|
|
| Income Tax Expense |
|
|
30 |
|
|
|
| Operating Segments Performance |
|
|
30 |
|
|
|
| Financial Condition Review |
|
|
|
|
|
|
| Balance Sheet Review |
|
|
47 |
|
|
|
| Shareholders’ Equity |
|
|
47 |
|
|
|
| Comprehensive Income |
|
|
47 |
|
|
|
| Financial Position and Liquidity |
|
|
47 |
|
|
|
| Financial Instruments |
|
|
49 |
|
|
|
| Commitments and Contingencies |
|
|
49 |
|
|
|
| Internal Control over Financial Reporting and Disclosure Controls and Procedures |
|
|
50 |
|
|
|
| Review of Quarterly Results |
|
|
51 |
|
|
|
| IFRS Critical Accounting Policies and Accounting Estimates |
|
|
51 |
|
|
|
| Non-GAAP Financial Performance Measures |
|
|
52 |
|
|
|
|
|
|
| BARRICK THIRD QUARTER 2015 |
|
16 |
|
MANAGEMENT’S DISCUSSION AND ANALYSIS |
RESULTS
OVERVIEW
Review of 2015 Third Quarter Results and Full Year Outlook
|
|
|
|
|
|
|
|
|
|
|
|
|
|
|
|
|
| ($ millions, except where indicated) |
|
For the three months ended September 30 |
|
|
For the nine months ended September 30 |
|
| |
|
| |
|
2015 |
|
|
2014 |
|
|
2015 |
|
|
2014 |
|
| |
|
| Financial Data |
|
|
|
|
|
|
|
|
|
|
|
|
|
|
|
|
| Revenue |
|
|
$ 2,315 |
|
|
|
$ 2,624 |
|
|
|
$ 6,791 |
|
|
|
$ 7,729 |
|
| Net earnings (loss)1 |
|
|
(264) |
|
|
|
125 |
|
|
|
(216) |
|
|
|
(56) |
|
| Per share (“EPS”)2 |
|
|
(0.23) |
|
|
|
0.11 |
|
|
|
(0.19) |
|
|
|
(0.05) |
|
| Adjusted net earnings3 |
|
|
131 |
|
|
|
222 |
|
|
|
253 |
|
|
|
619 |
|
| Per share (“adjusted EPS”)2,3 |
|
|
0.11 |
|
|
|
0.19 |
|
|
|
0.22 |
|
|
|
0.53 |
|
| Adjusted EBITDA3 |
|
|
942 |
|
|
|
1,059 |
|
|
|
2,465 |
|
|
|
3,056 |
|
| Total project capital expenditures4 |
|
|
31 |
|
|
|
66 |
|
|
|
68 |
|
|
|
113 |
|
| Total capital expenditures - expansion4 |
|
|
11 |
|
|
|
128 |
|
|
|
130 |
|
|
|
301 |
|
| Total capital expenditures - sustaining4 |
|
|
342 |
|
|
|
410 |
|
|
|
1,056 |
|
|
|
1,201 |
|
| Operating cash flow5 |
|
|
1,255 |
|
|
|
852 |
|
|
|
2,096 |
|
|
|
1,925 |
|
| Free cash flow3 |
|
|
$ 866 |
|
|
|
$ 199 |
|
|
|
$ 694 |
|
|
|
$ 40 |
|
| |
|
|
|
|
|
|
|
|
|
|
|
|
|
|
|
|
|
|
| |
|
| Operating Data |
|
|
|
|
|
|
|
|
|
|
|
|
|
|
|
|
| Gold |
|
|
|
|
|
|
|
|
|
|
|
|
|
|
|
|
| Gold produced (000s ounces)6 |
|
|
1,663 |
|
|
|
1,649 |
|
|
|
4,498 |
|
|
|
4,722 |
|
| Gold sold (000s ounces)6 |
|
|
1,596 |
|
|
|
1,578 |
|
|
|
4,447 |
|
|
|
4,712 |
|
| Realized price ($ per ounce)3 |
|
|
$ 1,125 |
|
|
|
$ 1,285 |
|
|
|
$ 1,176 |
|
|
|
$ 1,286 |
|
| Cash costs ($ per ounce)3 |
|
|
570 |
|
|
|
589 |
|
|
|
614 |
|
|
|
588 |
|
| Cash costs on a co-product basis
($ per ounce)3 |
|
|
592 |
|
|
|
607 |
|
|
|
639 |
|
|
|
609 |
|
| All-in sustaining costs ($ per ounce)3 |
|
|
771 |
|
|
|
834 |
|
|
|
866 |
|
|
|
844 |
|
| All-in sustaining costs on a co-product basis ($ per ounce)3 |
|
|
793 |
|
|
|
852 |
|
|
|
891 |
|
|
|
865 |
|
| All-in costs ($ per ounce)3 |
|
|
815 |
|
|
|
975 |
|
|
|
932 |
|
|
|
951 |
|
| All-in costs on a co-product basis
($ per ounce)3 |
|
|
$ 837 |
|
|
|
$ 993 |
|
|
|
$ 957 |
|
|
|
$ 972 |
|
| Copper |
|
|
|
|
|
|
|
|
|
|
|
|
|
|
|
|
| Copper produced (millions of pounds) |
|
|
140 |
|
|
|
131 |
|
|
|
373 |
|
|
|
302 |
|
| Copper sold (millions of pounds) |
|
|
145 |
|
|
|
112 |
|
|
|
378 |
|
|
|
296 |
|
| Realized price ($ per pound)3 |
|
|
$ 2.18 |
|
|
|
$ 3.09 |
|
|
|
$ 2.44 |
|
|
|
$ 3.08 |
|
| C1 cash costs ($ per pound)3 |
|
|
$ 1.53 |
|
|
|
$ 1.82 |
|
|
|
$ 1.75 |
|
|
|
$ 1.98 |
|
| C3 cash costs ($ per pound)3 |
|
|
$ 1.49 |
|
|
|
$ 2.36 |
|
|
|
$ 2.07 |
|
|
|
$ 2.50 |
|
| |
|
| 1 |
Net earnings/loss represents net earnings/loss attributable to the equity holders of the Company. |
| 2 |
Calculated using weighted average number of shares outstanding under the basic method. |
| 3 |
These are non-GAAP financial performance measures with no standardized definition under IFRS. For further information and detailed reconciliations, please see pages 52 - 58 of this MD&A. |
| 4 |
These amounts are presented on a 100% accrued basis. Project and expansion capital expenditures are included in our calculation of all-in costs, but not included in our calculation of all-in sustaining costs.
|
| 5 |
Operating cash flow includes a $610 million deposit received in third quarter 2015 related to the gold and silver streaming transaction with Royal Gold. |
| 6 |
Gold production and sales include our pro rata share of Acacia and Pueblo Viejo at our equity share. |
|
|
|
|
|
| BARRICK THIRD QUARTER 2015 |
|
17 |
|
MANAGEMENT’S DISCUSSION AND ANALYSIS |
FINANCIAL AND OPERATING HIGHLIGHTS
Operating Cash Flow, Free Cash Flow, Net Earnings, Adjusted Net Earnings, and Adjusted EBITDA
| |
● |
|
Operating cash flow for the three and nine month period ended September 30, 2015 of $1,255 million and $2,096 million, respectively, was 47% and 9%
higher, respectively than the same prior year periods. |
| |
● |
|
The increase in operating cash flow for third quarter and the first nine months of 2015 reflects a $610 million deposit received in third quarter 2015
relating to the gold and silver streaming transaction described on page 23 of this MD&A combined with an increase in copper sales volume compared to the same prior year periods. This was partially offset by lower gold and copper realized prices
compared to the same prior year periods. |
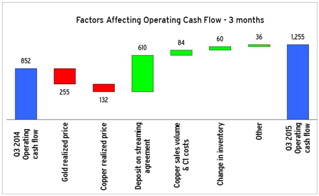
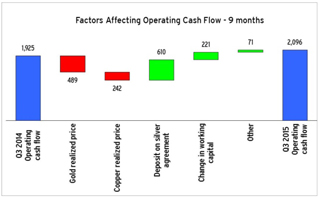
| |
● |
|
Free cash flow for the three and nine month periods ended September 30, 2015 was $866 million and $694 million, respectively, compared to $199 million
and $40 million, respectively, in the same prior year periods. |
| |
● |
|
The higher inflows in the three and the nine month periods ended September 30, 2015 reflect
|
| |
|
higher operating cash flows, including the $610 million deposit relating to the gold and silver streaming transaction combined with the impact of lower capital expenditures.
|
| |
● |
|
We have now generated positive free cash flow in two consecutive quarters despite lower gold prices, reflecting the impact of greater cost and capital
discipline across the company. |
| |
● |
|
Adjusted net earnings of $131 million for third quarter 2015 and $253 million for the nine month period ended September 30, 2015 were 41% and 59% lower,
respectively, compared to the same prior year periods. |
| |
● |
|
The decreases in adjusted net earnings are primarily due to a decrease in gold and copper realized prices, partially offset by a 29% and 28% increase in
copper sales volume in third quarter and the first nine months of 2015, respectively, compared to the same prior year periods. |
| |
● |
|
The loss for the three and nine month periods ended September 30, 2015 was $264 million and $216 million, respectively, compared to net earnings of $125
million and a net loss of $56 million, respectively, in the same prior year periods. |
| |
● |
|
The net loss in third quarter 2015 is primarily due to the impact of a $476 million goodwill impairment charge recorded in third quarter 2015 upon
reclassification of our Zaldívar mine as held-for-sale as the agreed selling price is lower than previously recognized carrying values, lower realized gold and copper prices and higher depreciation, partially offset by an increase in copper
and gold sales volume, despite the Cowal and Porgera divestitures in third quarter 2015, and a decrease in cost of sales applicable to copper when compared to the same prior year period. |
| |
● |
|
The increase in net loss for the nine month period ended September 30, 2015 is primarily due to a decrease in gold sales volume, lower realized gold and
copper prices and higher depreciation, partially offset by the recognition of $52 million in gains on the sale of our Cowal mine and 50% of our interest in the Porgera mine.
|
|
|
|
|
|
| BARRICK THIRD QUARTER 2015 |
|
18 |
|
MANAGEMENT’S DISCUSSION AND ANALYSIS |
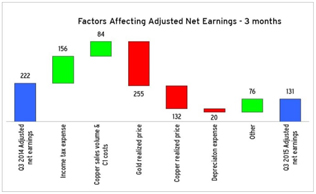
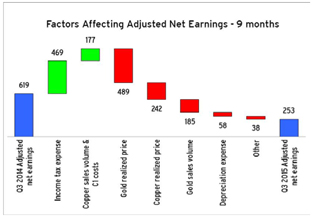
| |
● |
|
Significant adjusting items (net of tax and non-controlling interest effects) in third quarter 2015 include: |
| |
¡ |
|
$455 million in impairment charges primarily relating to the reclassification of our Zaldívar mine as held-for-sale as the agreed selling price is lower than previously recognized carrying value; and
|
| |
¡ |
|
$29 million in costs arising from changes in the obsolescence provision relating to mine supplies inventory; partially offset by |
| |
¡ |
|
$52 million of gains on the sale of our Cowal mine and 50% interest in our Porgera mine; and |
| |
¡ |
|
$45 million in unrealized foreign currency translation gains primarily related to the Zambian kwacha and the Australian dollar. |
| |
● |
|
Significant adjusting items (net of tax and non-controlling interests effects) for the first nine months of 2015 include: |
| |
¡ |
|
$479 million in impairment charges primarily related to the reclassification of our Zaldívar mine as held-for-sale as the agreed selling price is lower than previously recognized carrying values;
|
| |
¡ |
|
$29 million in costs arising from changes in the obsolescence provision relating to mine supplies inventory; and |
| |
¡ |
|
$17 million in costs relating to the closure of our Perth office; partially offset by |
| |
¡ |
|
$52 million of gains on the sale of our Cowal mine and 50% interest in our Porgera mine. |
| |
● |
|
Adjusted EBITDA was 11% and 19% lower for the three and nine month periods ended September 30, 2015, respectively, compared to the same prior year
periods. The decrease in third quarter 2015 was primarily due a decline in realized gold and copper prices, partially offset by an increase in gold sales volume, despite the Cowal and Porgera divestitures in third quarter 2015, combined with an
increase in copper sales volume. For the nine month period ended September 30, 2015, the decrease was primarily due to a decrease in gold sales volume combined with a decrease in gold and copper realized prices, partially offset by an increase
in copper sales volume. |
Gold production, cash costs and all-in sustaining costs
| |
● |
|
Gold production for the three and nine month periods ended September 30, 2015 was 1% higher and 5% lower, respectively, compared to the same prior year
periods. |
| |
● |
|
The increase in third quarter 2015 is largely due to an increase in production at Cortez and Goldstrike, partially offset by a decrease in production at
Lagunas Norte and Veladero. For the nine month period ended September 30, 2015, the decrease in gold production is primarily due to lower production at Cortez, Pueblo Viejo, and Veladero combined with the impact of the asset sales that occurred
in the first half of 2014, partially offset by an increase in production at Goldstrike. |
| |
● |
|
The higher production in third quarter 2015 was in line with our operating plan and consistent with our guidance that 55% of our production will come in the
second half of the year. Higher second half production is primarily due to higher production at Goldstrike as the thiosulfate circuit ramps up; higher production at Cortez as the open pit transitions into higher grade material; and higher production
at Pueblo Viejo due to the availability of higher grade ore and increased throughput due to higher autoclave availability. We now expect gold production for 2015 to be in
|
|
|
|
|
|
| BARRICK THIRD QUARTER 2015 |
|
19 |
|
MANAGEMENT’S DISCUSSION AND ANALYSIS |
| |
the range of 6.1 to 6.3 million ounces, compared to our previous guidance range of 6.1 to 6.4 million ounces, reflecting lower expected gold production from Acacia.
|
| |
● |
|
For the three and nine month periods ended September 30, 2015, cash costs decreased 3% and increased 4%, respectively, compared to the same prior year
periods. The decrease in third quarter 2015 was primarily due to lower direct mining costs and the impact of higher sales volume on unit costs, which was partially offset by realized losses on our foreign currency and fuel hedge contracts, movements
in inventory and the allocation of shared services costs to the operating sites in 2015. For the first nine months of 2015, the benefit of lower direct mining costs was offset by the impact of lower sales volume on unit costs, movements in inventory
and the allocation of shared services costs to the operating sites. |
| |
● |
|
All-in sustaining costs for the three and nine month periods ended September 30, 2015 decreased 8% and increased 3%, respectively, compared to the same
prior year periods. The lower all-in sustaining costs in third quarter 2015 were primarily due to the lower cash costs combined with a reduction in minesite sustaining capital expenditures. For the first nine months of 2015, the increase in all-in
sustaining costs was primarily due to the impact of lower production volume on unit production costs, partially offset by lower minesite sustaining capital expenditures, largely due to a reduction in capitalized stripping costs.
|
| |
● |
|
We now expect 2015 cash costs to be within a narrowed range of $600 to $625 per ounce compared to our previous guidance of range of $600 to $640 per ounce. We
now expect all-in sustaining costs to be $830 to $870 per ounce, which is lower than our previous guidance range of $840 to $880 per ounce. |
| |
● |
|
Fourth quarter all-in sustaining costs are now expected to be similar to the third quarter while production is expected to be slightly higher, primarily
driven by the impact of higher sustaining capital expenditures offset by higher production at Cortez, Pueblo Viejo, Lagunas Norte and Veladero. We expect significantly higher depreciation in the fourth quarter, primarily related to a drawdown in
inventory stockpiles at Cortez, Lagunas Norte and Goldstrike and higher sales volumes at Pueblo Viejo.
|
| |
● |
|
All-in costs for the three and nine month periods ended September 30, 2015 were 16% and 2% lower, respectively, than the same prior year periods. The
decreases were primarily due to a decrease in expansion capital expenditures, specifically a reduction in costs related to the construction of the thiosulfate circuit at Goldstrike, which entered commercial production in third quarter 2015.
|
Copper production and C1 costs
| |
● |
|
For the three and nine month periods ended September 30, 2015, copper production increased 7% and 24%, respectively, compared to the same prior year
periods, due to higher production at both Lumwana and Zaldívar. Production at Zaldívar was higher compared to the same prior year periods largely due to improved grades and recovery. The higher production at Lumwana for the first nine
months of 2015 was primarily a result of the partial conveyor collapse that shutdown the mill and concentrate production for much of second quarter 2014. |
| |
● |
|
C1 cash costs were 16% and 12% lower, respectively, than the same prior year periods due to the impact of higher sales volume on unit production costs.
|
Capital Expenditures
| |
● |
|
Capital expenditures for the three and nine month periods ended September 30, 2015 were 36% and 22% lower, respectively, compared to the same prior year
periods. The decreases are primarily due to a 91% and 60% reduction, respectively, in minesite expansion capital expenditures due to a reduction in costs related to the construction of the thiosulfate circuit at Goldstrike, which entered commercial
production in third quarter 2015, combined with a 17% and 12% reduction, respectively, in minesite sustaining capital expenditures due to lower capitalized stripping costs across most sites. As at September 30, 2015, we have incurred $1,254
million in capital expenditures. |
|
|
|
|
|
| BARRICK THIRD QUARTER 2015 |
|
20 |
|
MANAGEMENT’S DISCUSSION AND ANALYSIS |
Strengthening the Balance Sheet
| |
● |
|
Earlier this year, we set a debt reduction target of $3 billion in 2015. We said we would achieve this through the disciplined sale of non-core assets, the
formation of new joint ventures and partnerships, and by maximizing free cash flow from our operations. Thus far, we have completed or announced asset sales, joint ventures and partnerships valued at $2.46 billion. We have also generated $282
million in positive free cash flow in the last two quarters (excluding the $610 million in proceeds from the Pueblo Viejo streaming transaction) despite a lower gold price, reflecting the impact of our efforts to maximize free cash flow across the
company. Both asset sales and cash flow improvements have been credit positive, and have resulted in improvements to our debt-to-EBITDA ratio. Achieving our $3 billion debt reduction target will also reduce annual pre-tax interest payments by
approximately $140 million. |
| |
● |
|
After reflecting the debt repayments made in October 2015, total debt has been reduced by 15 percent over the same period, from $13.1 billion to $11.2
billion, significantly reducing our near-term debt repayment obligations. We currently have less than $250 million in debt due before 2018 and approximately $5 billion of our $11.2 billion in outstanding debt matures after 2032. Building on $1.9
billion in repayments already completed this year, we intend to use approximately $1 billion in proceeds from the sale of 50 percent of Zaldívar to reduce debt. The sale is expected to close in the fourth quarter. This would bring total debt
repayments to approximately $2.9 billion. We intend to use free cash flow to reach our target of $3 billion. Assuming the completion of $3 billion in repayments, total debt will have been reduced by 23 percent, from $13.1 billion to $10.1 billion.
|
| |
● |
|
We also expect to announce the outcome of a process for the sale of certain non-core U.S. assets in the fourth quarter. As we move into 2016 and beyond, we
will continue to take prudent steps to strengthen our balance sheet, balancing debt repayments with investments in profitable production that will drive growth in free cash flow and EBITDA.
|
| |
● |
|
Our liquidity position continues to improve, with strong cash flow generation, very modest near-term debt repayment obligations and a $4 billion undrawn
credit facility. Part of our September 30, 2015 cash balance of $3.3 billion was used to repay $1.1 billion in debt subsequent to quarter end in October 2015. |
Cost Reductions
| |
● |
|
This year, we have taken significant actions to improve our business plans, resulting in positive free cash flow for two consecutive quarters. We remain
focused on improving productivity and driving down costs to maximize free cash flow from our assets in any gold price environment. |
| |
● |
|
In support of this, we are targeting $2 billion in cash flow improvements across the company before the end of 2016, relative to our original internal plans
for 2015 and 2016. These improvements are coming from productivity gains and cost reductions across operating expenses, capital spending and corporate overhead. |
| |
● |
|
While a majority of these actions will be incorporated into our 2016 plans, the initial outcomes are reflected in improvements to our 2015 guidance. Total
capital expenditures for the year are expected to be 20 percent lower than 2014. Combined with reductions in corporate overhead and other operating cost savings, this has allowed us to reduce our 2015 all-in sustaining cost guidance by about $30 per
ounce since the start of year, from our original range of $860 to $895 per ounce to $830 to $870 per ounce in the third quarter. We are now focused on optimizing our 2016 plans, with an emphasis on operating cost and productivity improvements.
|
| |
● |
|
Our temporary suspension plan for Pascua-Lama has now been approved by the mining authority in Chile. This will enable us to complete the transition to care
and maintenance, and should allow us to significantly reduce holding costs at the project in 2016. Implementation of the temporary suspension plan could require adjustments resulting from regulatory and legal actions and weather conditions, which
could increase costs associated with the plan. |
|
|
|
|
|
| BARRICK THIRD QUARTER 2015 |
|
21 |
|
MANAGEMENT’S DISCUSSION AND ANALYSIS |
Full Year 2015 Outlook
|
|
|
|
|
| ($ millions, except per ounce/pound data) |
|
2015E |
|
| |
|
| Gold production and costs |
|
|
|
|
| Production (millions of ounces) 1 |
|
|
6.1 - 6.3 |
|
| Gold unit production costs |
|
|
|
|
| All-in sustaining costs ($ per ounce)2 |
|
|
830 - 870 |
|
| Cash costs ($ per ounce)3 |
|
|
600 - 625 |
|
| Depreciation ($ per ounce) |
|
|
240 - 260 |
|
| |
|
| Copper production and costs |
|
|
|
|
| Production (millions of pounds) |
|
|
480 - 520 |
|
| Copper unit production costs |
|
|
|
|
| C1 cash costs ($ per pound) 4 |
|
|
1.60 - 1.85 |
|
| Depreciation ($ per pound) 5 |
|
|
0.20 - 0.25 |
|
| C3 fully allocated costs ($ per pound)6 |
|
|
2.10 - 2.35 |
|
| |
|
| Exploration and project expenses |
|
|
330 - 420 |
|
| Exploration and evaluation |
|
|
180 - 230 |
|
| Project expenses |
|
|
150 - 190 |
|
| General and administrative expenses7 |
|
|
~200 |
|
| Corporate administration |
|
|
~145 |
|
| Stock-based compensation7 |
|
|
~25 |
|
| Acacia |
|
|
~30 |
|
| Other expense |
|
|
40 - 60 |
|
| Finance costs |
|
|
800 - 825 |
|
| Capital expenditures: |
|
|
|
|
| Minesite sustaining8 |
|
|
1,400 - 1,500 |
|
| Minesite expansion |
|
|
100 - 150 |
|
| Projects |
|
|
100 - 150 |
|
| Total capital expenditures8 |
|
|
~ 1,700 |
|
| |
|
| Effective income tax rate |
|
|
~53% |
|
| |
|
| Key Assumptions |
|
|
|
|
| Gold Price ($/ounce) |
|
|
$ 1,125 |
|
| Copper Price ($/pound) |
|
|
$ 2.35 |
|
| Oil Price ($/barrel) |
|
|
$60 |
|
| AUD Exchange Rate |
|
|
$ 0.80 |
|
| ARS Exchange Rate |
|
|
9.88 |
|
| CAD Exchange Rate |
|
|
$ 1.25 |
|
| CLP Exchange Rate |
|
|
610 |
|
| |
|
| 1 |
We now expect gold production to be in the range of 6.1 - 6.3 million ounces, compared to our previous guidance of
6.1 - 6.4 million ounces, primarily due to lower expected gold production from Acacia. |
| 2 |
We now expect all-in sustaining costs to be in the range of $830 to $870 per ounce, compared to our previous guidance range of $840 to $880 per ounce
reflecting a reduction in minesite sustaining capital expenditures. All-in sustaining costs are calculated in accordance with the standard published by the WGC. See pages 54 of this MD&A for further details. |
| 3 |
We now expect cash costs to be within a narrowed range of $600 to $625 per ounce, compared to our previous guidance range of $600 to $640 per ounce. Cash
costs reflect our equity share of unit production costs, including the impact of by-product credits, which is calculated in accordance with the standard published by the WGC. See pages 54 of this MD&A for further details. |
| 4 |
We now expect C1 cash costs to be in the range of $1.60 to $1.85 per pound, compared to our previous guidance range of $1.75 to $2.00 per pound, driven by
currency impacts and improved costs at Lumwana. |
| 5 |
We now expect depreciation per pound to be in the range of $0.20 - $0.25 per pound compared to our previous guidance range of $0.25 - $0.35 per pound to
reflect the cessation of depreciation of our Zaldívar assets as a result of classifying them as held-for-sale. |
| 6 |
We now expect C3 fully allocated costs to be in the range of $2.10 to $2.35 per pound compared to our previous guidance range of $2.35 to $2.65 per pound
reflecting the changes in C1 cash costs and depreciation per pound.
|
| 7 |
We now expect general and administrative costs to be approximately $200 million compared to our previous guidance of approximately $225 million reflecting a
reduction in stock based compensation guidance from approximately $50 million to approximately $25 million due to the impact of lower Barrick share prices on stock-based compensation. |
| 8 |
We now expect minesite sustaining capital expenditures to be in the range of $1,400 to $1,500 million compared to our previous guidance range of $1,400 to
$1,600 million. As a result of the expected reduction in minesite sustaining capital expenditures, we now expect total capital expenditures to be approximately $1,700 million compared to our previous range of $1,600 to $1,900 million.
|
|
|
|
|
|
| BARRICK THIRD QUARTER 2015 |
|
22 |
|
MANAGEMENT’S DISCUSSION AND ANALYSIS |
Key Business Developments
Divestitures
On July 30, 2015, we announced the sale of 50% of our Zaldívar copper mine in Chile to
Antofagasta Plc for total cash consideration of $1.005 billion. The transaction is expected to be completed in fourth quarter 2015 and is subject to customary closing conditions. As at September 30, 2015, all of the assets and liabilities of
Zaldívar were classified as held-for-sale as the transaction will result in a loss of control. As the agreed selling price is lower than previously recognized carrying values, we recorded a goodwill impairment of $476 million in third quarter
2015. The agreed selling price was lower than our previous assessment of fair value less costs to dispose due to lower short-term copper prices, the impact of 10 months’ worth of production on the fair value and an increase in observable
discount rates. We have determined that Zaldívar will be accounted for as a joint venture and upon closing we will use the equity method of accounting for it.
On August 31, 2015 we completed the sale of 50% of our interest in the Porgera mine in Papua New Guinea to Zijin Mining Group Company
(‘Zijin’) for cash consideration of $298 million. As a result of the transaction, we recorded a gain on sale of $24 million in third quarter 2015. We have determined that Porgera will be accounted for as a joint operation and have
recognized our share of the assets, liabilities, revenues and expenses of the Porgera mine.
On July 23, 2015, we completed the sale of our
Cowal mine in Australia for cash consideration of $550 million. As a result of the transaction, we recorded a gain on sale of $28 million in third quarter 2015.
Streaming transaction
On September 29, 2015 we closed a
gold and silver streaming transaction with Royal Gold, Inc. (“Royal Gold”) for production linked to Barrick’s 60 percent interest in the Pueblo Viejo mine. Royal Gold made an upfront cash payment of $610 million and will continue to
make cash payments for gold and silver delivered under the agreement. The $610 million upfront payment is not repayable and Barrick is obligated to deliver gold and silver based on Pueblo Viejo’s production. We have accounted for the upfront
payment as deferred revenue and will recognize it in earnings, along with the ongoing cash payments, as the gold and silver is delivered to Royal Gold. We will also be recording accretion expense on the deferred revenue balance as the time value of
the upfront deposit represents a significant component of the transaction.
Under the terms of the agreement, Barrick will sell gold and silver to Royal Gold equivalent to:
| ● |
|
7.5 percent of Barrick’s interest in the gold produced at Pueblo Viejo until 990,000 ounces of gold have been delivered, and 3.75 percent thereafter.
|
| ● |
|
75 percent of Barrick’s interest in the silver produced at Pueblo Viejo until 50 million ounces have been delivered, and 37.5 percent thereafter.
Silver will be delivered based on a fixed recovery rate of 70 percent. Silver above this recovery rate is not subject to the stream. |
Barrick will receive ongoing cash payments from Royal Gold equivalent to 30 percent of the prevailing spot prices for the first 550,000 ounces of gold
and 23.1 million ounces of silver delivered. Thereafter payments will double to 60 percent of prevailing spot prices for each subsequent ounce of gold and silver delivered. Ongoing cash payments to Barrick are tied to prevailing spot prices
rather than fixed in advance, maintaining exposure to higher gold and silver prices in the future.
Debt Management
A portion of the net proceeds from the sale of the Cowal mine were used to redeem the outstanding $229 million aggregate principal amount of 2.90% notes
due 2016 issued by Barrick. The notes were redeemed on September 9, 2015 in accordance with their terms.
In addition, on October 15, 2015,
the Company redeemed the outstanding $264 million aggregate principal amount of 5.75% notes due 2016 issued by a wholly-owned subsidiary.
Using
further proceeds from our divestitures and streaming transaction, on September 29, 2015, we commenced a cash tender offer of up to $750 million for specified series of outstanding notes. The maximum tender amount was subsequently increased to
$850 million. The tender offer settled on October 28, 2015.
Royalty Changes in Zambia
In July 2015, the Zambian government passed amendments to the country’s mining tax regime that replaced the recently adopted 20 percent gross royalty
on open pit mines with a nine percent royalty, along with the reintroduction of a 30 percent corporate income tax, a 50% of taxable income limitation on the utilization of tax loss carryforwards, and a 15 percent variable profits tax. In third
quarter 2015 we evaluated the potential for a
|
|
|
|
|
| BARRICK THIRD QUARTER 2015 |
|
23 |
|
MANAGEMENT’S DISCUSSION AND ANALYSIS |
reversal of previous impairments recorded in fourth quarter 2014 and based on the current mine plan, lower short-term copper prices and a higher observable discount rate offset the lower royalty
rate and therefore no impairment reversal is required at the current time.
Zambia Power Reductions
In second quarter 2015, the Zambian power authority (“ZESCO”) announced a reduction to power generation necessitated by the low water levels in
its reservoirs as a result of the poor rainfall experienced during the recent rainy season. We are continuing to work with ZESCO to manage a monthly power cap and are focused on power usage efficiencies and savings to minimize the impact on
production.
Jabal Sayid Financing Facility
On
April 2, 2015, Ma’aden Barrick Copper Company (our 50% Barrick owned equity method investment) signed a financing agreement with the Saudi British Bank to finance the Jabal Sayid copper project for SAR 750 million ($200 million USD).
The proceeds will be used to fund the expenditures remaining to bring the mine into commercial production.
Pascua-Lama Chilean Environmental Court Ruling
On March 23, 2015, Chile’s Environmental Court ruled that the Pascua-Lama project has not damaged glaciers in the project area. The
plaintiffs did not file an appeal and the matter is now closed.
Pascua-Lama SMA Regulatory Sanctions
On April 22, 2015, Chile’s environmental regulator (known as the SMA) reopened the administrative proceeding against Compañía
Minera Nevada (‘CMN’), Barrick’s Chilean subsidiary that holds the Chilean portion of the Pascua-Lama project (the ‘Project’) in accordance with the March 3, 2014 decision of the Environmental Court of Santiago, Chile.
CMN has filed a petition to limit the scope of this administrative proceeding to the original allegations before the environmental regulator at the time it issued its May 2013 resolution in this matter. A decision from the SMA is pending.
Also on April 22, 2015, CMN was notified that the SMA has initiated a new administrative proceeding for alleged deviations from certain requirements
of the Project’s environmental approval, including with respect to the Project’s environmental impact and a series of monitoring requirements. In May 2015, CMN submitted a compliance program to address certain of the allegations and
presented its defense to the remainder of the alleged deviations. The SMA rejected CMN’s proposed compliance program on June 24, 2015, and denied CMN’s administrative appeal of that decision on July 31, 2015. On
August 28, 2015, CMN appealed the SMA’s decision to the Environmental Court, which is expected to schedule a hearing in this matter. A decision from the SMA is pending on CMN’s
defense to the remainder of the alleged deviations. The new administrative proceeding against CMN is separate from the original administrative proceeding described above, and could result in additional sanctions including new administrative fines
and/or the revocation of the Project’s environmental permit. Refer to Note 23 to the Financial Statements for more information.
Hemlo Land Acquisition
In March 2015, Barrick acquired certain surface and mineral lands adjacent to the Hemlo property in Ontario from subsidiaries of Newmont Mining
Corporation for $37.5 million. The acquisition will enable Hemlo to realize additional value through near-term, lower-cost ounces, optimize its current operation, and increase exploration potential, which will allow for potential mine life
extensions.
Alturas Gold Discovery
In first quarter 2015,
we have made a new gold discovery located in the Andean region of Chile. The new discovery is the result of a methodical re-evaluation of the El Indio belt led by our exploration team. We will continue to seek to define the limits to the Alturas
mineralization in preference to infill drilling to report a resource. Consequently we do not expect to report an initial resource at year end as previously indicated.
Exploration Partnership with QPX
In first quarter 2015, we
formed a strategic partnership with Quantum Pacific Exploration (“QPX”) to explore for copper deposits on our land in northern Chile. Any gold deposits located on Barrick land will remain 100 percent Barrick-owned. If a copper deposit
project is identified on either Barrick or QPX land, it will be 50 percent owned by each company. This agreement seeks to maximize the value of our highly prospective land holdings where there is currently little to no exploration taking place.
Management Structure Refinements
In August 2015, Kelvin
Dushnisky, most recently Co-President, was appointed President. Richard Williams, previously Chief of Staff, was appointed Chief Operating Officer and will report to Mr. Dushnisky. Basie Maree, most recently Senior Vice President, Technical
Services was appointed Chief Technical Officer and will report to Mr. Williams. Jim Gowans, who has made significant contributions to the company as Co-President, will support this transition as a Senior Advisor to the Chairman until his
retirement from Barrick on December 31, 2015.
|
|
|
|
|
| BARRICK THIRD QUARTER 2015 |
|
24 |
|
MANAGEMENT’S DISCUSSION AND ANALYSIS |
Market Overview
Gold and Copper
The market prices of gold and, to a lesser
extent, copper are the primary drivers of our profitability and our ability to generate free cash flow for our shareholders.
The price of gold is
subject to volatile price movements over short periods of time and is impacted by numerous industry and macroeconomic factors. During third quarter, the price of gold ranged from $1,072 to $1,177 per ounce. The price of gold closed at $1,114 per
ounce on September 30, 2015, while the average quarterly market price of $1,124 per ounce represented a $158 per ounce or 12% decrease from the $1,282 per ounce average market price in the same prior year period.
Copper prices in third quarter traded in a range of $2.20 per pound to $2.64 per pound. The average price for third quarter was $2.39 per pound and the
closing price was $2.31 per pound on September 30, 2015. Copper prices should continue to be influenced by demand from emerging markets, specifically China, the availability of scrap and production levels of mines and smelters in the future.
We have provisionally priced copper sales for which final price determination versus the relevant copper index is outstanding at the balance sheet
date. As at September 30, 2015, we have recorded 62 million pounds of copper sales subject to final settlement at an average provisional price of $2.35 per pound. The impact to net income before taxation of a 10% movement in the market
price of copper would be approximately $15 million, holding all other variables constant.
Silver
Silver prices do not significantly impact our current operating earnings, cash flows or gold cash costs. Silver prices, however, will have a significant
impact on the overall economics for our Pascua-Lama project.
In third quarter, silver prices traded in a range of $13.98 per ounce to $15.88 per
ounce, averaged $14.91 per ounce and closed the quarter at $14.65 per ounce. The silver price is driven by factors similar to those influencing investment demands for gold.
Currency Exchange Rates
The results of our mining operations
outside of the United States are affected by US dollar exchange rates with non-US denominated currencies comprising approximately 25% of our operating and capital cost exposures. Although we have made dispositions, we continue to have exposure to
the Australian and Canadian dollars through a combination of mine operating and corporate
administration costs, as well as exposure to the Chilean peso through expected future capital and operating costs at our Pascua-Lama project and mine operating costs at Zaldívar. We also
have exposure to the Argentinean peso through operating costs at our Veladero mine, peso denominated VAT receivable balances and expected future capital and operating costs at our Pascua-Lama project. In addition, we have exposure to the Papua New
Guinea kina, Peruvian sol, Zambian kwacha, Tanzanian shilling and Dominican peso through mine operating and capital costs.
As a means of minimizing
the volatility on our operating costs from fluctuations in the US dollar, we have put in place protection through our currency hedging program on our three largest currency exposures, namely the Australian dollar, the Canadian dollar and the Chilean
peso. In third quarter 2015, the Australian dollar traded in a range of $0.69 to $0.77 against the US dollar, while the US dollar against the Canadian dollar and Chilean peso traded in ranges of $1.24 to $1.35 and CLP 634 to CLP 710, respectively.
In third quarter 2015, we recorded losses in earnings of approximately $15 million from our Australian, Canadian and Chilean peso hedges, primarily
impacting our operating and corporate administration costs (Q3 2014: $24 million gain).
|
|
|
|
|
|
|
|
|
|
|
|
|
|
|
|
|
|
|
|
|
| AUD Currency Contracts |
|
| |
|
| |
|
Contracts
(AUD
millions |
|
|
Effective
Average
Hedge Rate
(AUDUSD) |
|
|
% of Total
Expected
AUD
Exposure1
Hedged |
|
|
% of
Expected
Operating Cost
Exposure Hedged |
|
|
Crystallized
Gain/(Loss)
in OCI 2
(USD
millions) |
|
| |
|
| 2015 |
|
|
125 |
|
|
|
0.93 |
|
|
|
118% |
|
|
|
138% |
|
|
|
- |
|
| 2016 |
|
|
85 |
|
|
|
0.91 |
|
|
|
20% |
|
|
|
22% |
|
|
|
(14) |
|
| |
|
|
|
|
|
|
|
|
|
|
|
|
|
|
|
|
|
|
|
|
|
|
| CAD Currency Contracts |
|
| |
|
| |
|
|
|
|
|
|
|
% of |
|
|
% of |
|
|
|
|
| |
|
|
|
|
Effective |
|
|
Total |
|
|
Expected |
|
|
Crystallized |
|
| |
|
|
|
|
Average |
|
|
Expected |
|
|
Operating |
|
|
Gain/(Loss) |
|
| |
|
Contracts |
|
|
Hedge |
|
|
CAD |
|
|
Cost |
|
|
in OCI 2 |
|
| |
|
(CAD |
|
|
Rate |
|
|
Exposure1 |
|
|
Exposure |
|
|
(USD |
|
| |
|
millions)3 |
|
|
(USDCAD) |
|
|
Hedged |
|
|
Hedged |
|
|
millions) |
|
| |
|
| 2015 |
|
|
60 |
|
|
|
1.03 |
|
|
|
48% |
|
|
|
58% |
|
|
|
- |
|
| |
|
|
|
|
|
|
| BARRICK THIRD QUARTER 2015 |
|
25 |
|
MANAGEMENT’S DISCUSSION AND ANALYSIS |
|
|
|
|
|
|
|
|
|
|
|
|
|
|
|
|
|
|
|
|
|
| CLP Currency Contracts |
|
| |
|
| |
|
|
|
|
|
|
|
|
|
|
% of |
|
|
|
|
| |
|
|
|
|
|
|
|
% of Total |
|
|
Expected |
|
|
|
|
| |
|
|
|
|
Effective |
|
|
Expected |
|
|
Operating |
|
|
Crystallized |
|
| |
|
Contracts |
|
|
Average |
|
|
CLP |
|
|
Cost |
|
|
Gain/(Loss) |
|
| |
|
(CLP |
|
|
Hedge Rate |
|
|
Exposure1 |
|
|
Exposure |
|
|
in OCI 2 (USD |
|
| |
|
millions) 4 |
|
|
(USDCLP) |
|
|
Hedged |
|
|
Hedged |
|
|
millions) |
|
| |
|
| 2015 |
|
|
25,500 |
|
|
|
521 |
|
|
|
47% |
|
|
|
72% |
|
|
|
- |
|
| |
|
| 1 |
Includes all forecasted operating, administrative, sustainable and eligible project capital expenditures. |
| 2 |
To be reclassified from Other Comprehensive Income (“OCI”) to earnings when indicated. |
| 3 |
Includes C$60 million CAD collar contracts with an average range of $1.03 - $1.15. |
| 4 |
Includes CLP 25,500 million collar contracts with an average range of 521 - 601. |
Fuel
For third quarter, the price of West Texas Intermediate
(“WTI”) crude oil traded in a range of $38 to $59 per barrel, averaged $47 per barrel, compared to an average of $97 per barrel in the same prior year period, and ended the quarter at $45 per barrel.
In third quarter 2015, we recorded a hedge loss of $6 million on our fuel hedge positions (Q3 2014: $2 million gain).
|
|
|
|
|
|
|
|
|
|
|
|
|
|
|
|
|
| Financial Fuel Hedge Summary |
|
| |
|
| |
|
|
|
|
|
|
|
|
|
|
Impact of $10 |
|
| |
|
|
|
|
|
|
|
% of |
|
|
change on Pre- |
|
| |
|
Barrels |
|
|
Average |
|
|
Expected |
|
|
tax Earnings |
|
| |
|
(thousands) |
|
|
Price |
|
|
Exposure |
|
|
(USD millions)1 |
|
| |
|
| 2015 |
|
|
689 |
|
|
|
90 |
|
|
|
61% |
|
|
|
4 |
|
| 2016 |
|
|
2,933 |
|
|
|
85 |
|
|
|
67% |
|
|
|
14 |
|
| 2017 |
|
|
2,049 |
|
|
|
81 |
|
|
|
50% |
|
|
|
20 |
|
| 2018 |
|
|
1,080 |
|
|
|
79 |
|
|
|
29% |
|
|
|
27 |
|
| |
|
| 1 |
Includes the impact of hedges currently in place. |
US
Dollar Interest Rates
During third quarter 2015, the Federal Open Market Committee of the US Federal Reserve (“FOMC”) released a
statement noting that the current 0% to 0.25% target range for the federal funds rate remains appropriate. In determining how long to maintain the current range for the benchmark rate, the FOMC noted that it will use a wide range of information,
including measures of labor market conditions, indicators of inflation pressures and inflation expectations, and readings on financial and international developments, to assess progress towards its objectives of maximum employment and 2 percent
inflation.
At present, our interest rate exposure mainly relates to interest receipts on our cash balances ($3.3
billion at September 30, 2015); the mark-to-market value of derivative instruments; the fair value of and ongoing payments under US dollar interest-rate swaps; the carrying value of certain long lived assets and liabilities; and to the interest
payments on our variable-rate debt ($0.7 billion at September 30, 2015). Currently, the amount of interest expense recorded in our consolidated statement of income is not materially impacted by changes in interest rates, because the majority of
debt was issued at fixed interest rates. The relative amounts of variable-rate financial assets and liabilities may change in the future, depending on the amount of operating cash flow we generate, as well as the level of capital expenditures and
our ability to borrow on favorable terms using fixed rate debt instruments.
|
|
|
|
|
| BARRICK THIRD QUARTER 2015 |
|
26 |
|
MANAGEMENT’S DISCUSSION AND ANALYSIS |
REVIEW OF
FINANCIAL RESULTS
|
|
|
|
|
|
|
|
|
|
|
|
|
|
|
|
|
| Revenue |
|
|
|
|
|
|
|
|
|
|
|
|
|
|
|
($ millions, except
per ounce/pound |
|
For the three months |
|
|
For the nine months |
|
| data in dollars) |
|
ended September 30 |
|
|
ended September 30 |
|
| |
|
| |
|
2015 |
|
|
2014 |
|
|
2015 |
|
|
2014 |
|
| |
|
| Gold |
|
|
|
|
|
|
|
|
|
|
|
|
|
|
|
|
| 000s oz sold1 |
|
|
1,596 |
|
|
|
1,578 |
|
|
|
4,447 |
|
|
|
4,712 |
|
| Revenue |
|
|
$ 1,992 |
|
|
|
$ 2,235 |
|
|
|
$ 5,832 |
|
|
|
$ 6,664 |
|
| Market price2 |
|
|
1,124 |
|
|
|
1,282 |
|
|
|
1,178 |
|
|
|
1,288 |
|
| Realized price2,3 |
|
|
$ 1,125 |
|
|
|
$ 1,285 |
|
|
|
$ 1,176 |
|
|
|
$ 1,286 |
|
| Copper |
|
|
|
|
|
|
|
|
|
|
|
|
|
|
|
|
| millions lbs sold1 |
|
|
145 |
|
|
|
112 |
|
|
|
378 |
|
|
|
296 |
|
| Revenue |
|
|
$ 269 |
|
|
|
$ 318 |
|
|
|
$ 793 |
|
|
|
$ 860 |
|
| Market price2 |
|
|
2.39 |
|
|
|
3.17 |
|
|
|
2.58 |
|
|
|
3.15 |
|
| Realized price2,3 |
|
|
2.18 |
|
|
|
3.09 |
|
|
|
2.44 |
|
|
|
3.08 |
|
| Other sales |
|
|
$ 54 |
|
|
|
$ 71 |
|
|
|
$ 166 |
|
|
|
$ 205 |
|
| |
|
| |
1 |
Includes our equity share of gold ounces from Acacia and Pueblo Viejo. |
| |
2 |
Per ounce/pound weighted average. |
| |
3 |
Realized price is a non-GAAP financial performance measure with no standard meaning under IFRS. For further information and a detailed reconciliation, please
see page 58 of this MD&A. |
For the three and nine month periods ended September 30, 2015, gold revenues were down 11% and
12%, respectively, compared to the same prior year periods. The decrease in third quarter 2015 was primarily due to a lower realized gold price compared to the same prior year period, partially offset by an increase in gold sales volume. For the
nine month period ended September 30, 2015, the decrease was primarily due to a lower realized price combined with a 6% decrease in gold sales volume. Copper revenues for the three and nine month periods ended September 30, 2015 were down
15% and 8%, respectively, compared to the same prior year periods. The decreases were primarily due to the lower realized copper prices and negative provisional pricing adjustments, partially offset by the impact of higher copper sales volumes
compared to the same prior year periods.
Realized gold prices for the three and nine month periods ended September 30, 2015 were down $160 and
$110 per ounce, respectively, compared to the same prior year periods. The decrease in realized gold prices reflects the lower market gold prices in the third quarter and first nine months of 2015, down 12% and 9%, respectively, compared to the same
prior year periods. For the three and nine month periods ended September 30, 2015, realized copper prices were down $0.91 and $0.64 per pound, respectively, compared to the same prior year periods, due to the 25% and 18% decline in market
copper prices, respectively, over the same prior year
periods and $23 million in negative provisional pricing adjustments recognized in third quarter 2015.
Gold production for the three and nine month periods ended September 30, 2015 was 1% higher and 5% lower, respectively, compared to the same prior
year periods. The increase in third quarter 2015 is largely due to an increase in production at Cortez and Goldstrike, partially offset by a decrease in production at Lagunas Norte and Veladero. For the nine month period ended September 30,
2015, the decrease in gold production is primarily due to lower production at Cortez, Pueblo Viejo, and Veladero combined with the impact of the asset sales that occurred in the first half of 2014, partially offset by an increase in production at
Goldstrike.
For the three and nine month periods ended September 30, 2015, copper production increased by 7% and 24%, respectively, compared to
the same prior year periods due to higher production at both Lumwana and Zaldívar. The increase in production at Zaldívar was largely due to improved grades and recovery, while the increased production at Lumwana is attributable to
improved wet weather preparation in the mine and increased operating efficiency combined with the impact of the partial conveyor collapse that shutdown the mill and concentrate production for much of second quarter 2014.
|
|
|
|
|
|
|
|
|
|
|
|
|
|
|
|
|
| Production Costs |
|
|
|
|
|
|
|
|
|
|
|
|
|
|
|
($ millions, except per
ounce/pound data
in dollars) |
|
For the three
months ended
September 30 |
|
|
For the nine
months ended
September 30 |
|
| |
|
| |
|
2015 |
|
|
2014 |
|
|
2015 |
|
|
2014 |
|
| |
|
| Cost of sales |
|
|
|
|
|
|
|
|
|
|
|
|
|
|
|
|
| Direct mining costs |
|
|
$ 1,209 |
|
|
|
$ 1,172 |
|
|
|
$ 3,559 |
|
|
|
$ 3,539 |
|
| Depreciation |
|
|
432 |
|
|
|
412 |
|
|
|
1,272 |
|
|
|
1214 |
|
| Royalty expense |
|
|
80 |
|
|
|
78 |
|
|
|
259 |
|
|
|
226 |
|
| Community relations |
|
|
21 |
|
|
|
19 |
|
|
|
49 |
|
|
|
52 |
|
| Cost of sales - gold1 |
|
|
1,489 |
|
|
|
1,435 |
|
|
|
4,323 |
|
|
|
4,286 |
|
| Cash costs2,3 |
|
|
570 |
|
|
|
589 |
|
|
|
614 |
|
|
|
588 |
|
|
|
|
|
|
| All-in sustaining costs - gold2,3 |
|
|
771 |
|
|
|
834 |
|
|
|
866 |
|
|
|
844 |
|
| Cost of sales - copper1 |
|
|
210 |
|
|
|
231 |
|
|
|
698 |
|
|
|
682 |
|
| C1 cash costs2,3 |
|
|
1.53 |
|
|
|
1.82 |
|
|
|
1.75 |
|
|
|
1.98 |
|
| C3 fully allocated costs2,3 |
|
|
$ 1.49 |
|
|
|
$ 2.36 |
|
|
|
$ 2.07 |
|
|
|
$ 2.50 |
|
| |
|
| |
1 |
2014 figures restated to include community relations costs. |
| |
2 |
Per ounce/pound weighted average. |
| |
3 |
Cash costs, all-in sustaining costs, C1 cash costs and C3 fully allocated costs are non-GAAP financial performance measures with no standard meaning under
IFRS. For further information and a detailed reconciliation, please see pages 54 - 57 of this MD&A. |
|
|
|
|
|
| BARRICK THIRD QUARTER 2015 |
|
27 |
|
MANAGEMENT’S DISCUSSION AND ANALYSIS |
For the three and nine month periods ended September 30, 2015, cost of sales applicable to gold was 4%
higher and in line with the same prior year periods. The increase in third quarter 2015 is primarily attributable to higher direct mining costs resulting from increased sales volumes combined with an increase in depreciation expense.
Gold cash costs for the three and nine month periods ended September 30, 2015 were down $19 and up $26 per ounce, respectively, compared to the same
prior year periods. The decrease in third quarter 2015 was primarily due to lower direct mining costs and the impact of higher sales volume on unit costs, which was partially offset by realized losses on our foreign currency and fuel hedge
contracts, movements in inventory and the allocation of shared services costs to the operating sites in 2015. For the first nine months of 2015, the benefit of lower direct mining costs was offset by the impact of lower sales volume on unit costs,
movements in inventory and the allocation of shared services costs to the operating sites. All-in sustaining costs for the three and nine month periods ended September 30, 2015 were down $63 and up $22 per ounce, respectively, compared to the
same prior year periods. For third quarter 2015, the decrease was largely due to the impact of the lower cash costs per ounce combined with lower minesite sustaining capital expenditures, whereas for the nine month period, the increase was primarily
due to the effect of the higher cash costs per ounce.
For the three and nine month periods ended September 30, 2015, cost of sales applicable
to copper decreased $21 million and increased $16 million, respectively, compared to the same prior year periods. The decrease in third quarter 2015 was primarily due to lower depreciation expense as a result of the impairment charge recorded in
fourth quarter 2014 combined with the impact of ceasing depreciation of the Zaldívar assets during the quarter as a result of reclassifying the mine’s assets as held-for-sale. The increase for the nine month period ended
September 30, 2015 was primarily due to significantly higher royalty expense at Lumwana resulting from the increase in the royalty rate from 6% to 20% in first quarter 2015, which was subsequently lowered to 9% beginning in third quarter 2015.
This was partially offset by lower depreciation expense as a result of the impairment charge recorded in fourth quarter 2014.
C1 cash costs per pound for the three and nine month periods ended September 30, 2015 were 16% and 12%
lower, respectively, than the same prior year periods reflecting the impact of higher sales volume on unit production costs. C3 fully allocated costs were 37% and 17% lower, respectively, than the same prior year periods, primarily reflecting the
effect of the above factors on C1 cash costs combined with lower depreciation.
|
|
|
|
|
|
|
|
|
|
|
|
|
|
|
|
|
| Capital Expenditures1 |
|
|
|
|
| |
|
For the three months |
|
|
For the nine months |
|
| ($ millions) |
|
ended September 30 |
|
|
ended September 30 |
|
| |
|
| |
|
2015 |
|
|
2014 |
|
|
2015 |
|
|
2014 |
|
| |
|
| Project capital expenditures2 |
|
|
$ 31 |
|
|
|
$66 |
|
|
|
$ 68 |
|
|
|
$113 |
|
|
|
|
|
|
| Minesite sustaining |
|
|
156 |
|
|
|
180 |
|
|
|
461 |
|
|
|
488 |
|
|
|
|
|
|
| Mine development |
|
|
186 |
|
|
|
230 |
|
|
|
595 |
|
|
|
712 |
|
|
|
|
|
|
| Minesite expansion2 |
|
|
11 |
|
|
|
120 |
|
|
|
113 |
|
|
|
280 |
|
|
|
|
|
|
| Capitalized interest |
|
|
- |
|
|
|
8 |
|
|
|
17 |
|
|
|
22 |
|
| |
|
|
|
|
|
|
| Total consolidated capital expenditures |
|
|
$ 384 |
|
|
|
$ 604 |
|
|
|
$ 1,254 |
|
|
|
$ 1,615 |
|
| |
|
| |
1 |
These amounts are presented on a 100% accrued basis. |
| |
2 |
Project and expansion capital expenditures are included in our calculation of all-in costs, but not included in our calculation of all-in sustaining costs.
|
For the three and nine month periods ended September 30, 2015, capital expenditures decreased 36% and 22%, respectively,
compared to the same prior year periods. The decreases are primarily due to a decrease in minesite sustaining and development capital expenditures combined with lower minesite expansion capital expenditures. The decreases in minesite sustaining
capital expenditures are primarily due to the deferral of non-critical capital spending across sites, partially offset by an increase in costs at Veladero relating to the phase 4B and 5A leach pad expansions. The 19% and 16% reduction in minesite
development capital expenditures for the three and nine month periods ended September 30, 2015 is due to lower capitalized stripping costs, primarily at Goldstrike, partially offset by an increase in those costs at Veladero and at Porgera.
Minesite expansion capital expenditures decreased 91% and 60%, respectively, over the same prior year periods as a result of a decrease in expenditures at Goldstrike, due to the completion of the thiosulfate circuit, which entered commercial
production in third quarter 2015. In third quarter 2015, capitalized interest was nil due to the cessation of interest capitalization relating to the thiosulfate circuit upon entering commercial production.
|
|
|
|
|
| BARRICK THIRD QUARTER 2015 |
|
28 |
|
MANAGEMENT’S DISCUSSION AND ANALYSIS |
Additional Significant Statement of Income Items
|
|
|
|
|
|
|
|
|
|
|
|
|
|
|
|
|
|
|
|
| |
|
For the three |
|
|
For the nine |
|
| |
|
months ended |
|
|
months ended |
|
| ($ millions) |
|
September 30 |
|
|
September 30 |
|
| |
|
| |
|
2015 |
|
|
2014 |
|
|
2015 |
|
|
2014 |
|
| |
|
|
|
|
|
|
| General & administrative expenses |
|
|
$ 44 |
|
|
|
$ 98 |
|
|
|
$ 181 |
|
|
|
$ 283 |
|
|
|
|
|
|
| Corporate administration1 |
|
|
$ 43 |
|
|
|
$ 57 |
|
|
|
$ 143 |
|
|
|
$ 152 |
|
|
|
|
|
|
| Operating segment
administration2 |
|
|
$ - |
|
|
|
$ 30 |
|
|
|
$ - |
|
|
|
$ 94 |
|
|
|
|
|
|
| Stock-based compensation |
|
|
($ 5) |
|
|
|
- |
|
|
|
$ 5 |
|
|
|
$ 6 |
|
|
|
|
|
|
| Acacia |
|
|
$ 6 |
|
|
|
$ 11 |
|
|
|
$ 33 |
|
|
|
$ 31 |
|
|
|
|
|
|
| Other expense/(income) |
|
|
($ 45) |
|
|
|
($ 13) |
|
|
|
($ 31) |
|
|
|
$ 23 |
|
|
|
|
|
|
| Exploration, evaluation & project costs |
|
|
$ 86 |
|
|
|
$ 102 |
|
|
|
$ 269 |
|
|
|
$ 307 |
|
|
|
|
|
|
| Finance costs |
|
|
$ 207 |
|
|
|
$ 198 |
|
|
|
$ 597 |
|
|
|
$ 599 |
|
|
|
|
|
|
| Finance income |
|
|
$ 2 |
|
|
|
$ 3 |
|
|
|
$ 6 |
|
|
|
$ 9 |
|
|
|
|
|
|
| Impairments |
|
|
$ 452 |
|
|
|
$ 18 |
|
|
|
$ 492 |
|
|
|
$ 542 |
|
| |
|
| |
1 |
For the three and nine month period ended September 30, 2015, corporate administration costs include approximately $12 million and $28 million,
respectively, of non-recurring severance costs. |
| |
2 |
In 2015, operating segment administration costs have been allocated to our operating sites and are now included in cost of sales. |
General and Administrative Expenses
For
the three and nine month periods ended September 30, 2015, general and administrative expenses were $54 million and $102 million lower, respectively, than the same prior year periods. The decreases were primarily due to a change in the
methodology used to allocate shared service costs, resulting in an increase in the allocation of shared services costs from general and administrative expenses to cost of sales combined with a decrease in corporate administration costs. For further
information regarding the allocation of shared services costs, please refer to page 30 of this MD&A.
For the nine month period ended
September 30, 2015, we have realized approximately $35 million in reductions in general and administrative and overhead costs compared to the prior year period which resulted in lower corporate administration expense and fewer shared service
center costs being allocated to mine site cost of sales, partially offset by an increase in severance and other one-time costs related to our headcount reductions at our Perth, Salt Lake City and Toronto offices.
Based on the savings achieved to date, we continue to remain on track to achieve our targeted reduction of $50 million which will be realized through a
combination of general and administrative expense and cost of sales in 2015, exceeding our original target of $30 million for the year.
Other Expense (Income)
Other income for the three and nine month periods ended September 30, 2015 increased by $32 million and $54 million, respectively, compared to the
same prior year periods. The increases are primarily due to the realization of gains on the sale of our Cowal mine and 50% of our interest in the Porgera mine, which closed in third quarter 2015. These gains were partially offset by $31 million in
office closure costs primarily related to the exiting of leases at our Toronto and Salt Lake City offices. For a further breakdown of other expense (income), refer to note 10 to the Financial Statements.
Exploration, Evaluation and Project Costs
Exploration, evaluation and project costs for the three and nine month period ended September 30, 2015 decreased $16 and $38 million, respectively,
compared to the same prior year periods. The decrease in third quarter 2015 is primarily due to a $15 million decrease in global exploration costs combined with a $7 million decrease in project costs at Jabal Sayid. For the nine month period ended
September 30, 2015, the decrease was primarily due to a $24 million reduction in project costs at Jabal Sayid combined with a $12 million decrease in project costs at Pascua-Lama as we continue to drive down the cost of ongoing care and
maintenance activities. This was partially offset by an $18 million increase in corporate development costs. For a further breakdown of exploration, evaluation and project costs, refer to note 8 to the Financial Statements.
Finance Costs
For the three and nine
month periods ended September 30, 2015, finance costs were $9 million higher and in line, respectively, compared to the same prior year periods. The increase in third quarter 2015 was primarily due to a decrease in capitalized interest due to
the cessation of interest capitalization upon completion of the thiosulfate circuit at Goldstrike. Interest costs incurred were in line with the same prior year period. For a further breakdown of finance costs/income, refer to note 11 to the
Financial Statements.
|
|
|
|
|
| BARRICK THIRD QUARTER 2015 |
|
29 |
|
MANAGEMENT’S DISCUSSION AND ANALYSIS |
Impairment Charges
For the three and nine month periods ended September 30, 2015, impairment charges of $452 million and $492 million were incurred, respectively,
compared to $18 million and $542 million, respectively, in the same prior year periods. Impairment charges in third quarter and the first nine months of 2015 primarily reflect a $476 million goodwill impairment charge recorded for Zaldívar
upon reclassification of the mine’s net assets as held-for-sale as the agreed selling price is lower than previously recognized carrying values. The agreed selling price was lower than our previous assessment of fair value less costs to dispose
due to lower short-term copper prices, the impact of 10 months’ worth of production on the fair value and an increase in observable discount rates. The agreed selling price was lower than our previous assessment of fair value less costs to
dispose due to lower short-term copper prices, the impact of 10 months’ worth of production on the fair value and an increase in observable discount rates. Impairment charges in the same prior year periods primarily relate to the
reclassification of the Jabal Sayid project as held-for-sale in second quarter 2014. For a further breakdown of impairment charges, refer to note 18 to the Financial Statements.
Income Tax Expense
Income tax expense was $122
million in third quarter 2015. The tax rate for income in third quarter 2015 was 94% of the loss before income taxes. After adjusting for the impact of de-recognition of a deferred tax asset, the impact of net currency translation losses on deferred
tax balances, the impact of impairments, asset sales and non-hedge derivatives, and the impact of non-deductible foreign exchange losses, the underlying effective tax rate for ordinary income in the third quarter 2015 was 53%.
We record deferred tax charges or credits if changes in facts or circumstances affect the estimated tax basis of assets and therefore the amount of
deferred tax assets or liabilities to reflect changing expectations in our ability to realize deferred tax assets. The interpretation of tax regulations and legislation and their application to our business is complex and subject to change. We have
significant amounts of deferred tax assets, including tax loss carry forwards, and also deferred tax liabilities. Potential changes of any of these amounts, as well as our ability to realize deferred tax assets, could significantly affect net income
or cash flow in future periods.
Operating Segments Performance
Review of Operating Segments Performance
Barrick’s business is organized into fifteen individual mine sites, one publicly traded company and one project. Barrick’s Chief Operating
Decision Maker (“CODM”), the President, reviews the operating results, assesses performance and makes capital allocation decisions at the mine site, Company and/or project level. Therefore, each individual mine site and Acacia are
operating segments for financial reporting purposes. For segment reporting purposes, we present our reportable operating segments as follows: eight individual gold mines, two individual copper mines, Acacia and our Pascua-Lama project. The remaining
operating segments have been grouped into an “other” category consisting of our remaining gold mines. The prior periods have been restated to reflect the change in presentation.
Segment performance is evaluated based on a number of measures including operating income before tax, production levels and unit production costs.
Certain costs are managed on a consolidated basis and are therefore not reflected in segment income. Starting January 1, 2015, we updated the allocation of our general and administration costs to individual mine sites to reflect the removal of
all regional oversight and the transfer of most functional services to mine sites and to hold the mine sites directly accountable for the cost of the functional services they require to run their business.
|
|
|
|
|
| BARRICK THIRD QUARTER 2015 |
|
30 |
|
MANAGEMENT’S DISCUSSION AND ANALYSIS |
|
|
|
|
|
|
|
|
|
|
|
|
|
|
|
|
|
|
|
|
|
| Summary of Operations |
|
| For the three months ended September 30 |
| |
| |
|
2015 |
|
|
|
|
|
20141 |
| |
| |
|
Gold |
|
|
|
Cash |
|
All-In |
|
|
|
|
|
Gold |
|
|
|
Cash |
|
All-In |
| |
|
Produced |
|
Gold Sold |
|
Costs |
|
sustaining |
|
|
|
|
|
Produced |
|
Gold Sold |
|
Costs |
|
sustaining |
| |
|
(ozs) |
|
(ozs) |
|
($/oz) |
|
Costs ($/oz) |
|
|
|
|
|
(ozs) |
|
(ozs) |
|
($/oz) |
|
Costs ($/oz) |
| |
|
|
|
|
|
|
|
|
|
|
|
| Cortez |
|
321 |
|
282 |
|
$394 |
|
$501 |
|
|
|
|
|
273 |
|
252 |
|
$480 |
|
$591 |
|
|
|
|
|
|
|
|
|
|
|
| Goldstrike |
|
328 |
|
291 |
|
490 |
|
558 |
|
|
|
|
|
239 |
|
230 |
|
571 |
|
923 |
|
|
|
|
|
|
|
|
|
|
|
| Pueblo Viejo (60%) |
|
172 |
|
171 |
|
438 |
|
554 |
|
|
|
|
|
168 |
|
173 |
|
442 |
|
559 |
|
|
|
|
|
|
|
|
|
|
|
| Lagunas Norte |
|
108 |
|
120 |
|
344 |
|
581 |
|
|
|
|
|
157 |
|
147 |
|
412 |
|
554 |
|
|
|
|
|
|
|
|
|
|
|
| Veladero |
|
143 |
|
152 |
|
570 |
|
914 |
|
|
|
|
|
178 |
|
166 |
|
576 |
|
822 |
| |
|
|
|
|
|
|
|
|
|
|
|
| Total Core Mines |
|
1,072 |
|
1,016 |
|
$ 449 |
|
$ 597 |
|
|
|
|
|
1,015 |
|
968 |
|
$501 |
|
$698 |
| |
|
|
|
|
|
|
|
|
|
|
|
| Turquoise Ridge (75%) |
|
55 |
|
53 |
|
$602 |
|
$738 |
|
|
|
|
|
54 |
|
49 |
|
$448 |
|
$592 |
|
|
|
|
|
|
|
|
|
|
|
| Porgera (47.5%)2 |
|
134 |
|
126 |
|
741 |
|
986 |
|
|
|
|
|
138 |
|
135 |
|
883 |
|
974 |
|
|
|
|
|
|
|
|
|
|
|
| Kalgoorlie (50%) |
|
97 |
|
90 |
|
660 |
|
725 |
|
|
|
|
|
82 |
|
81 |
|
852 |
|
1,040 |
|
|
|
|
|
|
|
|
|
|
|
| Acacia (63.9%)3 |
|
104 |
|
107 |
|
807 |
|
1,195 |
|
|
|
|
|
122 |
|
114 |
|
679 |
|
1,098 |
|
|
|
|
|
|
|
|
|
|
|
| Hemlo |
|
55 |
|
54 |
|
713 |
|
925 |
|
|
|
|
|
53 |
|
58 |
|
816 |
|
1,011 |
|
|
|
|
|
|
|
|
|
|
|
| Round Mountain (50%) |
|
54 |
|
53 |
|
585 |
|
733 |
|
|
|
|
|
44 |
|
40 |
|
921 |
|
1,172 |
|
|
|
|
|
|
|
|
|
|
|
| Bald Mountain |
|
47 |
|
52 |
|
663 |
|
1,280 |
|
|
|
|
|
42 |
|
45 |
|
756 |
|
1,016 |
|
|
|
|
|
|
|
|
|
|
|
| Golden Sunlight |
|
16 |
|
15 |
|
1,658 |
|
2,046 |
|
|
|
|
|
15 |
|
14 |
|
1,207 |
|
1,611 |
|
|
|
|
|
|
|
|
|
|
|
| Ruby Hill |
|
2 |
|
2 |
|
693 |
|
834 |
|
|
|
|
|
5 |
|
5 |
|
504 |
|
644 |
| |
|
|
|
|
|
|
|
|
|
|
|
| Total Continuing Operations |
|
1,636 |
|
1,568 |
|
$547 |
|
$734 |
|
|
|
|
|
1,570 |
|
1,509 |
|
$603 |
|
$810 |
| |
|
|
|
|
|
|
|
|
|
|
|
| Cowal |
|
13 |
|
13 |
|
667 |
|
726 |
|
|
|
|
|
73 |
|
67 |
|
611 |
|
765 |
|
|
|
|
|
|
|
|
|
|
|
| Pierina |
|
14 |
|
15 |
|
915 |
|
1,310 |
|
|
|
|
|
6 |
|
2 |
|
1,387 |
|
3,025 |
| |
|
|
|
|
|
|
|
|
|
|
|
| Total Divested/Closed Sites |
|
27 |
|
28 |
|
$800 |
|
$1,039 |
|
|
|
|
|
79 |
|
69 |
|
$633 |
|
$831 |
| |
|
|
|
|
|
|
|
|
|
|
|
| Total Gold4 |
|
1,663 |
|
1,596 |
|
$551 |
|
$739 |
|
|
|
|
|
1,649 |
|
1,578 |
|
$604 |
|
$811 |
| |
|
|
|
|
|
|
|
|
|
|
|
| Total Consolidated Barrick |
|
1,663 |
|
1,596 |
|
$570 |
|
$771 |
|
|
|
|
|
1,649 |
|
1,578 |
|
$589 |
|
$834 |
| |
|
|
|
|
|
|
|
|
|
|
|
| |
|
Copper |
|
|
|
C1 Cash |
|
|
|
|
|
|
|
Copper |
|
|
|
C1 Cash |
|
|
| |
|
Produced |
|
Copper |
|
Costs |
|
C3 Cash Costs |
|
|
|
|
|
Produced |
|
Copper |
|
Costs |
|
C3 Cash Costs |
| |
|
(lbs) |
|
Sold (lbs) |
|
($/lb) |
|
($/lb) |
|
|
|
|
|
(lbs) |
|
Sold (lbs) |
|
($/lb) |
|
($/lb) |
| |
|
|
|
|
|
|
|
|
|
|
|
| Zaldívar |
|
63 |
|
66 |
|
$ 1.47 |
|
$ 1.61 |
|
|
|
|
|
56 |
|
56 |
|
$ 1.82 |
|
$ 2.12 |
|
|
|
|
|
|
|
|
|
|
|
| Lumwana |
|
77 |
|
79 |
|
1.59 |
|
1.39 |
|
|
|
|
|
75 |
|
56 |
|
1.84 |
|
2.63 |
| |
|
|
|
|
|
|
|
|
|
|
|
| Total Copper |
|
140 |
|
145 |
|
$ 1.53 |
|
$ 1.49 |
|
|
|
|
|
131 |
|
112 |
|
$ 1.82 |
|
$ 2.36 |
| |
| |
1 |
2014 cash costs per ounce for individual mine sites have been restated to exclude the impact of hedges. |
| |
2 |
Porgera presented on a 95% basis until August 31, 2015 and a 47.5% basis thereafter. |
| |
3 |
Acacia presented on a 73.9% basis until February 28, 2014 and a 63.9% basis thereafter. |
| |
4 |
Total gold cash costs and all-in sustaining costs per ounce exclude the impact of hedges and/or costs allocated to non-operating sites. |
|
|
|
|
|
| BARRICK THIRD QUARTER 2015 |
|
31 |
|
MANAGEMENT’S DISCUSSION AND ANALYSIS |
|
|
|
|
|
|
|
|
|
|
|
|
|
|
|
|
|
|
|
|
|
|
|
|
|
| Cortez, Nevada USA |
|
|
|
|
|
|
|
|
|
|
|
|
|
|
|
|
|
|
|
|
|
| Summary of Operating Data |
|
For the three months ended September 30 |
|
|
For the nine months ended September 30 |
|
| |
|
| |
|
2015 |
|
|
2014 |
|
|
% Change |
|
|
2015 |
|
|
2014 |
|
|
% Change |
|
| |
|
| Total tonnes mined (000s) |
|
|
37,149 |
|
|
|
36,880 |
|
|
|
1% |
|
|
|
115,406 |
|
|
|
112,656 |
|
|
|
2% |
|
| Ore tonnes processed (000s) |
|
|
5,245 |
|
|
|
7,115 |
|
|
|
(26%) |
|
|
|
14,428 |
|
|
|
19,424 |
|
|
|
(26%) |
|
| Average grade (grams/tonne) |
|
|
2.36 |
|
|
|
1.48 |
|
|
|
60% |
|
|
|
1.70 |
|
|
|
1.46 |
|
|
|
17% |
|
| Gold produced (000s/oz) |
|
|
321 |
|
|
|
273 |
|
|
|
18% |
|
|
|
647 |
|
|
|
717 |
|
|
|
(10%) |
|
| Gold sold (000s/oz) |
|
|
282 |
|
|
|
252 |
|
|
|
12% |
|
|
|
638 |
|
|
|
677 |
|
|
|
(6%) |
|
| Cost of sales ($ millions) |
|
|
$ 193 |
|
|
|
$ 189 |
|
|
|
2% |
|
|
|
$ 584 |
|
|
|
$ 489 |
|
|
|
19% |
|
| Cash costs (per oz)1 |
|
|
$ 394 |
|
|
|
$ 480 |
|
|
|
(18%) |
|
|
|
$ 561 |
|
|
|
$ 452 |
|
|
|
24% |
|
| All-in sustaining costs (per oz)1 |
|
|
$ 501 |
|
|
|
$ 591 |
|
|
|
(15%) |
|
|
|
$ 711 |
|
|
|
$ 667 |
|
|
|
7% |
|
| All-in costs (per oz)1 |
|
|
$ 543 |
|
|
|
$ 608 |
|
|
|
(11%) |
|
|
|
$ 777 |
|
|
|
$ 688 |
|
|
|
13% |
|
| |
|
|
|
|
| Summary of Financial Data |
|
For the three months ended September 30 |
|
|
For the nine months ended September 30 |
|
| |
|
| |
|
2015 |
|
|
2014 |
|
|
% Change |
|
|
2015 |
|
|
2014 |
|
|
% Change |
|
| |
|
| Segment EBIT ($ millions) |
|
|
$ 118 |
|
|
|
$ 130 |
|
|
|
(9%) |
|
|
|
$ 152 |
|
|
|
$ 370 |
|
|
|
(59%) |
|
| Segment EBITDA ($ millions)1 |
|
|
$ 195 |
|
|
|
$ 197 |
|
|
|
(1%) |
|
|
|
$ 373 |
|
|
|
$ 552 |
|
|
|
(32%) |
|
| Capital expenditures ($millions)2 |
|
|
$ 38 |
|
|
|
$ 31 |
|
|
|
23% |
|
|
|
$ 128 |
|
|
|
$ 151 |
|
|
|
(15%) |
|
| Minesite sustaining |
|
|
$ 26 |
|
|
|
$ 27 |
|
|
|
(4%) |
|
|
|
$ 86 |
|
|
|
$ 137 |
|
|
|
(37%) |
|
| Minesite expansion |
|
|
$ 12 |
|
|
|
$ 4 |
|
|
|
200% |
|
|
|
$ 42 |
|
|
|
$ 14 |
|
|
|
200% |
|
| |
|
| |
1 |
These are non-GAAP financial performance measures; for further information and a detailed reconciliation, please see pages 52 - 58 of this MD&A.
|
| |
2 |
Amounts presented exclude capitalized interest. |
Financial Results
Segment EBIT for the three and nine month periods ended September 30, 2015 were 9% and 59% lower,
respectively, than the same prior year periods. The decrease in third quarter was primarily due to a lower realized gold price and higher depreciation expense, partially offset by an increase in sales volume. For the nine month period ended
September 30, 2015, the decrease was primarily due to a reduction in sales volumes combined with a lower realized gold price.
Gold production
for the three and nine month periods ended September 30, 2015 was 18% higher and 10% lower, respectively, compared to the same prior year periods. The increase in third quarter 2015 was primarily due to an increase in underground production.
This was partially offset by a decrease in open pit production due to mine sequencing. For the nine month period ended September 30, 2015, the decrease was primarily due to the concentration of mining in the Cortez Hills phase 4, which has been
primarily low grade leach ore, combined with the processing of lower grade stockpile ore, whereas higher grade ore from Cortez Hills phase 3 was available for processing in the same prior year period.
Cost of sales for the three and nine month periods ended September 30, 2015 was in line and 19% higher, respectively, compared to the same prior
year periods. The increase for the nine month period ended September 30, 2015 was primarily due to the recognition of $75 million in inventory write-downs in the first half of 2015 as a result of the mining of low grade ore combined with
the impact of high depreciation base for the Cortez Hills open pit, as well as the impact of lower capitalized stripping costs from Cortez Hills phase 4. Cash costs were $86 per ounce lower and
$109 per ounce higher for the three and nine month periods ended September 30, 2015, respectively, compared to the same prior year periods. The decrease in third quarter 2015 was primarily due to a reduction in consumable costs due to fewer
tonnes processed and lower labor costs resulting from a reduction in contractor spend, combined with the impact of higher sales volume on unit production costs. For the nine month period ended September 30, 2015, the increase in cash costs was
primarily due to the higher cost of sales combined with the impact of lower sales volume on unit production costs. All-in sustaining costs decreased by $90 per ounce and increased by $44 per ounce over the same prior year periods due to the impact
of the lower and higher cash costs, respectively, partially offset by a decrease in minesite sustaining capital expenditures.
Capital expenditures
for the three and nine month periods ended September 30, 2015 increased by 23% and decreased by 15%, respectively, compared to the same prior year periods. The increase in third quarter 2015 was primarily due to an increase in capitalized
stripping costs associated with the Crossroads pit combined with an increase in minesite expansion expenditures spend relating to the Lower Zone and CHUG Deep South expansion projects. For the nine month period ended September 30, 2015, the
decrease was primarily due to a
|
|
|
|
|
| BARRICK THIRD QUARTER 2015 |
|
32 |
|
MANAGEMENT’S DISCUSSION AND ANALYSIS |
reduction in minesite sustaining capital expenditures due to lower capitalized stripping costs, partially offset by an increase in minesite expansion capital expenditures relating to the Lower
Zone and CHUG Deep South expansion.
We are committed to improving our cost structure and in 2015 the focus is on improving efficiency and reducing
costs through several initiatives, including increased operating efficiency from the underground operations, reductions in the use of contractors site wide and continued refinements to the organizational structure. Efforts to reduce operating costs
in 2015 are on track and planned capital expenditures for the year have been reduced.
We now expect 2015 production to be 900 to 950 thousand
ounces, higher than our previous guidance range of 825 to 900 thousand ounces. This is mainly due
to unanticipated positive ore model reconciliation in the Cortez Hills open pit resulting in higher open pit grades processed at the oxide plant. In addition, toll ore production at Goldstrike,
specifically on underground ore, has out-performed original expectations. We now expect cash costs to be in the range of $540 to $560 per ounce, which is lower than our previous guidance range of $560 to $610 per ounce. This is mainly due to the
impact of higher production combined with lower direct operating costs. We now expect all-in sustaining costs to be in the range of $675 to $725 per ounce, which is lower than our previous guidance range of $760 to $835 per ounce. All-in sustaining
costs are expected to be lower due to the lower cash costs per ounce combined with a decrease in minesite sustaining capital expenditures due to the cancellation or deferral of certain capital items.
|
|
|
|
|
|
|
|
|
|
|
|
|
|
|
|
|
|
|
|
|
|
|
|
|
|
|
| Goldstrike, Nevada USA |
|
|
|
|
|
|
|
|
|
|
|
|
|
|
|
|
|
|
|
|
| Summary of Operating Data |
|
For the three months ended September 30 |
|
|
|
|
For the nine months ended September 30 |
|
| |
|
| |
|
2015 |
|
|
2014 |
|
|
% Change |
|
|
|
|
2015 |
|
|
2014 |
|
|
% Change |
|
| |
|
| Total tonnes mined (000s) |
|
|
8,158 |
|
|
|
20,344 |
|
|
|
(60%) |
|
|
|
|
|
40,123 |
|
|
|
61,643 |
|
|
|
(35%) |
|
| Ore tonnes processed (000s) |
|
|
1,799 |
|
|
|
1,631 |
|
|
|
10% |
|
|
|
|
|
4,730 |
|
|
|
4,015 |
|
|
|
18% |
|
| Average grade (grams/tonne) |
|
|
7.03 |
|
|
|
5.58 |
|
|
|
26% |
|
|
|
|
|
5.99 |
|
|
|
6.57 |
|
|
|
(9%) |
|
| Gold produced (000s/oz) |
|
|
328 |
|
|
|
239 |
|
|
|
37% |
|
|
|
|
|
741 |
|
|
|
715 |
|
|
|
4% |
|
| Gold sold (000s/oz) |
|
|
291 |
|
|
|
230 |
|
|
|
27% |
|
|
|
|
|
654 |
|
|
|
713 |
|
|
|
(8%) |
|
| Cost of sales ($ millions) |
|
|
$ 209 |
|
|
|
$ 162 |
|
|
|
29% |
|
|
|
|
|
$ 471 |
|
|
|
$ 504 |
|
|
|
(7%) |
|
| Cash costs (per oz) |
|
|
$ 490 |
|
|
|
$ 571 |
|
|
|
(14%) |
|
|
|
|
|
$ 527 |
|
|
|
$ 562 |
|
|
|
(6%) |
|
| All-in sustaining costs (per oz) |
|
|
$ 558 |
|
|
|
$ 923 |
|
|
|
(40%) |
|
|
|
|
|
$ 698 |
|
|
|
$ 849 |
|
|
|
(18%) |
|
| All-in costs (per oz) |
|
|
$ 555 |
|
|
|
$ 1,336 |
|
|
|
(58%) |
|
|
|
|
|
$ 748 |
|
|
|
$ 1,160 |
|
|
|
(36%) |
|
| |
|
|
|
|
|
| Summary of Financial Data |
|
For the three months ended September 30 |
|
|
|
|
For the nine months ended September 30 |
|
| |
|
| |
|
2015 |
|
|
2014 |
|
|
% Change |
|
|
|
|
2015 |
|
|
2014 |
|
|
% Change |
|
| |
|
| Segment EBIT ($ millions) |
|
|
$ 118 |
|
|
|
$ 133 |
|
|
|
(11%) |
|
|
|
|
|
$ 276 |
|
|
|
$ 411 |
|
|
|
(33%) |
|
| Segment EBITDA ($ millions) |
|
|
$ 177 |
|
|
|
$ 164 |
|
|
|
8% |
|
|
|
|
|
$ 395 |
|
|
|
$ 514 |
|
|
|
(24%) |
|
| Capital expenditures ($ millions) |
|
|
$ 14 |
|
|
|
$ 173 |
|
|
|
(92%) |
|
|
|
|
|
$ 127 |
|
|
|
$ 417 |
|
|
|
(70%) |
|
| Minesite sustaining |
|
|
$ 15 |
|
|
|
$ 78 |
|
|
|
(81%) |
|
|
|
|
|
$ 94 |
|
|
|
$ 196 |
|
|
|
(52%) |
|
| Minesite expansion |
|
|
($ 1) |
|
|
|
$ 95 |
|
|
|
(101%) |
|
|
|
|
|
$ 33 |
|
|
|
$ 221 |
|
|
|
(85%) |
|
| |
|
Financial Results
Segment EBIT for the three and nine month periods ended September 30, 2015 were 11% and 33% lower,
respectively, than the same prior year periods. The decreases were primarily due to a lower realized gold price, partially offset by an increase in sales volume combined with a decrease in open pit and underground mining costs.
Gold production for the three and nine month periods ended September 30, 2015 was 37% and 4% higher, respectively, compared to the same prior year
periods.
The increases were primarily the result of higher production from the autoclave due to the commissioning of
the thiosulfate circuit in third quarter 2015 combined with the processing of significantly higher grade ore from the North Betze layback that was in a stripping phase during 2014.
Cost of sales for the three and nine month periods ended September 30, 2015 was 29% higher and 7% lower, respectively, compared to the same prior
year periods. The increase in third quarter 2015 was primarily due to
|
|
|
|
|
| BARRICK THIRD QUARTER 2015 |
|
33 |
|
MANAGEMENT’S DISCUSSION AND ANALYSIS |
an increase in tonnes mined from the North Betze layback, resulting in a reduction in capitalized development costs compared to third quarter 2014, partially offset by a decrease in open pit and
underground mining costs. For the nine month period ended September 30, 2015, the decrease was primarily due to lower open pit and underground mining costs resulting from a reduction in fuel costs and fuel consumption as a result of shorter
hauls combined with lower contractor services costs due to the completion of an underground development project. For the three and nine month periods ended September 30, 2015, cash costs were $81 per ounce and $35 per ounce lower, respectively,
compared to the same prior year periods. In third quarter 2015, the decrease in cash costs was primarily due to the impact of the higher sales volume on unit production costs, which more than offset the increase in cost of sales. For the nine month
period ended September 30, 2015, the decrease in cash costs was primarily due to the lower costs of sales which more than offset the impact of the lower sales volume on unit production costs. All-in sustaining costs were $365 per ounce and $151
per ounce lower compared to the same prior year periods. The decreases were primarily due to the lower cash costs combined with a decrease in minesite sustaining and minesite expansion capital expenditures.
Capital expenditures for the three and nine month periods ended September 30, 2015 decreased by 92% and 70%, respectively, compared to the same
prior year periods. The decreases were primarily due to a decrease in minesite expansion capital expenditure as a result of a reduction in costs associated with the thiosulfate circuit, as it entered commercial production in third quarter 2015,
combined with a reduction in capitalized stripping expenditures relating to the North Betze layback, as ore was reached and stripping activities ended in first quarter 2015.
We are committed to improving our cost structure, and in 2015 we are working towards improving operating
performance and reducing costs through several initiatives, including enhanced integration between maintenance and supply chain, which is resulting in inventory optimizations, and also incremental improvements in underground contractor costs.
We now expect 2015 production to be within the range of 1,000 to 1,100 thousand ounces, which is narrowed from our previous guidance range of 1,000
to 1,150 thousand ounces. The reduction to the top end of the range is due to slower than anticipated ramp up of the thiosulfate circuit primarily due to issues surrounding water treatment and recoveries. We now expect cash costs to be in the
range of $525 to $550 per ounce, which is below the previous guidance range of $540 to $590 per ounce. Offsetting lower production is lower direct spend across the site, higher capitalized margins associated with the longer than anticipated ramp up
of the thiosulfate circuit, and lower royalties due to lower production and lower gold prices. We now expect all-in sustaining costs to be in the range of $650 to $700 per ounce, which is below our previous guidance range of $700 to $800 per ounce.
The lower all-in sustaining costs are primarily due to lower cash costs combined with lower sustaining capital expenditures due to the cancellation or deferral of certain capital items.
|
|
|
|
|
| BARRICK THIRD QUARTER 2015 |
|
34 |
|
MANAGEMENT’S DISCUSSION AND ANALYSIS |
|
|
|
|
|
|
|
|
|
|
|
|
|
|
|
|
|
|
|
|
|
|
|
|
|
| Pueblo Viejo, Dominican Republic |
|
|
| 60% basis |
|
|
|
|
| Summary of Operating Data |
|
For the three months ended September 30 |
|
|
For the nine months ended September 30 |
|
| |
|
| |
|
2015 |
|
|
2014 |
|
|
% Change |
|
|
2015 |
|
|
2014 |
|
|
% Change |
|
| |
|
| Total tonnes mined (000s) |
|
|
6,149 |
|
|
|
5,404 |
|
|
|
14% |
|
|
|
16,473 |
|
|
|
15,768 |
|
|
|
4% |
|
| Ore tonnes processed (000s) |
|
|
1,173 |
|
|
|
983 |
|
|
|
19% |
|
|
|
3,331 |
|
|
|
2,940 |
|
|
|
13% |
|
| Average grade (grams/tonne) |
|
|
5.23 |
|
|
|
5.71 |
|
|
|
(9%) |
|
|
|
4.70 |
|
|
|
5.57 |
|
|
|
(16%) |
|
| Gold produced (000s/oz) |
|
|
172 |
|
|
|
168 |
|
|
|
2% |
|
|
|
438 |
|
|
|
488 |
|
|
|
(10%) |
|
| Gold sold (000s/oz) |
|
|
171 |
|
|
|
173 |
|
|
|
(1%) |
|
|
|
456 |
|
|
|
503 |
|
|
|
(9%) |
|
| Cost of sales (100%) ($ millions) |
|
|
$ 252 |
|
|
|
$ 232 |
|
|
|
9% |
|
|
|
$ 707 |
|
|
|
$ 673 |
|
|
|
5% |
|
| Cash costs (per oz) |
|
|
$ 438 |
|
|
|
$ 442 |
|
|
|
(1%) |
|
|
|
$ 493 |
|
|
|
$ 442 |
|
|
|
12% |
|
| All-in sustaining costs (per oz) |
|
|
$ 554 |
|
|
|
$ 559 |
|
|
|
(1%) |
|
|
|
$ 628 |
|
|
|
$ 585 |
|
|
|
7% |
|
| All-in costs (per oz) |
|
|
$ 554 |
|
|
|
$ 559 |
|
|
|
(1%) |
|
|
|
$ 628 |
|
|
|
$ 585 |
|
|
|
7% |
|
| |
|
|
|
|
| Summary of Financial Data |
|
For the three months ended September 30 |
|
|
For the nine months ended September 30 |
|
| |
|
| |
|
2015 |
|
|
2014 |
|
|
% Change |
|
|
2015 |
|
|
2014 |
|
|
% Change |
|
| |
|
| Segment EBIT (100%) ($ millions) |
|
|
$ 113 |
|
|
|
$ 181 |
|
|
|
(38%) |
|
|
|
$ 341 |
|
|
|
$ 528 |
|
|
|
(35%) |
|
| Segment EBITDA (100%) ($ millions) |
|
|
$ 196 |
|
|
|
$ 248 |
|
|
|
(21%) |
|
|
|
$ 563 |
|
|
|
$ 715 |
|
|
|
(21%) |
|
| Capital expenditures ($ millions) |
|
|
$ 14 |
|
|
|
$ 17 |
|
|
|
(18%) |
|
|
|
$ 50 |
|
|
|
$ 59 |
|
|
|
(15%) |
|
| Minesite sustaining |
|
|
$ 14 |
|
|
|
$ 17 |
|
|
|
(18%) |
|
|
|
$ 50 |
|
|
|
$ 59 |
|
|
|
(15%) |
|
| Minesite expansion |
|
|
- |
|
|
|
- |
|
|
|
- |
|
|
|
- |
|
|
|
- |
|
|
|
- |
|
| Project capex |
|
|
- |
|
|
|
- |
|
|
|
- |
|
|
|
- |
|
|
|
- |
|
|
|
- |
|
| |
|
Financial Results
Segment EBIT for the three and nine month periods ended September 30, 2015 were 38% and 35% lower,
respectively, than the same prior year periods primarily due to a lower realized gold price combined with an increase in cost of sales and a slight decrease in sales volume.
Gold production for the three and nine month periods ended September 30, 2015 was 2% higher and 10% lower, respectively, compared to the same prior
year periods. The increase in third quarter 2015 was primarily due to an increase in tonnes processed as a result of increased throughput. The decreased production for the nine month period ended September 30, 2015 was primarily due to lower
ore grades and decreased recovery rates as the ore mined in the first nine months of 2015 was from the upper benches of Montenegro and Moore phase 2, which contain a higher proportion of carbonaceous ore which has lower recoveries.
Cost of sales for the three and nine month periods ended September 30, 2015 was 9% and 5% higher, respectively, compared to the same prior year
periods. The increases are primarily due to an increase in the allocation of shared services costs to the site, partially offset by lower fuel costs, lower energy costs, and lower royalty costs. For the three and nine month periods ended
September 30, 2015, cash costs were $4 per ounce lower and $51 per ounce higher, respectively, compared to the same prior year periods. The decrease in third
quarter 2015 was primarily due to the impact of higher production levels on unit production costs, partially offset by an increase in cost of sales. For the nine month period ended
September 30, 2015, the increase was primarily due to the impact of lower sales volume on unit production costs. All-in sustaining costs decreased by $5 per ounce and increased by $43 per ounce, respectively, compared to the same prior year
periods primarily due to the lower and higher cash costs, respectively. For the nine month period ended September 30, 2015, the increase was partially offset by a reduction in minesite sustaining capital expenditures.
Capital expenditures for the three and nine month periods ended September 30, 2015 decreased by 18% and 15%, respectively, compared to the same
prior year periods. The decreases were primarily due to the deferral and cancellation of non-critical minesite sustaining capital expenditures in 2015.
We are committed to improving our cost structure, and in 2015 the focus will be on improving efficiency and reducing costs through several initiatives,
including increasing autoclave availability through optimized shutdown strategies, optimizing ore blending and assessing alternatives to reduce energy costs.
We continue to expect 2015 production to be in the range of 625 to 675 thousand ounces and all-in sustaining costs to be in the range of $540 to
$590 per ounce. We now
|
|
|
|
|
| BARRICK THIRD QUARTER 2015 |
|
35 |
|
MANAGEMENT’S DISCUSSION AND ANALYSIS |
expect cash costs to be in the range of $450 to $475 per ounce, which is higher than our previous guidance range of $390 to $425 per ounce primarily due to lower silver ounces produced as a
result of the lime boil being shut down for a period of time, resulting in lower silver by-product credits. The shutdown was due to unforeseen scale formation on activated carbon with hematite and
gypsum solids originating in the lime boil section. Steps were taken to remediate the issue and as a result
we do not expect to encounter this problem in the future as evidenced by increasing recovery rates in the third quarter.
|
|
|
|
|
|
|
|
|
|
|
|
|
|
|
|
|
|
|
|
|
|
|
|
|
| Lagunas Norte, Peru |
|
|
|
|
|
|
|
|
|
|
|
|
|
|
|
|
|
|
| Summary of Operating Data |
|
For the three months ended September 30 |
|
|
For the nine months ended September 30 |
|
| |
|
| |
|
2015 |
|
|
2014 |
|
|
% Change |
|
|
2015 |
|
|
2014 |
|
|
% Change |
|
| |
|
| Total tonnes mined (000s) |
|
|
12,466 |
|
|
|
14,432 |
|
|
|
(14%) |
|
|
|
37,443 |
|
|
|
36,816 |
|
|
|
2% |
|
| Ore tonnes processed (000s) |
|
|
5,635 |
|
|
|
5,566 |
|
|
|
1% |
|
|
|
16,640 |
|
|
|
16,351 |
|
|
|
2% |
|
| Average grade (grams/tonne) |
|
|
1.00 |
|
|
|
0.94 |
|
|
|
6% |
|
|
|
1.08 |
|
|
|
0.95 |
|
|
|
14% |
|
| Gold produced (000s/oz) |
|
|
108 |
|
|
|
157 |
|
|
|
(31%) |
|
|
|
441 |
|
|
|
406 |
|
|
|
9% |
|
| Gold sold (000s/oz) |
|
|
120 |
|
|
|
147 |
|
|
|
(18%) |
|
|
|
447 |
|
|
|
417 |
|
|
|
7% |
|
| Cost of sales ($ millions) |
|
|
$ 95 |
|
|
|
$ 88 |
|
|
|
8% |
|
|
|
$ 297 |
|
|
|
$ 220 |
|
|
|
35% |
|
| Cash costs (per oz) |
|
|
$ 344 |
|
|
|
$ 412 |
|
|
|
(17%) |
|
|
|
$ 327 |
|
|
|
$ 382 |
|
|
|
(14%) |
|
| All-in sustaining costs (per oz) |
|
|
$ 581 |
|
|
|
$ 554 |
|
|
|
5% |
|
|
|
$ 510 |
|
|
|
$ 552 |
|
|
|
(8%) |
|
| All-in costs (per oz) |
|
|
$ 581 |
|
|
|
$ 554 |
|
|
|
5% |
|
|
|
$ 510 |
|
|
|
$ 552 |
|
|
|
(8%) |
|
| |
|
|
|
|
| Summary of Financial Data |
|
For the three months ended September 30 |
|
|
For the nine months ended September 30 |
|
| |
|
| |
|
2015 |
|
|
2014 |
|
|
% Change |
|
|
2015 |
|
|
2014 |
|
|
% Change |
|
| |
|
| Segment EBIT ($ millions) |
|
|
$ 40 |
|
|
|
$ 108 |
|
|
|
(63%) |
|
|
|
$ 234 |
|
|
|
$ 328 |
|
|
|
(29%) |
|
| Segment EBITDA ($ millions) |
|
|
$ 85 |
|
|
|
$ 133 |
|
|
|
(36%) |
|
|
|
$ 366 |
|
|
|
$ 379 |
|
|
|
(3%) |
|
| Capital expenditures ($ millions) |
|
|
$ 19 |
|
|
|
$ 16 |
|
|
|
19% |
|
|
|
$ 50 |
|
|
|
$ 58 |
|
|
|
(14%) |
|
| Minesite sustaining |
|
|
$ 19 |
|
|
|
$ 16 |
|
|
|
19% |
|
|
|
$ 50 |
|
|
|
$ 58 |
|
|
|
(14%) |
|
| Minesite expansion |
|
|
- |
|
|
|
- |
|
|
|
- |
|
|
|
- |
|
|
|
- |
|
|
|
- |
|
| |
|
Financial Results
Segment EBIT for the three and nine month periods ended September 30, 2015 were 63% and 29% lower,
respectively, than the same prior year periods. The decrease in third quarter 2015 was primarily due to a lower realized gold price, higher depreciation expense and a decrease in sales volume. For the nine month period ended September 30, 2015,
the decrease was primarily due to a lower realized gold price, partially offset by an increase in sales volume.
Gold production for the three and
nine month periods ended September 30, 2015 was 31% lower and 9% higher, respectively, compared to the same prior year periods. The decrease in third quarter 2015 was primarily due to the processing of lower recovery ore combined with the
occurrence of irrigation issues which negatively impacted leaching activities, which are in the process of being resolved. For the nine month period ended September 30, 2015, the increase was primarily due to the acceleration in the recovery of
ounces as a result of the new leach pad and increased capacity provided by
the carbon-in-circuit and Merrill-Crowe plants combined with the processing of higher grade ore.
Cost of sales for the three and nine month periods ended September 30, 2015 was 8% and 35% higher, respectively, compared to the same prior year
periods. The increases were primarily due to an increase in depreciation expense arising from the depreciation of the carbon-in-circuit plant and new phase 5 leach pad and related facilities, which were both commissioned at the end of 2014, as well
as the new commissioned water treatment plant, partially offset by lower mining costs resulting from a reduction in fuel and explosives costs. For the three and nine month periods ended September 30, 2015, cash costs were $68 per ounce and $55
per ounce lower, respectively, compared to the same prior year periods. The decrease in third quarter 2015 was primarily due to the above reductions in costs of fuel and explosives, which more than offset the impact of decreased sales volume on unit
production costs. The decrease for the nine month period ended September 30, 2015 was primarily due to the impact of increased sales
|
|
|
|
|
| BARRICK THIRD QUARTER 2015 |
|
36 |
|
MANAGEMENT’S DISCUSSION AND ANALYSIS |
volumes on unit production costs. All-in sustaining costs increased by $27 per ounce and decreased by $42 per ounce over the same prior year periods. The increase in third quarter was due to the
increase in minesite sustaining capital expenditures, partially offset by the lower cash costs. For the nine month period ended September 30, 2015, the decrease was due to the lower cash costs combined with a decrease in minesite sustaining
capital expenditures.
Capital expenditures for the three and nine month periods ended September 30, 2015 increased by 19% and decreased by 14%,
respectively, compared to the same prior year periods. The increase in third quarter 2015 was primarily due to an increase in capitalized stripping costs combined with an increase in costs relating to the construction of phase 6 of the leach pad.
For the nine month period ended September 30, 2015, the decrease was primarily due to completion in 2014 of the carbon-in-circuit plant, water treatment plants and the new phase 5 leach pad and related facilities.
As part of our commitment towards continuous improvement of our cost structure, our focus for the remainder of 2015 is improving capital productivity,
reducing general and administrative costs, improving contract sourcing, and reducing cyanide consumption.
We now expect 2015 production to be in the
range of 550 to 590 thousand ounces, which is lower than our previous guidance range of 600 to 650 thousand ounces. Production is expected to be lower primarily due to the
lower than expected performance of leaching activities during third quarter 2015. We now expect cash costs to be in the range of $330 to $370 per ounce and all-in sustaining costs to be in the
range of $550 to $600 per ounce, which is lower than our previous guidance ranges of $350 to $400 per ounce and $600 to $650 per ounce respectively. Cash costs are expected to be lower due to decreased mining costs including, lower price of fuel and
improved efficiencies and lower royalties. The lower all-in sustaining costs are due to the partial deferral or cancelation of capital expenditure projects including the replacement of a programmed waste dump expansion for infill of a section of the
pit.
In 2008, the government of Peru adopted more stringent environmental water quality standards, including some that exceed international
standards. In 2012, the Lagunas Norte mine submitted a compliance plan in respect of the new water quality standards, including a request for relief from certain parameters exceeding international standards, along with a description of the required
additional water treatment infrastructure and its implementation schedule. In the absence of a regulatory change, the new water quality standards will come into force in December 2015. Barrick is evaluating the potential impact of the new water
quality standards on operating and closure costs at Lagunas Norte, and will consider a potential legal challenge if the mine does not obtain the requested relief and the effective date of the new standards is not postponed.
|
|
|
|
|
| BARRICK THIRD QUARTER 2015 |
|
37 |
|
MANAGEMENT’S DISCUSSION AND ANALYSIS |
|
|
|
|
|
|
|
|
|
|
|
|
|
|
|
|
|
|
|
|
|
|
|
|
|
| Veladero, Argentina |
|
|
|
|
|
|
|
|
|
|
|
|
|
|
|
|
|
|
| Summary of Operating Data |
|
For the three months ended September 30 |
|
|
For the nine months ended September 30 |
|
| |
|
| |
|
2015 |
|
|
2014 |
|
|
% Change |
|
|
2015 |
|
|
2014 |
|
|
% Change |
|
| |
|
| Total tonnes mined (000s) |
|
|
19,096 |
|
|
|
16,018 |
|
|
|
19% |
|
|
|
61,346 |
|
|
|
49,501 |
|
|
|
24% |
|
| Ore tonnes processed (000s) |
|
|
5,943 |
|
|
|
7,260 |
|
|
|
(18%) |
|
|
|
20,752 |
|
|
|
21,642 |
|
|
|
(4%) |
|
| Average grade (grams/tonne) |
|
|
0.76 |
|
|
|
1.11 |
|
|
|
(32%) |
|
|
|
0.78 |
|
|
|
1.02 |
|
|
|
(23%) |
|
| Gold produced (000s/oz) |
|
|
143 |
|
|
|
178 |
|
|
|
(20%) |
|
|
|
443 |
|
|
|
525 |
|
|
|
(16%) |
|
| Gold sold (000s/oz) |
|
|
152 |
|
|
|
166 |
|
|
|
(8%) |
|
|
|
473 |
|
|
|
527 |
|
|
|
(10%) |
|
| Cost of sales ($ millions) |
|
|
$ 138 |
|
|
|
$ 123 |
|
|
|
12% |
|
|
|
$ 376 |
|
|
|
$ 415 |
|
|
|
(9%) |
|
| Cash costs (per oz) |
|
|
$ 570 |
|
|
|
$ 576 |
|
|
|
(1%) |
|
|
|
$ 551 |
|
|
|
$ 580 |
|
|
|
(5%) |
|
| All-in sustaining costs (per oz) |
|
|
$ 914 |
|
|
|
$ 822 |
|
|
|
11% |
|
|
|
$ 957 |
|
|
|
$ 786 |
|
|
|
22% |
|
| All-in costs (per oz) |
|
|
$ 914 |
|
|
|
$ 822 |
|
|
|
11% |
|
|
|
$ 957 |
|
|
|
$ 786 |
|
|
|
22% |
|
| |
|
|
|
|
| Summary of Financial Data |
|
For the three months ended September 30 |
|
|
For the nine months ended September 30 |
|
| |
|
| |
|
2015 |
|
|
2014 |
|
|
% Change |
|
|
2015 |
|
|
2014 |
|
|
% Change |
|
| |
|
| Segment EBIT ($ millions) |
|
|
$ 28 |
|
|
|
$ 78 |
|
|
|
(64%) |
|
|
|
$ 168 |
|
|
|
$ 237 |
|
|
|
(29%) |
|
| Segment EBITDA ($ millions) |
|
|
$ 55 |
|
|
|
$ 101 |
|
|
|
(46%) |
|
|
|
$ 247 |
|
|
|
$ 326 |
|
|
|
(24%) |
|
| Capital expenditures ($ millions) |
|
|
$ 51 |
|
|
|
$ 40 |
|
|
|
28% |
|
|
|
$ 187 |
|
|
|
$ 104 |
|
|
|
80% |
|
| Minesite sustaining |
|
|
$ 51 |
|
|
|
$ 40 |
|
|
|
28% |
|
|
|
$ 187 |
|
|
|
$ 104 |
|
|
|
80% |
|
| Minesite expansion |
|
|
- |
|
|
|
- |
|
|
|
- |
|
|
|
- |
|
|
|
- |
|
|
|
- |
|
| |
|
Financial Results
Segment EBIT for the three and nine month periods ended September 30, 2015 were 64% and 29% lower,
respectively, than the same prior year periods. The decreases were primarily due to a decrease in sales volume and a lower realized gold price.
Gold
production for the three and nine month periods ended September 30, 2015 was 20% and 16% lower, respectively, compared to the same prior year periods. The decreases were primarily due to lower ore grades from Federico phase 3 combined with a
decrease in ore tonnes processed, partially offset by an increase in recoveries due to improved leach pad extraction kinetics.
Cost of sales for the
three and nine month periods ended September 30, 2015 was 12% higher and 9% lower, respectively, compared to the same prior year periods. The increase in third quarter 2015 was primarily due to an obsolescence provision recorded in the quarter
relating to mine supplies inventory. For the nine month period ended September 30, 2015, the decrease was primarily due to a reduction in operating costs primarily as a result of an increase in capitalized stripping costs combined with lower
royalty costs as a result of lower sales volume. This was partially offset by an increase in the allocation of shared services costs to the site. For the three and nine month periods ended September 30, 2015, cash costs were $6 per ounce and
$29 per ounce lower, respectively, compared to the same prior year periods. The decrease in third quarter 2015 is primarily due to an increase in silver by-product credits, partially offset by the impact of lower sales volume on unit production
costs. For the nine month period ended September 30, 2015, the decrease was primarily due to the lower cost of sales, partially offset by the impact of lower sales volume on unit production
costs. All-in sustaining costs increased by $92 per ounce and $171 per ounce over the same prior year periods primarily due to an increase in minesite sustaining capital expenditures resulting from an increase in capitalized stripping costs combined
with a decrease in sales volume.
Capital expenditures for the three and nine month periods ended September 30, 2015 increased by 28% and 80%,
respectively, compared to the same prior year periods. The increase in third quarter 2015 was primarily due to an increase in capitalized stripping costs combined with the purchase of mining equipment in the quarter. The increase for the nine month
period ended September 30, 2015 was primarily due to an increase in minesite sustaining capital expenditures relating to the construction of the phase 4B and phase 5A leach pad expansions combined with higher capitalized stripping costs.
As part of our commitment to continuous cost improvement, we continue to work towards improving operating performance and reducing costs through improved
maintenance and blasting activities, reduced contractor services costs, strict optimized capital allocation and recovery of ounces from inventory through management of the leach pad. Up to third quarter 2015, Veladero identified further
opportunities
|
|
|
|
|
| BARRICK THIRD QUARTER 2015 |
|
38 |
|
MANAGEMENT’S DISCUSSION AND ANALYSIS |
beyond the base plan and cut or deferred capital and optimized operational cost saving.
We
continue to expect 2015 production to be in the range of 575 to 625 thousand ounces and now expect cash costs to be in the range of $550 to $600 per ounce, which is lower than our previous guidance of $580 to $630 per ounce, due to a reduction
in direct operating costs, and all-in sustaining costs to be within a narrowed range of $950 to $1,000 per ounce, compared to our previous guidance range of $950 to $1,035 per ounce, primarily due to lower capital expenditures.
On September 13, 2015, a valve on a leach pad pipeline at Veladero failed, resulting in a release of cyanide-bearing process solution into a nearby
waterway through a diversion channel gate that was open at the time of the incident. Minera Argentina Gold S.A. (“MAGSA”), Barrick’s Argentine subsidiary that operates the Veladero mine, notified regulatory authorities of the
situation.
Environmental monitoring was conducted by MAGSA and independent third parties following the incident. The
Company believes this monitoring demonstrates that the incident posed no risk to human health at downstream communities. A temporary restriction on the addition of new cyanide to the mine’s processing circuit was lifted on September 24,
2015, and mine operations have returned to normal.
On October 9, 2015, the San Juan mining authority initiated an administrative sanction
process against MAGSA for alleged violations of the mining code relating to the valve failure and release of cyanide-bearing process solution. MAGSA submitted its response to these allegations on October 20, 2015. This process is expected to
result in a fine. Refer to note 23 to the Financial Statements for more information.
|
|
|
|
|
|
|
|
|
|
|
|
|
|
|
|
|
|
|
|
|
|
|
|
|
| Turquoise Ridge, Nevada USA |
|
|
|
|
|
|
|
|
|
|
|
|
|
|
|
|
| Summary of Operating Data |
|
For the three months ended September 30 |
|
|
For the nine months ended September 30 |
|
| |
|
| |
|
2015 |
|
|
2014 |
|
|
% Change |
|
|
2015 |
|
|
2014 |
|
|
% Change |
|
| |
|
| Total tonnes mined (000s) |
|
|
87 |
|
|
|
78 |
|
|
|
12% |
|
|
|
270 |
|
|
|
231 |
|
|
|
17% |
|
| Ore tonnes processed (000s) |
|
|
103 |
|
|
|
87 |
|
|
|
18% |
|
|
|
280 |
|
|
|
257 |
|
|
|
9% |
|
| Average grade (grams/tonne) |
|
|
18.07 |
|
|
|
20.90 |
|
|
|
(14%) |
|
|
|
18.81 |
|
|
|
20.48 |
|
|
|
(8%) |
|
| Gold produced (000s/oz) |
|
|
55 |
|
|
|
54 |
|
|
|
2% |
|
|
|
156 |
|
|
|
156 |
|
|
|
- |
|
| Gold sold (000s/oz) |
|
|
53 |
|
|
|
49 |
|
|
|
8% |
|
|
|
151 |
|
|
|
150 |
|
|
|
1% |
|
| Cost of sales ($ millions) |
|
|
$ 38 |
|
|
|
$ 26 |
|
|
|
46% |
|
|
|
$ 106 |
|
|
|
$ 79 |
|
|
|
34% |
|
| Cash costs (per oz) |
|
|
$ 602 |
|
|
|
$ 448 |
|
|
|
34% |
|
|
|
$ 585 |
|
|
|
$ 444 |
|
|
|
32% |
|
| All-in sustaining costs (per oz) |
|
|
$ 738 |
|
|
|
$ 592 |
|
|
|
25% |
|
|
|
$ 745 |
|
|
|
$ 594 |
|
|
|
25% |
|
| All-in costs (per oz) |
|
|
$ 738 |
|
|
|
$ 592 |
|
|
|
25% |
|
|
|
$ 745 |
|
|
|
$ 594 |
|
|
|
25% |
|
| |
|
| Summary of Financial Data |
|
For the three months ended September 30 |
|
|
For the nine months ended September 30 |
|
| |
|
| |
|
2015 |
|
|
2014 |
|
|
% Change |
|
|
2015 |
|
|
2014 |
|
|
% Change |
|
| |
|
| Segment EBIT ($ millions) |
|
|
$ 21 |
|
|
|
$ 37 |
|
|
|
(43%) |
|
|
|
$ 71 |
|
|
|
$ 114 |
|
|
|
(38%) |
|
| Segment EBITDA ($ millions) |
|
|
$ 27 |
|
|
|
$ 41 |
|
|
|
(34%) |
|
|
|
$ 88 |
|
|
|
$ 126 |
|
|
|
(30%) |
|
| Capital expenditures ($ millions) |
|
|
$ 7 |
|
|
|
$ 7 |
|
|
|
- |
|
|
|
$ 23 |
|
|
|
$ 22 |
|
|
|
5% |
|
| Minesite sustaining |
|
|
$ 7 |
|
|
|
$ 7 |
|
|
|
- |
|
|
|
$ 23 |
|
|
|
$ 22 |
|
|
|
5% |
|
| Minesite expansion |
|
|
- |
|
|
|
- |
|
|
|
- |
|
|
|
- |
|
|
|
- |
|
|
|
- |
|
| |
|
Financial Results
Segment EBIT for the three and nine month periods ended September 30, 2015 were 43% and 38% lower,
respectively, than the same prior year periods. The decreases were primarily due to lower realized price and higher costs of sales, partially offset by a slight increase in sales volume.
Gold production for the three and nine month periods ended September 30, 2015 was 2% higher and in line, respectively, compared to the same prior
year periods. The increased production in third quarter 2015 was
primarily due to the processing of more ore tonnes resulting from increased productivity due to transitioning to fully mechanized topcuts in first quarter 2015, which were then processed in the
subsequent quarters, partially offset by lower ore grades.
Cost of sales for the three and nine month periods ended September 30, 2015 was 46%
and 34% higher, respectively, compared to the same prior year periods. The increase in third quarter 2015 was primarily due to a reduction in capitalized underground development costs
|
|
|
|
|
| BARRICK THIRD QUARTER 2015 |
|
39 |
|
MANAGEMENT’S DISCUSSION AND ANALYSIS |
resulting from an increased focus on production mining activities. For the nine month period ended September 30, 2015, the increase was primarily due to an increase in underground labor
costs, as we added manpower to support production growth, higher maintenance costs due to the timing of planned replacement of major components and higher processing costs resulting from the processing of increased ore tonnes. For the three and nine
month periods ended September 30, 2015, cash costs per ounce were $154 per ounce and $141 per ounce higher, respectively, compared to the same prior year periods. The increases were primarily due to the higher costs of sales, partially offset
by the impact of higher sales volume on unit production costs. All-in sustaining costs increased by $146 per ounce and $151 per ounce over the same prior year periods primarily due to the higher cash costs.
Capital expenditures for the three and nine month periods ended September 30, 2015 were in line and 5% higher, respectively, compared to the same
prior year periods. The increase was primarily due to higher minesite sustaining capital expenditures for water treatment and ventilation, partially offset by lower
capitalized development costs, compared to the same prior year periods.
As part of our
commitment to continuous cost improvement, we are working towards improving operating performance and reducing costs through increased productivity, including an initiative to increase tonnage per foot mined by increasing mining dimensions. This
initiative has been successful and as a result we have expanded the increased dimensions to all topcut production heading designs going forward. There is only one remaining level that will continue at the smaller dimensions until it is completed in
April 2016 which was necessary to ensure a proper transition to the undercut below it.
We continue to expect 2015 production to be in the range of
175 to 200 thousand ounces at cash costs of $570 to $600 per ounce and now expect all-in sustaining costs to be within the range of $750 to $800 per ounce, which is lower than our previous guidance of $775 to $825 per ounce. This is primarily
due to lower sustaining capital expenditures resulting from the cancellation or deferral of certain capital items.
|
|
|
|
|
|
|
|
|
|
|
|
|
|
|
|
|
|
|
|
|
|
|
|
|
| Porgera, Papua New Guinea1 |
|
|
|
|
|
|
|
|
|
|
|
|
|
|
|
|
|
|
| Summary of Operating Data |
|
For the three months ended September 30 |
|
|
For the nine months ended September 30 |
|
| |
|
| |
|
2015 |
|
|
2014 |
|
|
% Change |
|
|
2015 |
|
|
2014 |
|
|
% Change |
|
| |
|
| Total tonnes mined (000s) |
|
|
5,332 |
|
|
|
3,570 |
|
|
|
49% |
|
|
|
14,956 |
|
|
|
11,209 |
|
|
|
33% |
|
| Ore tonnes processed (000s) |
|
|
1,156 |
|
|
|
1,484 |
|
|
|
(22%) |
|
|
|
3,879 |
|
|
|
4,158 |
|
|
|
(7%) |
|
| Average grade (grams/tonne) |
|
|
4.06 |
|
|
|
3.24 |
|
|
|
25% |
|
|
|
3.40 |
|
|
|
3.10 |
|
|
|
10% |
|
| Gold produced (000s/oz) |
|
|
134 |
|
|
|
138 |
|
|
|
(3%) |
|
|
|
370 |
|
|
|
368 |
|
|
|
1% |
|
| Gold sold (000s/oz) |
|
|
126 |
|
|
|
135 |
|
|
|
(7%) |
|
|
|
365 |
|
|
|
371 |
|
|
|
(2%) |
|
| Cost of sales ($ millions) |
|
|
$ 96 |
|
|
|
$ 138 |
|
|
|
(30%) |
|
|
|
$ 330 |
|
|
|
$ 405 |
|
|
|
(19%) |
|
| Cash costs (per oz) |
|
|
$ 741 |
|
|
|
$ 883 |
|
|
|
(16%) |
|
|
|
$ 820 |
|
|
|
$ 927 |
|
|
|
(12%) |
|
| All-in sustaining costs (per oz) |
|
|
$ 986 |
|
|
|
$ 974 |
|
|
|
1% |
|
|
|
$ 1,060 |
|
|
|
$ 1,002 |
|
|
|
6% |
|
| All-in costs (per oz) |
|
|
$ 986 |
|
|
|
$ 974 |
|
|
|
1% |
|
|
|
$ 1,060 |
|
|
|
$ 1,002 |
|
|
|
6% |
|
| |
|
| Summary of Financial Data |
|
For the three months ended September 30 |
|
|
For the nine months ended September 30 |
|
| |
|
| |
|
2015 |
|
|
2014 |
|
|
% Change |
|
|
2015 |
|
|
2014 |
|
|
% Change |
|
| |
|
| Segment EBIT ($ millions) |
|
|
$ 49 |
|
|
|
$ 39 |
|
|
|
26% |
|
|
|
$ 104 |
|
|
|
$ 73 |
|
|
|
42% |
|
| Segment EBITDA ($ millions) |
|
|
$ 52 |
|
|
|
$ 58 |
|
|
|
(10%) |
|
|
|
$ 134 |
|
|
|
$ 133 |
|
|
|
1% |
|
| Capital expenditures ($ millions) |
|
|
$ 30 |
|
|
|
$ 9 |
|
|
|
233% |
|
|
|
$ 84 |
|
|
|
$ 22 |
|
|
|
282% |
|
| Minesite sustaining |
|
|
$ 30 |
|
|
|
$ 9 |
|
|
|
233% |
|
|
|
$ 84 |
|
|
|
$ 22 |
|
|
|
282% |
|
| Minesite expansion |
|
|
- |
|
|
|
- |
|
|
|
- |
|
|
|
- |
|
|
|
- |
|
|
|
- |
|
| |
|
| |
1 |
Porgera is presented on a 95% basis until August 31, 2015 and 47.5% basis thereafter. |
Financial Results
Segment EBIT for the three and nine month periods ended September 30, 2015 were 26% and 42% higher,
respectively, than the same prior year periods. The increases were primarily due a lower cost of sales, partially offset by a lower realized gold price combined
with a decrease in sales volume, reflecting the divestment of 50% of our ownership in Porgera that was completed on August 31, 2015.
|
|
|
|
|
| BARRICK THIRD QUARTER 2015 |
|
40 |
|
MANAGEMENT’S DISCUSSION AND ANALYSIS |
Gold production for the three and nine month periods ended September 30, 2015 was 3% lower and 1%
higher, respectively, compared to the same prior year periods. The decrease in third quarter 2015 reflects the lower production attributable to Barrick as a result of the divestment that occurred on August 31. This was partially offset by the
processing of higher grade ore when compared to the same prior year period. For the nine month period ended September 30, 2015, the increase in production was primarily due to higher head grade driven by the improved performance from both open
pit and underground operations, partially offset by the impact of the 50% divestment.
Cost of sales for the three and nine month periods ended
September 30, 2015 was 30% and 19% lower, respectively, compared to the same prior year periods. The decreases were primarily due to lower operating costs as a result of a decrease in power and diesel costs, the impact of the devaluation of the
Australian dollar, as well as an increase in capitalized stripping costs. For the three and nine month periods ended September 30, 2015, cash costs were $142 per ounce and $107 per ounce lower, respectively, compared to the same prior year
periods primarily due to the decrease in cost of sales, partially offset by the impact of lower sales
volumes on unit production costs. All-in sustaining costs increased by $12 per ounce and $58 per ounce over the same prior year periods due to a significant increase in capitalized stripping, partially offset by the lower cash costs.
Capital expenditures for the three and nine month periods ended September 30, 2015 increased by 233% and 282%, respectively, compared to the same
prior year periods. The increases were primarily due to a significant increase in capitalized stripping costs as a result of a change in the 2015 mine plan that increased open pit mining activity combined with an increase in minesite sustaining
capital expenditures due to the commencement of a concentrate export project as well as a gas turbine power management system and controls project.
We continue to expect 2015 gold production to be in the range of 400 to 450 thousand ounces at cash costs of $775 to $825 per ounce and all-in
sustaining costs of $1,025 to $1,125 per ounce.
|
|
|
|
|
|
|
|
|
|
|
|
|
|
|
|
|
|
|
|
|
|
|
|
|
| Kalgoorlie, Australia |
|
|
|
|
|
|
|
|
|
|
|
|
|
|
|
|
|
|
| Summary of Operating Data |
|
For the three months ended September 30 |
|
|
For the nine months ended September 30 |
|
| |
|
| |
|
2015 |
|
|
2014 |
|
|
% Change |
|
|
2015 |
|
|
2014 |
|
|
% Change |
|
| |
|
| Total tonnes mined (000s) |
|
|
9,391 |
|
|
|
8,665 |
|
|
|
8% |
|
|
|
28,909 |
|
|
|
26,209 |
|
|
|
10% |
|
| Ore tonnes processed (000s) |
|
|
1,629 |
|
|
|
1,331 |
|
|
|
22% |
|
|
|
4,309 |
|
|
|
4,286 |
|
|
|
1% |
|
| Average grade (grams/tonne) |
|
|
2.22 |
|
|
|
2.19 |
|
|
|
1% |
|
|
|
2.05 |
|
|
|
2.04 |
|
|
|
- |
|
| Gold produced (000s/oz) |
|
|
97 |
|
|
|
82 |
|
|
|
18% |
|
|
|
237 |
|
|
|
244 |
|
|
|
(3%) |
|
| Gold sold (000s/oz) |
|
|
90 |
|
|
|
81 |
|
|
|
11% |
|
|
|
235 |
|
|
|
251 |
|
|
|
(6%) |
|
| Cost of sales ($ millions) |
|
|
$ 73 |
|
|
|
$ 77 |
|
|
|
(5%) |
|
|
|
$ 217 |
|
|
|
$ 237 |
|
|
|
(8%) |
|
| Cash costs (per oz) |
|
|
$ 660 |
|
|
|
$ 852 |
|
|
|
(23%) |
|
|
|
$ 779 |
|
|
|
$ 826 |
|
|
|
(6%) |
|
| All-in sustaining costs (per oz) |
|
|
$ 725 |
|
|
|
$ 1,040 |
|
|
|
(30%) |
|
|
|
$ 923 |
|
|
|
$ 1,004 |
|
|
|
(8%) |
|
| All-in costs (per oz) |
|
|
$ 725 |
|
|
|
$ 1,040 |
|
|
|
(30%) |
|
|
|
$ 923 |
|
|
|
$ 1,004 |
|
|
|
(8%) |
|
| |
|
| Summary of Financial Data |
|
For the three months ended September 30 |
|
|
For the nine months ended September 30 |
|
| |
|
| |
|
2015 |
|
|
2014 |
|
|
% Change |
|
|
2015 |
|
|
2014 |
|
|
% Change |
|
| |
|
| Segment EBIT ($ millions) |
|
|
$ 26 |
|
|
|
$ 23 |
|
|
|
13% |
|
|
|
$ 53 |
|
|
|
$ 81 |
|
|
|
(35%) |
|
| Segment EBITDA ($ millions) |
|
|
$ 41 |
|
|
|
$ 34 |
|
|
|
21% |
|
|
|
$ 90 |
|
|
|
$ 113 |
|
|
|
(20%) |
|
| Capital expenditures ($ millions) |
|
|
$ 4 |
|
|
|
$ 13 |
|
|
|
(69%) |
|
|
|
$ 27 |
|
|
|
$ 39 |
|
|
|
(31%) |
|
| Minesite sustaining |
|
|
$ 4 |
|
|
|
$ 13 |
|
|
|
(69%) |
|
|
|
$ 27 |
|
|
|
$ 39 |
|
|
|
(31%) |
|
| Minesite expansion |
|
|
- |
|
|
|
- |
|
|
|
- |
|
|
|
- |
|
|
|
- |
|
|
|
- |
|
| |
|
Financial Results
Segment EBIT for the three and nine month periods ended September 30, 2015 were 13% higher and 35%
lower, respectively, than the same prior year periods. The increase in third quarter 2015 was primarily due to an increase in sales volume combined with a decrease in
cost of sales, partially offset by a lower realized gold price. For the nine month period ended September 30, 2015, the decrease was primarily due to a reduction in sales volume combined
with a lower realized gold price, partially offset by a decrease in cost of sales.
|
|
|
|
|
| BARRICK THIRD QUARTER 2015 |
|
41 |
|
MANAGEMENT’S DISCUSSION AND ANALYSIS |
Gold production for the three and nine month periods ended September 30, 2015 was 18% higher and 3%
lower, respectively, compared to the same prior year periods. The increase in third quarter 2015 was primarily due to decreased maintenance time on the SAG mill combined with improved ore grades and an increase in ore tonnes processed resulting from
increased throughput. For the nine month period ended September 30, 2015, the decrease was primarily due to increased maintenance time on the SAG mill and operational downtime as a result of issues relating to the conveyor and lube system.
Cost of sales for the three and six month period ended September 30, 2015 was 5% and 8% lower, respectively, compared to the same prior year
periods. The decreases were primarily due to lower operating costs resulting from lower fuel costs combined with the impact of the devaluation of the Australian dollar, partially offset by the impact of processing increased ore tonnes. For the three
and nine month periods ended September 30, 2015, cash costs were $192 per ounce and $47 per ounce lower, respectively, compared to the same prior year periods. The decrease in third quarter 2015 was primarily due to the impact of higher sales
volume on unit production costs. For the nine month period ended September 30, 2015, the decrease in cash costs was primarily due to
lower operating costs, partially offset by the impact of lower sales volume on unit production costs. All-in sustaining costs were $315 per ounce lower and $81 per ounce lower, respectively,
compared to the same prior year periods primarily reflecting the impact of lower cash costs combined with a decrease in minesite sustaining capital expenditures.
Capital expenditures for the three and nine month periods ended September 30, 2015 decreased by 69% and 31%, respectively, compared to the same
prior year periods. The decreases were primarily due to lower capitalized stripping costs, partially offset by higher capital expenditures associated with an emissions reduction program.
We continue to expect 2015 production in the range of 315 to 330 thousand ounces and now expect cash costs in the range of $725 to $775 per ounce
and all-in sustaining costs of $850 to $900 per ounce, both lower than previous guidance ranges of $775 to $800 per ounce and $915 to $940 per ounce, respectively, primarily due to favorable foreign exchange movements.
|
|
|
|
|
|
|
|
|
|
|
|
|
|
|
|
|
|
|
|
|
|
|
|
|
| Acacia Mining plc1, Africa |
|
|
|
|
|
|
|
|
|
|
|
|
|
|
|
|
|
|
| 100% basis |
|
|
|
|
|
|
|
|
|
|
|
|
|
|
|
|
|
|
| Summary of Operating Data |
|
For the three months ended September 30 |
|
|
For the nine months ended September 30 |
|
| |
|
| |
|
2015 |
|
|
2014 |
|
|
% Change |
|
|
2015 |
|
|
2014 |
|
|
% Change |
|
| |
|
| Total tonnes mined (000s) |
|
|
10,787 |
|
|
|
11,016 |
|
|
|
(2%) |
|
|
|
31,262 |
|
|
|
30,908 |
|
|
|
1% |
|
| Ore tonnes processed (000s) |
|
|
2,296 |
|
|
|
2,238 |
|
|
|
3% |
|
|
|
6,855 |
|
|
|
6,008 |
|
|
|
14% |
|
| Average grade (grams/tonne) |
|
|
2.60 |
|
|
|
3.00 |
|
|
|
(13%) |
|
|
|
2.80 |
|
|
|
3.10 |
|
|
|
(10%) |
|
| Gold produced (000s/oz) |
|
|
164 |
|
|
|
191 |
|
|
|
(14%) |
|
|
|
531 |
|
|
|
538 |
|
|
|
(1%) |
|
| Gold sold (000s/oz) |
|
|
167 |
|
|
|
178 |
|
|
|
(6%) |
|
|
|
523 |
|
|
|
509 |
|
|
|
3% |
|
| Cost of sales ($ millions) |
|
|
$ 173 |
|
|
|
$ 166 |
|
|
|
4% |
|
|
|
$ 534 |
|
|
|
$ 500 |
|
|
|
7% |
|
| Cash costs (per oz) |
|
|
$ 807 |
|
|
|
$ 679 |
|
|
|
19% |
|
|
|
$ 789 |
|
|
|
$ 727 |
|
|
|
9% |
|
| All-in sustaining costs (per oz) |
|
|
$ 1,195 |
|
|
|
$ 1,098 |
|
|
|
9% |
|
|
|
$ 1,153 |
|
|
|
$ 1,111 |
|
|
|
4% |
|
| All-in costs (per oz) |
|
|
$ 1,193 |
|
|
|
$ 1,220 |
|
|
|
(2%) |
|
|
|
$ 1,151 |
|
|
|
$ 1,206 |
|
|
|
(5%) |
|
| |
|
| Summary of Financial Data |
|
For the three months ended September 30 |
|
|
For the nine months ended September 30 |
|
| |
|
| |
|
2015 |
|
|
2014 |
|
|
% Change |
|
|
2015 |
|
|
2014 |
|
|
% Change |
|
| |
|
| Segment EBIT ($ millions) |
|
|
$ 7 |
|
|
|
$ 63 |
|
|
|
(89%) |
|
|
|
$ 76 |
|
|
|
$ 153 |
|
|
|
(50%) |
|
| Segment EBITDA ($ millions) |
|
|
$ 39 |
|
|
|
$ 92 |
|
|
|
(58%) |
|
|
|
$ 175 |
|
|
|
$ 247 |
|
|
|
(29%) |
|
| Capital expenditures ($ millions) |
|
|
$ 51 |
|
|
|
$ 80 |
|
|
|
(36%) |
|
|
|
$ 134 |
|
|
|
$ 193 |
|
|
|
(31%) |
|
| Minesite sustaining |
|
|
$ 51 |
|
|
|
$ 59 |
|
|
|
(14%) |
|
|
|
$ 135 |
|
|
|
$ 148 |
|
|
|
(9%) |
|
| Minesite expansion |
|
|
- |
|
|
|
$ 21 |
|
|
|
(100%) |
|
|
|
($ 1) |
|
|
|
$ 45 |
|
|
|
(102%) |
|
| |
|
| |
1 |
Formerly African Barrick Gold plc. |
|
|
|
|
|
| BARRICK THIRD QUARTER 2015 |
|
42 |
|
MANAGEMENT’S DISCUSSION AND ANALYSIS |
Financial Results
Segment EBIT for the three and nine month periods ended September 30, 2015 were 89% and 50% lower,
respectively, than the same prior year periods. The decreases were primarily due to a decrease in sales volume combined with a lower realized gold price and higher costs of sales.
Gold production for the three and nine month period ended September 30, 2015 was 14% and 1% lower, respectively, compared to the same prior year
periods. The decrease in third quarter 2015 was due to lower production at Buzwagi and Bulyanhulu, partially offset by higher production at North Mara. For the nine month period ended September 30, 2015, the decreased production was due to
lower production at Buzwagi, partially offset by increased production at Bulyanhulu and North Mara. Production at Bulyanhulu for the three and nine month periods ended September 30, 2015 decreased 2% and increased 16%, respectively, over the
same prior year periods. The decrease in third quarter 2015 was primarily due to lower grade and a decrease in ore tonnes mined as a result of delays in accessing new higher grade stopes, combined with a decrease in recoveries. For the nine month
period ended September 30, 2015, the higher production was primarily due to increased production from the new CIL plant, which was commissioned in fourth quarter 2014, partially offset by lower recoveries, due to instability issues relating to
the elution circuit. Increased production at North Mara in third quarter 2015 and the first nine months of 2015 was primarily due to increased grades from the underground, partially offset by the mining of lower grade ore from the Nyabirama pit and
moving away from the main higher grade ore zone of the Gokona pit. Production at Buzwagi decreased 46% and 24% compared to the same prior year periods, respectively, primarily due to lower grade and lower throughput resulting from extended crusher
downtime and unplanned maintenance on the SAG mill.
Cost of sales for the three and nine month periods ended September 30, 2015 was 4% and 7%
higher, respectively, compared to the same prior year periods. The increases were primarily due to a decrease in capitalized stripping costs combined with lower copper co-product revenue and an increase in contractor services costs. This was
partially offset by lower labor costs as a result of headcount reductions, the impact of the devaluation of the Tanzanian shilling on local labor costs, and lower fuel costs due to a decrease in fuel prices. Cash costs per ounce were up 19% in third
quarter 2015 primarily due to the higher costs of sales combined with the impact of lower sales volume on unit production costs. For the nine
month period ended September 30, 2015, the 9% increase in cash costs per ounce reflects the higher costs of sales, partially offset by the impact of higher sales volume on unit production
costs. All-in sustaining costs for the three and nine month periods ended September 30, 2015 increased 9% and 4%, respectively, over the same prior year periods reflecting the higher cash costs, partially offset by a decrease in minesite
sustaining capital expenditures.
Capital expenditures for the three and nine month periods ended September 30, 2015 decreased by 36% and 31%,
respectively, compared to the same prior year periods. The decreases were primarily due to a reduction in minesite expansion capital expenditures attributable to lower costs relating to the CIL plant which was commissioned in fourth quarter 2014
combined with a decrease in minesite sustaining capital expenditures arising from a reduction in capitalized stripping costs.
We now expect 2015
production to be approximately 460 thousand ounces (Barrick’s share), which is below our previous guidance range of 480 to 510 thousand ounces. We now expect cash costs to be about $760 per ounce and all-in sustaining costs to be
about $1,155 per ounce, both of which are above our previous guidance ranges of $695 to $725 per ounce and $1,050 to $1,100 per ounce, respectively.
|
|
|
|
|
| BARRICK THIRD QUARTER 2015 |
|
43 |
|
MANAGEMENT’S DISCUSSION AND ANALYSIS |
|
|
|
|
|
|
|
|
|
|
|
|
|
|
|
|
|
|
|
|
|
|
|
|
|
| Zaldívar, Chile |
|
|
|
|
|
|
|
|
|
|
|
|
|
|
|
|
|
|
| Summary of Operating Data |
|
For the three months ended September 30 |
|
|
For the nine months ended September 30 |
|
| |
|
| |
|
2015 |
|
|
2014 |
|
|
% Change |
|
|
2015 |
|
|
2014 |
|
|
% Change |
|
| |
|
| Copper produced (millions of lbs) |
|
|
63 |
|
|
|
56 |
|
|
|
13% |
|
|
|
167 |
|
|
|
164 |
|
|
|
2% |
|
| Copper sold (millions of lbs) |
|
|
66 |
|
|
|
56 |
|
|
|
18% |
|
|
|
165 |
|
|
|
161 |
|
|
|
2% |
|
| Cost of sales ($ millions) |
|
|
$ 106 |
|
|
|
$ 122 |
|
|
|
(13%) |
|
|
|
$ 321 |
|
|
|
$ 356 |
|
|
|
(10%) |
|
| C1 cash costs (per lb) |
|
|
$ 1.47 |
|
|
|
$ 1.82 |
|
|
|
(19%) |
|
|
|
$ 1.67 |
|
|
|
$ 1.78 |
|
|
|
(6%) |
|
| C3 fully allocated costs (per lb) |
|
|
$ 1.61 |
|
|
|
$ 2.12 |
|
|
|
(24%) |
|
|
|
$ 1.95 |
|
|
|
$ 2.11 |
|
|
|
(7%) |
|
| |
|
|
|
|
| Summary of Financial Data |
|
For the three months ended September 30 |
|
|
For the nine months ended September 30 |
|
| |
|
| |
|
2015 |
|
|
2014 |
|
|
% Change |
|
|
2015 |
|
|
2014 |
|
|
% Change |
|
| |
|
| Segment EBIT ($ millions) |
|
|
$ 38 |
|
|
|
$ 64 |
|
|
|
(41%) |
|
|
|
$ 87 |
|
|
|
$ 174 |
|
|
|
(50%) |
|
| Segment EBITDA ($ millions) |
|
|
$ 47 |
|
|
|
$ 83 |
|
|
|
(43%) |
|
|
|
$ 131 |
|
|
|
$ 226 |
|
|
|
(42%) |
|
| Capital expenditures ($ millions) |
|
|
$ 33 |
|
|
|
$ 21 |
|
|
|
57% |
|
|
|
$ 61 |
|
|
|
$ 73 |
|
|
|
(16%) |
|
| Minesite sustaining |
|
|
$ 33 |
|
|
|
$ 21 |
|
|
|
57% |
|
|
|
$ 61 |
|
|
|
$ 73 |
|
|
|
(16%) |
|
| Minesite expansion |
|
|
- |
|
|
|
- |
|
|
|
- |
|
|
|
- |
|
|
|
- |
|
|
|
- |
|
| Project capex |
|
|
- |
|
|
|
- |
|
|
|
- |
|
|
|
- |
|
|
|
- |
|
|
|
- |
|
| |
|
Financial Results
Segment EBIT for the three and nine month periods ended September 30, 2015 were 41% and 50% lower,
respectively, than the same prior year periods. The decreases were primarily due to a lower realized copper price and a decrease in cost of sales, partially offset by an increase in sales volume.
Copper production for the three and nine month periods ended September 30, 2015 was 13% and 2% higher compared to the same prior year periods. The
increase in third quarter 2015 was primarily due to the processing of planned higher grade ore at higher recovery rates. For the nine month period ending September 30, 2015, the increase was primarily due to the same factors impacting
production in the third quarter, partially offset by flooding at the mine as a result of a severe rain event at the end of first quarter 2015, which negatively impacted production in the first half of the year.
Cost of sales for three and nine month periods ended September 30, 2015 were 13% and 10% lower, respectively, than the same prior year periods. The
decrease in third quarter 2015 was primarily due to a decrease in depreciation expense resulting from the impact of ceasing depreciation of the Zaldívar assets upon reclassifying them as held-for-sale combined with an increase in capitalized
stripping costs, partially offset by higher mining costs as a result of more ore tonnes mined compared to the same prior year period. For the nine month period ended September 30, 2015, the decrease was primarily due to lower consumption costs
as a result of lower tonnes mined compared to the same prior year period, partially offset by a reduction in
capitalized stripping costs and lower depreciation expense. For the three and nine month periods ended September 30, 2015, C1 cash costs were 19% and 6% lower, respectively, than the same
prior year periods. The decreases were primarily due to the impact of higher sales volume on unit production costs. C3 fully allocated costs per pound were $0.51 per pound and $0.16 per pound lower, respectively, compared to the same prior year
periods, reflecting the effect of the above factors on C1 cash costs.
Capital expenditures for the three and nine month periods ended
September 30, 2015 increased 57% and decreased 16%, respectively, compared to the same prior year periods. The increase in third quarter 2015 was primarily due to an increase in capitalized stripping costs whereas the decrease for the nine
month period was due to lower capitalized stripping costs compared to the same prior year period.
We now expect 2015 copper production to be in the
range of 210 to 230 million pounds, which is lower than our previous guidance range of 230 to 250 million pounds. The lower production is primarily due to the sale of 50% of our ownership in Zaldívar, which is expected to close in
fourth quarter 2015, combined with the impact of a severe rain event the occurred in first quarter 2015 which negatively impacted production. We now expect C1 cash costs to be in the range of $1.65 to $1.85 per pound, narrowed from our previous
guidance range of $1.65 to $1.95 per pound, and C3 fully allocated costs to be in the range of $1.95 to $2.20 per pound, which is lower than our previous guidance range of $2.00 to $2.30 per
|
|
|
|
|
| BARRICK THIRD QUARTER 2015 |
|
44 |
|
MANAGEMENT’S DISCUSSION AND ANALYSIS |
pound, due to lower depreciation expense resulting from the impact of ceasing depreciation of the Zaldívar assets upon reclassifying them as held-for-sale.
On October 18, 2015, a wall failure occurred in the Zaldívar open pit. Mining in the area of
the open pit where the instability occurred was almost complete and, as a consequence, there is no impact to copper production. Similar grade copper ore material is available elsewhere in the open pit and ore stockpiles.
|
|
|
|
|
|
|
|
|
|
|
|
|
|
|
|
|
|
|
|
|
|
|
|
|
| Lumwana, Zambia |
|
|
|
|
|
|
|
|
|
|
|
|
|
|
|
|
|
|
| Summary of Operating Data |
|
For the three months ended September 30 |
|
|
For the nine months ended September 30 |
|
| |
|
| |
|
2015 |
|
|
2014 |
|
|
% Change |
|
|
2015 |
|
|
2014 |
|
|
% Change |
|
| |
|
| Copper produced (millions of lbs) |
|
|
77 |
|
|
|
75 |
|
|
|
3% |
|
|
|
206 |
|
|
|
138 |
|
|
|
49% |
|
| Copper sold (millions of lbs) |
|
|
79 |
|
|
|
56 |
|
|
|
41% |
|
|
|
212 |
|
|
|
135 |
|
|
|
57% |
|
| Cost of sales ($ millions) |
|
|
$ 104 |
|
|
|
$ 109 |
|
|
|
(5%) |
|
|
|
$ 377 |
|
|
|
$ 328 |
|
|
|
15% |
|
| C1 cash costs (per lb) |
|
|
$ 1.59 |
|
|
|
$ 1.84 |
|
|
|
(13%) |
|
|
|
$ 1.82 |
|
|
|
$ 2.26 |
|
|
|
(20%) |
|
| C3 fully allocated costs (per lb) |
|
|
$ 1.39 |
|
|
|
$ 2.63 |
|
|
|
(47%) |
|
|
|
$ 2.15 |
|
|
|
$ 2.99 |
|
|
|
(28%) |
|
| |
|
| Summary of Financial Data |
|
For the three months ended September 30 |
|
|
For the nine months ended September 30 |
|
| |
|
| |
|
2015 |
|
|
2014 |
|
|
% Change |
|
|
2015 |
|
|
2014 |
|
|
% Change |
|
| |
|
| Segment EBIT ($ millions) |
|
|
$ 19 |
|
|
|
$ 24 |
|
|
|
(21%) |
|
|
|
$ 2 |
|
|
|
- |
|
|
|
- |
|
| Segment EBITDA ($ millions) |
|
|
$ 28 |
|
|
|
$ 54 |
|
|
|
(48%) |
|
|
|
$ 38 |
|
|
|
$ 66 |
|
|
|
(42%) |
|
| Capital expenditures ($ millions) |
|
|
$ 28 |
|
|
|
$ 69 |
|
|
|
(59%) |
|
|
|
$ 71 |
|
|
|
$ 160 |
|
|
|
(56%) |
|
| Minesite sustaining |
|
|
$ 28 |
|
|
|
$ 69 |
|
|
|
(59%) |
|
|
|
$ 71 |
|
|
|
$ 160 |
|
|
|
(56%) |
|
| Minesite expansion |
|
|
- |
|
|
|
- |
|
|
|
- |
|
|
|
- |
|
|
|
- |
|
|
|
- |
|
| Project capex |
|
|
- |
|
|
|
- |
|
|
|
- |
|
|
|
- |
|
|
|
- |
|
|
|
- |
|
| |
|
Financial Results
Segment EBIT for the three and nine month periods ended September 30, 2015 were $5 million lower and
$2 million higher, respectively, than the same prior year periods. The decrease in third quarter 2015 was primarily due to a lower realized price, partially offset by an increase in sales volume. For the nine month period ended September 30,
2015, the increase was primarily due to an increase in sales volume resulting from the mill shutdown that occurred in second quarter 2014 as a result of the partial collapse of the terminal end of the main conveyor that negatively impacted
production, partially offset by a lower realized copper price.
Copper production for the three and nine month periods ended September 30, 2015
was 3% and 49% higher, respectively, compared to the same prior year periods. The increase in third quarter 2015 was primarily due to improved wet weather preparation in the mine combined with an increase in operating efficiency compared to the same
prior year period. For the nine month period ended September 30, 2015, the increase was primarily due to the conveyor collapse mentioned above combined with better operating conditions at the mine in 2015.
Cost of sales for the three and nine month period ended September 30, 2015 was 5% lower and 15%
higher, respectively, compared to the same prior year periods. The decrease in third quarter 2015 is primarily due a reduction in operating costs resulting from the devaluation of the Zambian kwacha combined with lower depreciation expense. The
increase for the nine month period ended September 30, 2015 was primarily due to higher mining costs as a result of more ore tonnes mined compared to the same prior year period, partially offset by the impact of the devaluation of the Zambian
kwacha and lower depreciation expense resulting from the impairment charge taken in fourth quarter 2014. For the three and nine month periods ended September 30, 2015, C1 cash costs were 13% and 20% lower, respectively, than the same prior year
periods. The decreases were primarily due to the impact of higher sales volume on unit production costs and a continued positive trend in mining and processing efficiency resulting in a lower unit cost. C3 fully allocated costs per pound were $1.24
per pound and $0.84 per pound lower respectively, compared to the same prior year periods reflecting the impact of lower C1 cash costs and lower depreciation as a result of the impairment taken in fourth quarter 2014. This was partially offset by a
higher royalty rate of 20%,
|
|
|
|
|
| BARRICK THIRD QUARTER 2015 |
|
45 |
|
MANAGEMENT’S DISCUSSION AND ANALYSIS |
which was effective in the first six months of 2015, compared to 6% in the first half of 2014.
Capital expenditures for the three and nine month periods ended September 30, 2015 decreased by 59% and 56%, respectively, compared to the same
prior year periods. The decreases were primarily due to lower capitalized stripping costs combined with the deferral of minesite sustaining expenditures in anticipation of the suspension of operations.
In July 2015, the Zambian government passed amendments to the country’s mining tax regime that replaced the recently adopted 20 percent gross
royalty on open pit mines with a nine percent royalty, along with the reintroduction of a 30 percent corporate income tax, a 50% of taxable income limitation on the utilization of tax loss carryforwards, and a 15 percent variable profits tax. In
third quarter 2015 we evaluated the potential for a reversal of previous impairments recorded in fourth quarter 2014 and based on the current mine plan, lower short-term copper prices and a higher observable discount rate offset the lower royalty
rate and therefore no impairment reversal is required at the current time.
Also in second quarter 2015, the Zambian power authority (“ZESCO”) announced a reduction to power
generation necessitated by the low water levels in its reservoirs as a result of the poor rainfall experienced during the recent rainy season. We are continuing to work with ZESCO to manage a monthly power cap and are focused on power usage
efficiencies and savings to minimize the impact on production.
We now expect 2015 production guidance to be in the range of 260 to 280 million
pounds, higher than our previous guidance range of 250 to 270 million pounds. The increase in production is due to improved grades from the open pit combined with a change in the stockpiling and re-handling strategy. We now expect C1 cash costs
to be in the range of $1.80 to $2.00 per pound and C3 fully allocated costs to be in the range of $2.25 to $2.50 per pound, lower than our previous guidance ranges of $1.90 to $2.15 per pound and $2.65 to $2.95 per pound. The decrease in C1 cash
costs is primarily due to the impact of increased production, and the decrease in C3 fully allocated costs is primarily as a result of lower depreciation expense and the impact of the devaluation of the Zambian kwacha.
FINANCIAL CONDITION REVIEW
|
|
|
|
|
|
|
|
|
|
|
| Summary Balance Sheet and Key Financial Ratios |
|
| |
|
|
|
|
|
| ($ millions, except ratios and share amounts) |
|
As at September 30, 2015 |
|
|
|
|
As at December 31, 2014 |
|
| |
|
| Total cash and equivalents |
|
|
$ 3,317 |
|
|
|
|
|
$ 2,699 |
|
| Current assets |
|
|
5,143 |
|
|
|
|
|
3,451 |
|
| Non-current assets |
|
|
23,937 |
|
|
|
|
|
27,729 |
|
| |
|
| Total Assets |
|
|
$ 32,397 |
|
|
|
|
|
$ 33,879 |
|
| |
|
| Current liabilities excluding short-term debt |
|
|
$ 2,308 |
|
|
|
|
|
$ 2,227 |
|
| Non-current liabilities excluding long-term debt |
|
|
5,396 |
|
|
|
|
|
5,709 |
|
| Debt (current and long-term) |
|
|
12,321 |
|
|
|
|
|
13,081 |
|
| |
|
| Total Liabilities |
|
|
$ 20,025 |
|
|
|
|
|
$ 21,017 |
|
| |
|
| Total shareholders’ equity |
|
|
9,775 |
|
|
|
|
|
10,247 |
|
| Non-controlling interests |
|
|
2,597 |
|
|
|
|
|
2,615 |
|
| |
|
| Total Equity |
|
|
$ 12,372 |
|
|
|
|
|
$ 12,862 |
|
| |
|
| Total common shares outstanding (millions of shares)1 |
|
|
1,165 |
|
|
|
|
|
1,165 |
|
| |
|
|
|
|
|
| Key Financial Ratios: |
|
|
|
|
|
|
|
|
| |
|
| Current ratio2 |
|
|
2.53:1 |
|
|
|
|
|
2.40:1 |
|
| Debt-to-equity3 |
|
|
1.00:1 |
|
|
|
|
|
1.02:1 |
|
| Debt-to-total capitalization4 |
|
|
0.37:1 |
|
|
|
|
|
0.39:1 |
|
| |
|
| |
1 |
Total common shares outstanding do not include 4.3 million stock options. |
| |
2 |
Represents current assets divided by current liabilities (including short-term debt) as at September 30, 2015 and December 31, 2014.
|
| |
3 |
Represents debt divided by total shareholders’ equity (including minority interest) as at September 30, 2015 and December 31, 2014.
|
| |
4 |
Represents debt divided by capital stock and debt as at September 30, 2015 and December 31, 2014. |
|
|
|
|
|
| BARRICK THIRD QUARTER 2015 |
|
46 |
|
MANAGEMENT’S DISCUSSION AND ANALYSIS |
Balance Sheet Review
Total assets were $32.3 billion at September 30, 2015, slightly lower than at December 31, 2014, primarily reflecting our 2015 dispositions. Our
asset base is primarily comprised of non-current assets such as property, plant and equipment and goodwill, reflecting the capital intensive nature of the mining business and our history of growing through acquisitions. Other significant assets
include production inventories, indirect taxes and other government receivables, and cash and equivalents. We typically do not carry a material accounts receivable balance, since only sales of concentrate and copper cathode have a settlement period.
Total liabilities at September 30, 2015 totaled $20 billion, approximately $1 billion lower than at December 31, 2014, reflecting debt repayments made during the year.
Shareholders’ Equity
|
|
|
|
|
| As at October 21, 2015 |
|
Number of shares |
|
| |
|
| Common shares |
|
|
1,164,796,918 |
|
| Stock options |
|
|
3,965,997 |
|
| |
|
Comprehensive Income
Comprehensive income consists of net income or loss, together with certain other economic gains and losses, which, collectively, are described as
“other comprehensive income” or “OCI”, and excluded from the income statement.
For third quarter 2015 other comprehensive income
was a loss of $108 million on an after-tax basis. The loss reflected losses of $104 million on hedge contracts designated for future periods, caused primarily by changes in currency exchange rates, copper prices, and fuel prices, $46 million in
losses for currency translation adjustments, and $3 million of losses recorded as a result in changes in the fair value of investments held during the quarter, partially offset by reclassification adjustments totaling $23 million for losses on hedge
contracts designated for 2015 (or ineffective amounts) that were transferred to earnings or PPE in conjunction with the recognition of the related hedge exposure, and a $22 million gain due to tax recovery on the overall decrease in OCI.
Included in accumulated other comprehensive income at September 30, 2015 were unrealized pre-tax losses on currency, commodity and interest rate
hedge contracts totaling $158 million. The balance relates to fuel and currency hedge contracts that are designated against operating costs and capital expenditures, primarily over
the next few years, including $14 million remaining in crystallized hedge losses related to our Australian dollar contracts that were settled in third quarter 2012 or closed out in the second
half of 2013 and $16 million in crystallized hedge gains related to our silver contracts. These hedge gains/losses are expected to be recorded in earnings at the same time the corresponding hedged operating costs/depreciation are recorded in
earnings.
Financial Position and Liquidity
Our capital structure comprises a mix of debt and shareholders’ equity. As at September 30, 2015, our total debt was $12.3 billion (debt net of
cash and equivalents was $9.0 billion) and our debt-to-equity ratio and debt-to-total capitalization ratios were 1:1 and 0.37:1, respectively. This compares to debt as at December 31, 2014 of $13.1 billion (debt net of cash and equivalents was
$10.4 billion), and debt-to-equity and debt-to-total capitalization ratios of 1.02:1 and 0.39:1, respectively. Our $4.0 billion revolving credit facility (“2012 Credit Facility”) is fully undrawn and expires in January 2020.
Earlier this year, we set a debt reduction target of $3 billion in 2015. Thus far, we have completed or announced asset sales, joint ventures and
partnerships valued at $2.46 billion. A portion of the net proceeds from the sale of the Cowal mine were used to redeem the outstanding $229 million aggregate principal amount of 2.90% notes due 2016 issued by Barrick. The notes were redeemed on
September 9, 2015 in accordance with their terms. Using further proceeds from our divestitures and streaming transaction, on September 29, 2015, we commenced a cash tender offer of up to $750 million for specified series of outstanding
notes. The maximum tender amount was subsequently increased to $850 million. The tender offer was settled on October 28, 2015. In addition, on October 15, 2015, the Company redeemed the outstanding $264 million aggregate principal amount
of 5.75% notes due 2016 issued by a wholly-owned subsidiary. After reflecting the debt repayments made in October 2015, we have attributable debt principal of less than $15 million maturing by the end of 2015 and less than $250 million due by the
end of 2017. Building on the $1.9 billion in debt repayments made through October 2015, we intend to use approximately $1 billion in proceeds from the sale of 50 percent of Zaldívar to reduce debt. The sale is expected to close in the fourth
quarter. This would bring total debt repayments to approximately $2.9 billion. We intend to use free cash flow to reach our target of $3 billion.
|
|
|
|
|
| BARRICK THIRD QUARTER 2015 |
|
47 |
|
MANAGEMENT’S DISCUSSION AND ANALYSIS |
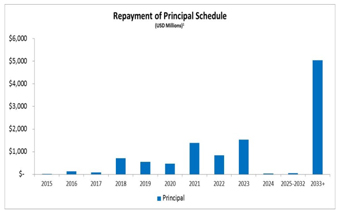
| 1 |
Amounts exclude capital leases and include 60% of the Pueblo Viejo financing and 100% of the Acacia financing. |
Our primary source of liquidity is our operating cash flow, which is dependent on the ability of our operations to deliver projected future cash flows.
In July 2015, the company’s Board of Directors reduced the quarterly dividend by 60 percent to $0.02 per share as a prudent measure to increase financial flexibility in light of current market conditions1. The Board of Directors also approved a Dividend Reinvestment Plan (the “DRIP”), which was made available to eligible shareholders for the first time with payment of the above-mentioned
dividend on September 15, 2015 to shareholders of record on August 31, 2015. The DRIP allows registered or beneficial holders of Barrick’s common shares who reside in Canada or the United States to reinvest cash dividends paid on
their common shares in additional common shares at a discount to the average market price (as defined in the DRIP), currently set at 3% and subject to change at the discretion of the board of directors. Other options to enhance liquidity include
drawing the $4.0 billion available under our 2012 Credit Facility (subject to compliance with covenants and the making of certain representations and warranties, this facility is available for drawdown as a source of financing); further non-core
asset sales or joint ventures opportunities; and issuances of debt or equity securities in the public markets or to private investors, which could be undertaken for liquidity enhancement and/or in connection with establishing a strategic
partnership. Many factors, including but not limited to, general market conditions and then prevailing metals prices could impact our ability to issue securities on acceptable terms, as could our credit ratings. Moody’s and S&P currently
rate our long-term debt Baa3 (stable) and BBB- (stable), respectively, after our credit ratings were downgraded by S&P on March 2, 2015 to BBB-
| 1 |
The declaration and payment of dividends is at the discretion of the Board of Directors and will depend on the company’s financial results, cash
requirements, future prospects and other factors deemed relevant by the Board.
|
(stable) and by Moody’s on Aug 12, 2015 to Baa3 (stable), both of which are the lowest investment
grade ratings. Further changes in our ratings could affect the trading prices of our securities and our cost of capital. If we were to borrow under our 2012 Credit Facility, the applicable interest rate on the amounts borrowed would be based, in
part, on our credit ratings at the time. The key financial covenant in the 2012 Credit Facility (undrawn as at August 5, 2015) requires Barrick to maintain a consolidated tangible net worth (“CTNW”) of at least $3.0 billion.
Barrick’s CTNW was $6.0 billion as at September 30, 2015.
Cash and equivalents and cash flow
Total cash and cash equivalents as at September 30, 2015 were $3.3 billion2. Our cash position
consists of a mix of term deposits, treasury bills and money market investments and is primarily denominated in US dollars.
Summary of Cash
Inflow (Outflow)
|
|
|
|
|
|
|
|
|
|
|
|
|
|
|
|
|
| ($ millions) |
|
For the three months
ended September 30 |
|
|
For the nine months
ended September 30 |
|
| |
|
| |
|
2015 |
|
|
2014 |
|
|
2015 |
|
|
2014 |
|
| |
|
|
|
|
|
|
| Operating inflows |
|
|
$ 1,255 |
|
|
|
$ 852 |
|
|
|
$ 2,096 |
|
|
|
$ 1,925 |
|
| |
|
|
|
|
|
|
| Investing activities |
|
|
|
|
|
|
|
|
|
|
|
|
|
|
|
|
|
|
|
|
|
| Capital Expenditures1 |
|
|
$ (389) |
|
|
|
$ (653) |
|
|
|
$ (1,402) |
|
|
|
$ (1,885) |
|
|
|
|
|
|
| Divestitures |
|
|
842 |
|
|
|
- |
|
|
|
844 |
|
|
|
166 |
|
|
|
|
|
|
| Other |
|
|
5 |
|
|
|
83 |
|
|
|
50 |
|
|
|
93 |
|
| |
|
|
|
|
|
|
| Total investing outflows |
|
|
$ 458 |
|
|
|
$ (570) |
|
|
|
$ (508) |
|
|
|
$ (1,626) |
|
| |
|
|
|
|
|
|
| Financing activities |
|
|
|
|
|
|
|
|
|
|
|
|
|
|
|
|
|
|
|
|
|
| Net change in debt |
|
|
$ (492) |
|
|
|
$ (65) |
|
|
|
$ (759) |
|
|
|
$ (25) |
|
|
|
|
|
|
| Dividends |
|
|
(23) |
|
|
|
(59) |
|
|
|
(139) |
|
|
|
(175) |
|
|
|
|
|
|
| Proceeds from divestment of 10% of issued ordinary share capital of Acacia |
|
|
- |
|
|
|
- |
|
|
|
- |
|
|
|
186 |
|
|
|
|
|
|
| Other |
|
|
(16) |
|
|
|
2 |
|
|
|
(58) |
|
|
|
4 |
|
| |
|
| Total financing (outflows) inflows |
|
|
$ (531) |
|
|
|
$ (122) |
|
|
|
$ (956) |
|
|
|
$ (10) |
|
| |
|
|
|
|
|
|
| Effect of exchange rate |
|
|
(5) |
|
|
|
(4) |
|
|
|
(12) |
|
|
|
(8) |
|
| |
|
| Increase/(decrease) in cash and equivalents |
|
|
$ 1,177 |
|
|
|
$ 156 |
|
|
|
$ 620 |
|
|
|
$ 281 |
|
| |
|
| |
1 |
The amounts include capitalized interest of nil and $17 million for the three and nine months ended September 30, 2015, respectively (2014: $2 million
and $15 million, respectively). |
|
In third quarter 2015, we generated $1,255 million in operating cash flow, compared to $852 million of operating
cash flow in the same prior year period. The increase in operating cash flow primarily reflects a $610 million deposit received in third quarter relating to the
| 2 |
Includes $449 million cash held at Acacia and Pueblo Viejo, which may not be readily deployed outside of Acacia and/or Pueblo Viejo.
|
|
|
|
|
|
| BARRICK THIRD QUARTER 2015 |
|
48 |
|
MANAGEMENT’S DISCUSSION AND ANALYSIS |
gold and silver streaming arrangement with Royal Gold, partially offset by lower realized gold and copper prices. The most significant driver of the change in operating cash flow is market gold
and copper prices. The ability of our operations to deliver projected future cash flows within the parameters of a reduced production profile, as well as future changes in gold and copper market prices, either favorable or unfavorable, will continue
to have a material impact on our cash flow and liquidity. The principal uses of operating cash flow are to fund our capital expenditures and interest.
Cash inflows from investing activities in third quarter 2015 amounted to $458 million compared to $570 million of cash outflows in the same prior year
period. The increase of $1,028 million compared to third quarter 2014 is primarily due to $842 million of proceeds from the divestiture of our Cowal mine and 50% of our Porgera mine in third quarter 2015, partially offset by a decrease in capital
expenditures. In third quarter 2015, capital
expenditures on a cash basis were $389 million compared to $653 million in third quarter 2014. The decrease
of $264 million is primarily due to a decrease in minesite development capital due to a reduction in capitalized stripping costs across most sites combined with a decrease in minesite expansion capital expenditures due to the Goldstrike thiosulfate
circuit entering commercial production in third quarter 2015.
Net financing cash outflows for third quarter 2015 amounted to $531 million, compared
to $122 million of cash outflows in the same prior year period. The net financing cash outflows in third quarter 2015 primarily consist of $493 million of debt repayments and $23 million of dividend payments. The net financing cash outflows for
third quarter 2014 primarily consist of $765 million in debt repayments combined with $139 million of dividend payments.
Summary of Financial Instruments
|
|
|
|
|
|
|
|
|
|
|
|
|
| As at September 30, 2015 |
|
|
|
|
|
|
|
|
|
|
|
| |
| Financial Instrument |
|
Principal/Notional Amount |
|
|
|
|
|
|
Associated Risks |
| |
|
|
|
|
|
|
|
|
|
|
|
|
• Interest rate |
| Cash and equivalents |
|
|
|
|
$ 3,317 |
|
|
|
|
million |
|
• Credit |
| |
|
|
|
|
|
|
|
|
|
|
|
|
• Credit |
| Accounts receivable |
|
|
|
|
$ 291 |
|
|
|
|
million |
|
• Market |
| |
|
|
|
|
|
|
|
|
|
|
|
|
• Market |
| Other investments |
|
|
|
|
$ 8 |
|
|
|
|
million |
|
• Liquidity |
| |
| Accounts payable |
|
|
|
|
$ 1,322 |
|
|
|
|
million |
|
• Liquidity |
| |
| Debt |
|
|
|
|
$ 12,426 |
|
|
|
|
million |
|
• Interest rate |
| |
| Restricted share units |
|
|
|
|
$ 32 |
|
|
|
|
million |
|
• Market |
| |
| Deferred share units |
|
|
|
|
$ 4 |
|
|
|
|
million |
|
• Market |
| |
|
|
CAD |
|
|
60 |
|
|
|
|
million |
|
• Market/liquidity |
|
|
CLP |
|
|
25,500 |
|
|
|
|
million |
|
• Credit |
|
|
AUD |
|
|
210 |
|
|
|
|
million |
|
• Interest rate |
| Derivative instruments - currency contracts |
|
ZAR |
|
|
93 |
|
|
|
|
million |
|
|
| |
|
|
|
|
|
|
|
|
|
|
|
|
• Market/liquidity |
|
|
|
|
|
|
|
|
|
|
|
|
• Credit |
| Derivative instruments - energy contracts |
|
Diesel |
|
|
7 |
|
|
|
|
million bbls |
|
• Interest rate |
| |
|
|
|
|
|
|
| Derivative instruments - interest rate contracts |
|
Receive float interest rate swaps |
|
|
$ 128 |
|
|
|
|
million |
|
• Market/liquidity |
| |
Commitments and Contingencies
Litigation and Claims
We are currently subject to various
litigation proceedings as disclosed in note 23 to the Financial Statements, and we may be involved in disputes with other parties in the future that may result in litigation. If we are unable to resolve these disputes favorably, it may have a
material adverse impact on our financial condition, cash flow and results of operations.
|
|
|
|
|
| BARRICK THIRD QUARTER 2015 |
|
49 |
|
MANAGEMENT’S DISCUSSION AND ANALYSIS |
Contractual Obligations and Commitments
|
|
|
|
|
|
|
|
|
|
|
|
|
|
|
|
|
|
|
|
|
|
|
|
|
|
|
|
|
| Payments due
As at September 30, 2015 |
|
| |
|
| ($ millions) |
|
20151 |
|
|
2016 |
|
|
2017 |
|
|
2018 |
|
|
2019 |
|
|
2020 and
thereafter |
|
|
Total |
|
| |
|
| Debt2 |
|
|
|
|
|
|
|
|
|
|
|
|
|
|
|
|
|
|
|
|
|
|
|
|
|
|
|
|
| Repayment of principal |
|
|
$ 11 |
|
|
|
$ 426 |
|
|
|
$ 125 |
|
|
|
$ 869 |
|
|
|
$ 867 |
|
|
|
$ 9,951 |
|
|
|
$ 12,249 |
|
| Capital leases |
|
|
12 |
|
|
|
44 |
|
|
|
40 |
|
|
|
33 |
|
|
|
19 |
|
|
|
29 |
|
|
|
177 |
|
| Interest |
|
|
263 |
|
|
|
642 |
|
|
|
624 |
|
|
|
616 |
|
|
|
545 |
|
|
|
6,438 |
|
|
|
9,128 |
|
| Provisions for environmental rehabilitation3 |
|
|
62 |
|
|
|
104 |
|
|
|
63 |
|
|
|
70 |
|
|
|
115 |
|
|
|
1,966 |
|
|
|
2,380 |
|
| Operating leases |
|
|
8 |
|
|
|
26 |
|
|
|
24 |
|
|
|
24 |
|
|
|
16 |
|
|
|
42 |
|
|
|
140 |
|
| Restricted share units |
|
|
4 |
|
|
|
8 |
|
|
|
16 |
|
|
|
5 |
|
|
|
- |
|
|
|
- |
|
|
|
33 |
|
| Pension benefits and other post-retirement benefits |
|
|
6 |
|
|
|
22 |
|
|
|
22 |
|
|
|
22 |
|
|
|
22 |
|
|
|
433 |
|
|
|
527 |
|
| Derivative liabilities4 |
|
|
74 |
|
|
|
139 |
|
|
|
56 |
|
|
|
26 |
|
|
|
2 |
|
|
|
- |
|
|
|
297 |
|
| Purchase obligations for supplies and consumables5 |
|
|
236 |
|
|
|
298 |
|
|
|
158 |
|
|
|
82 |
|
|
|
75 |
|
|
|
162 |
|
|
|
1,011 |
|
| Capital commitments6 |
|
|
57 |
|
|
|
93 |
|
|
|
9 |
|
|
|
6 |
|
|
|
5 |
|
|
|
7 |
|
|
|
177 |
|
| Social development costs7 |
|
|
30 |
|
|
|
8 |
|
|
|
6 |
|
|
|
6 |
|
|
|
6 |
|
|
|
178 |
|
|
|
234 |
|
| |
|
| Total |
|
|
$ 763 |
|
|
|
$ 1,810 |
|
|
|
$ 1,143 |
|
|
|
$ 1,759 |
|
|
|
$ 1,672 |
|
|
|
$ 19,206 |
|
|
|
$ 26,353 |
|
| |
|
| |
1 |
Represents the obligations and commitments for the remainder of the year. |
| |
2 |
Debt and Interest - Our debt obligations do not include any subjective acceleration clauses or other clauses that enable the holder of the debt to call for
early repayment, except in the event that we breach any of the terms and conditions of the debt or for other customary events of default. The debt and interest amounts include 100% of the Pueblo Viejo financing, even though our attributable share is
60 per cent of this total, consistent with our ownership interest in the mine. We are not required to post any collateral under any debt obligations. Projected interest payments on variable rate debt were based on interest rates in effect at
September 30, 2015. Interest is calculated on our long-term debt obligations using both fixed and variable rates. |
| |
3 |
Provisions for Environmental Rehabilitation - Amounts presented in the table represent the undiscounted uninflated future payments for the expected cost of
provisions for environmental rehabilitation. |
| |
4 |
Derivative Liabilities - Amounts presented in the table relate to derivative contracts disclosed under note 19C to the Financial Statements. Payments related
to derivative contracts may be subject to change given variable market conditions. |
| |
5 |
Purchase Obligations for Supplies and Consumables - Includes commitments related to new purchase obligations to secure a supply of acid, tires and cyanide for
our production process. |
| |
6 |
Capital Commitments - Purchase obligations for capital expenditures include only those items where binding commitments have been entered into.
|
| |
7 |
Social Development Costs - Includes Pascua-Lama’s commitment related to the potential funding of a power transmission line in Argentina of $97 million,
which is not expected to be paid prior to 2020. |
INTERNAL CONTROL OVER FINANCIAL REPORTING AND DISCLOSURE CONTROLS AND PROCEDURES
Management is responsible for establishing and maintaining adequate internal control over financial
reporting and disclosure controls and procedures as defined in our 2014 annual MD&A.
Together, the internal control over financial reporting and
disclosure controls and procedures frameworks provide internal control over financial reporting and disclosure. Due to its inherent limitations, internal control over financial reporting and disclosure may not prevent or detect all misstatements.
Further, the effectiveness of internal control is subject to the risk that controls may become inadequate because of changes in conditions, or that the degree of compliance with policies or procedures may change.
Management will continue to monitor the effectiveness of its internal control over financial reporting and
disclosure controls and procedures including those related to our management structure refinements and may make modifications from time to time as considered necessary.
|
|
|
|
|
| BARRICK THIRD QUARTER 2015 |
|
50 |
|
MANAGEMENT’S DISCUSSION AND ANALYSIS |
REVIEW OF
QUARTERLY RESULTS
Quarterly Information1
|
|
|
|
|
|
|
|
|
|
|
|
|
|
|
|
|
|
|
|
|
|
|
|
|
|
|
|
|
|
|
|
|
| |
|
2015 |
|
|
2014 |
|
|
|
|
|
2013 |
|
| |
|
| ($ millions, except where indicated) |
|
Q3 |
|
|
Q2 |
|
|
Q1 |
|
|
Q4 |
|
|
Q3 |
|
|
Q2 |
|
|
Q1 |
|
|
Q4 |
|
| |
|
| Revenues |
|
|
$ 2,315 |
|
|
|
$ 2,231 |
|
|
|
$ 2,245 |
|
|
|
$ 2,510 |
|
|
|
$ 2,624 |
|
|
|
$ 2,458 |
|
|
|
$ 2,647 |
|
|
|
$ 2,942 |
|
| Realized price per ounce - gold2 |
|
|
1,125 |
|
|
|
1,190 |
|
|
|
1,219 |
|
|
|
1,204 |
|
|
|
1,285 |
|
|
|
1,289 |
|
|
|
1,285 |
|
|
|
1,272 |
|
| Realized price per pound - copper2 |
|
|
2.18 |
|
|
|
2.66 |
|
|
|
2.55 |
|
|
|
2.91 |
|
|
|
3.09 |
|
|
|
3.17 |
|
|
|
3.03 |
|
|
|
3.34 |
|
| Cost of sales |
|
|
1,742 |
|
|
|
1,689 |
|
|
|
1,708 |
|
|
|
1,799 |
|
|
|
1,681 |
|
|
|
1,631 |
|
|
|
1,719 |
|
|
|
1,853 |
|
| Net earnings (loss) |
|
|
(264) |
|
|
|
(9) |
|
|
|
57 |
|
|
|
(2,851) |
|
|
|
125 |
|
|
|
(269) |
|
|
|
88 |
|
|
|
(2,830) |
|
| Per share (dollars)2,3 |
|
|
(0.23) |
|
|
|
(0.01) |
|
|
|
0.05 |
|
|
|
(2.45) |
|
|
|
0.11 |
|
|
|
(0.23) |
|
|
|
0.08 |
|
|
|
(2.61) |
|
| Adjusted net earnings2 |
|
|
131 |
|
|
|
60 |
|
|
|
62 |
|
|
|
174 |
|
|
|
222 |
|
|
|
159 |
|
|
|
238 |
|
|
|
406 |
|
| Per share (dollars)2,3 |
|
|
0.11 |
|
|
|
0.05 |
|
|
|
0.05 |
|
|
|
0.15 |
|
|
|
0.19 |
|
|
|
0.14 |
|
|
|
0.20 |
|
|
|
0.37 |
|
| Operating cash flow |
|
|
1,255 |
|
|
|
525 |
|
|
|
316 |
|
|
|
371 |
|
|
|
852 |
|
|
|
488 |
|
|
|
585 |
|
|
|
1,016 |
|
| Adjusted operating cash flow2 |
|
|
$ 1,255 |
|
|
|
$ 525 |
|
|
|
$ 316 |
|
|
|
$ 371 |
|
|
|
$ 852 |
|
|
|
$ 488 |
|
|
|
$ 585 |
|
|
|
$ 1,085 |
|
| Free cash flow2 |
|
|
$ 866 |
|
|
|
$ 26 |
|
|
|
($ 198) |
|
|
|
($ 176) |
|
|
|
$ 199 |
|
|
|
($ 128) |
|
|
|
($ 31) |
|
|
|
($ 280) |
|
| |
|
| |
1 |
Sum of all the quarters may not add up to the annual total due to rounding. |
| |
2 |
Calculated using weighted average number of shares outstanding under the basic method of earnings per share. |
| |
3 |
Realized price, adjusted net earnings, adjusted EPS and adjusted operating cash flow are non-GAAP financial performance measures with no standard meaning
under IFRS. For further information and a detailed reconciliation, please see pages 52 - 58 of this MD&A. |
Our recent financial results reflect a trend of declining spot gold prices, and as a result of an emphasis
on cost control and maximizing free cash flow, costs have also decreased. Our adjusted net earnings and adjusted operating cash flow levels have fluctuated with gold and copper realized prices and production levels each quarter. In third quarter
2015, we recorded a goodwill impairment charge of $476 million relating to our Zaldívar mine upon reclassification of the mine’s net assets as held-for-sale as the agreed selling price is lower than previously recognized carrying values.
In fourth quarter 2014, we recorded asset and goodwill
impairments of $2.8 billion (net of tax effects and non-controlling interests), primarily at Lumwana,
Zaldívar and Cerro Casale. The net loss in second quarter 2014 reflected asset and goodwill impairment charges of $514 million relating to Jabal Sayid as a result of classifying the project as held-for-sale. In fourth quarter 2013, we
recorded asset and goodwill impairment charges totaling $2.8 billion (net of tax effects and non-controlling interests), primarily at Pascua-Lama, Porgera, Veladero and goodwill related to our Australia Pacific segment.
IFRS CRITICAL ACCOUNTING POLICIES AND ACCOUNTING ESTIMATES
Management has discussed the development and determination of our critical accounting estimates and
significant accounting policies with the Audit Committee of the Board of Directors, and the Audit Committee has reviewed the disclosure relating to such estimates and policies in conjunction with its review of this MD&A. The accounting policies
and methods we utilize determine how we report our financial condition and results of operations, and they may require management to make estimates or rely on assumptions about matters that are inherently uncertain. Our significant accounting
policies are disclosed in note 2 of our most recent Annual Consolidated Financial Statements. A summary of current and future accounting policy changes is disclosed in notes 2B and 2C of the accompanying Financial Statements, respectively, including
our early adoption of IFRS 9 Financial Instruments in first quarter 2015.
Critical Accounting Estimates and Judgments
Certain accounting estimates have been identified as being “critical” to the presentation of our financial condition and results of operations
because they require us to make subjective and/or complex judgments about matters that are inherently uncertain; or there is a reasonable likelihood that materially different amounts could be reported under different conditions or using different
assumptions and estimates. Our significant accounting judgments, estimates and assumptions are disclosed in note 3 of the Annual Consolidated Financial Statements and an update is provided in note 3 of the accompanying Financial Statements.
Streaming transaction
The upfront cash deposit received from
Royal Gold on the gold and silver streaming transaction has been accounted for a deferred revenue as we have determined
|
|
|
|
|
| BARRICK THIRD QUARTER 2015 |
|
51 |
|
MANAGEMENT’S DISCUSSION AND ANALYSIS |
that it is not a derivative as it will satisfied through the delivery of nonfinancial items (i.e. gold and silver) rather than cash or financial assets. It is our intention to settle the
obligations under the streaming arrangement through our own production and if we were to fail to settle the obligations with Royal Gold through our own production, this would lead to the streaming arrangement becoming a derivative. This would cause
a change to the accounting treatment, resulting in the revaluation of the fair value of the agreement through profit and loss on a recurring basis.
Pascua-Lama
The Pascua-Lama project received $403 million in value added tax (“VAT”) refunds in Chile relating to the development of the Chilean
side of the project. These amounts must be repaid if the project does not enter production by June 30, 2018. However, in light of the temporary suspension of construction of the Pascua-Lama project, Barrick currently expects to be able to
extend the 2018 deadline in order to avoid repayment of these amounts. The Pascua-Lama project has also recorded $423 million in VAT recoverable in Argentina relating to the development of the Argentine side of the project. These amounts may not be
recoverable if the project does not enter into production and are subject to devaluation risk as the amounts are recoverable in Argentine pesos.
Accounting for
impairment of non-current assets
In accordance with our accounting policy, goodwill is tested for impairment in the fourth quarter and also when
there is an indicator of impairment. Non-current assets are tested for impairment when events or changes in circumstances suggest that the carrying amount may
not be recoverable. During third quarter we noted the following potential indicators of
impairment/reversal: Barrick’s market capitalization declining below the carrying value of our net assets; the Zambian government passing the amendments to their mining tax structure; the expected sale of various PP&E at Pascua-Lama and
Pueblo Viejo. Refer to note 18 to the Financial Statements for further details. Based on the results of our last impairment test performed in fourth quarter 2014, the carrying value of the CGUs that are most sensitive to the change in sales prices
used in the annual test are:
|
|
|
|
|
| |
|
| As at September 30, 2015 |
|
Carrying value |
|
| |
|
| Cortez1 |
|
|
$3,768 |
|
| Zaldívar1 |
|
|
2,010 |
|
| Pascua-Lama2 |
|
|
1,298 |
|
| Veladero1 |
|
|
1,123 |
|
| Bald Mountain2 |
|
|
517 |
|
| Cerro Casale2 |
|
|
510 |
|
| Lumwana2 |
|
|
349 |
|
| Round Mountain2 |
|
|
173 |
|
| |
|
| 1 |
Carrying value includes goodwill. |
| 2 |
These CGUs have been impaired or had an impairment reversal in 2014 and therefore their fair value approximates carrying value. |
As noted on page 48, the key financial covenant in the 2012 Credit Facility requires Barrick to maintain a CTNW of at least $3.0 billion. Barrick’s
CTNW would be reduced by the amount of any non-current asset impairments, repayments of VAT refunds or write-downs of VAT receivables. Barrick’s CTNW was $6.0 billion as at September 30, 2015.
NON-GAAP FINANCIAL PERFORMANCE MEASURES
We use certain non-GAAP financial performance measures in our MD&A. For a detailed description of each
of the non-GAAP measures used in this MD&A, please refer to the Non-GAAP Financial Performance Measures in our 2014 annual MD&A. The non-GAAP financial performance measures set out in this MD&A are intended to provide additional
information to investors and do not have any standardized definition under IFRS and should not be considered in isolation or as a substitute for measures of performance prepared in accordance with IFRS.
Starting with our first quarter 2015 MD&A, we have amended our calculation of cash costs to exclude hedge gains/losses in the individual mine site
figures. Hedge gains/losses will be included in the
consolidated company cash costs, but are not allocated because hedging is done at a corporate level and not
within the control of the mine site. Comparative figures have been restated to reflect this change.
Also starting with our first quarter 2015
MD&A, we have begun including costs that were formerly part of operating segment administration costs in cash costs. This was done to reflect the change in our operating structure that occurred at the end of 2014 to remove all regional oversight
and hold the mine sites directly accountable for the cost of the functional services they require to run their business.
|
|
|
|
|
| BARRICK THIRD QUARTER 2015 |
|
52 |
|
MANAGEMENT’S DISCUSSION AND ANALYSIS |
Reconciliation of Net Earnings to Adjusted Net Earnings and Adjusted Net Earnings per Share1
|
|
|
|
|
|
|
|
|
| ($ millions, except per share amounts in dollars) |
|
For the three months ended September 30 |
|
For the nine months ended September 30 |
| |
| |
|
2015 |
|
2014 |
|
2015 |
|
2014 |
| |
| Net earnings (loss) attributable to equity holders of the Company |
|
$ (264) |
|
$ 125 |
|
$ (216) |
|
($ 56) |
| Impairment charges related to intangibles, goodwill, property, plant and equipment, and investments2 |
|
455 |
|
10 |
|
480 |
|
546 |
| Acquisition/disposition (gains)/losses3 |
|
(54) |
|
(12) |
|
(80) |
|
(35) |
| Foreign currency translation (gains)/losses4 |
|
(45) |
|
42 |
|
(9) |
|
186 |
| Tax adjustments5 |
|
- |
|
- |
|
12 |
|
(112) |
| Other expense adjustments6 |
|
37 |
|
6 |
|
58 |
|
91 |
| Unrealized losses/(gains) on non-hedge derivative instruments7 |
|
2 |
|
51 |
|
8 |
|
(1) |
| |
| Adjusted net earnings |
|
$ 131 |
|
$ 222 |
|
$ 253 |
|
$ 619 |
| |
| Net earnings (loss) per share8 |
|
(0.23) |
|
0.11 |
|
(0.19) |
|
(0.05) |
| Adjusted net earnings per share8 |
|
0.11 |
|
0.19 |
|
0.22 |
|
0.53 |
| |
| |
1 |
Amounts presented in this table are after-tax and net of non-controlling interest. |
| |
2 |
Impairment charges for the three and nine month period ended September 30, 2015 is presented net of tax and non-controlling interest $3 million expense
and ($12) million benefit, respectively (2014: ($8) million benefit and $3 million expense, respectively). |
| |
3 |
Acquisition/disposition losses for the three and nine month period ended September 30, 2015 is presented net of tax nil, respectively (2014: ($3) million
benefit, respectively). |
| |
4 |
Foreign currency translation gains for the three and nine month period ended September 30, 2015 is presented net of tax and non-controlling interest $3
million expense and ($2) million benefit, respectively (2014: $13 million and $47 million expense, respectively). |
| |
5 |
Tax adjustments for the nine month period ended September 30, 2015 is presented net of non-controlling interest $8 million, respectively (2014: nil,
respectively). |
| |
6 |
Other expense adjustments for the three and nine month period ended September 30, 2015 is presented net of tax and non-controlling interest ($29) million
and ($37) million benefit, respectively (2014: $1 million expense and ($19) million benefit, respectively). |
| |
7 |
Unrealized losses/(gains) on non-hedge derivative instruments for the three and nine month period ended September 30, 2015 is presented net of tax ($1)
million benefit and $1 million expense, respectively (2014: ($15) million and ($1) million benefit, respectively). |
| |
8 |
Calculated using weighted average number of shares outstanding under the basic method of earnings per share. |
Reconciliation of Operating Cash Flow to Free Cash Flow
|
|
|
|
|
|
|
|
|
|
|
|
|
|
|
|
|
| ($ millions) |
|
For the three months ended September 30 |
|
|
For the nine months ended September 30 |
|
| |
|
| |
|
2015 |
|
|
2014 |
|
|
2015 |
|
|
2014 |
|
| |
|
| Operating cash flow |
|
|
$ 1,255 |
|
|
|
$ 852 |
|
|
|
$ 2,096 |
|
|
|
$ 1,925 |
|
| Capital expenditures |
|
|
(389) |
|
|
|
(653) |
|
|
|
(1,402) |
|
|
|
(1,885) |
|
| |
|
| Free cash flow |
|
|
$ 866 |
|
|
|
$ 199 |
|
|
|
$ 694 |
|
|
|
$ 40 |
|
| |
|
|
|
|
|
|
| BARRICK THIRD QUARTER 2015 |
|
53 |
|
MANAGEMENT’S DISCUSSION AND ANALYSIS |
Reconciliation of Gold Cost of Sales to Cash costs per ounce, All-in sustaining costs per ounce and
All-in costs per ounce
|
|
|
|
|
|
|
|
|
|
|
|
|
|
|
|
|
|
|
|
|
| ($ millions, except per ounce information in dollars) |
|
|
|
For the three months ended
September 30 |
|
|
For the nine months ended
September 30 |
|
| |
|
| |
|
|
|
Reference |
|
2015 |
|
|
2014 |
|
|
2015 |
|
|
2014 |
|
| |
|
|
|
Cost of sales |
|
A |
|
|
$ 1,489 |
|
|
|
$ 1,435 |
|
|
|
$ 4,323 |
|
|
|
$ 4,286 |
|
|
|
Cost of sales applicable to
non-controlling interests1 |
|
B |
|
|
(152) |
|
|
|
(130) |
|
|
|
(446) |
|
|
|
(382) |
|
|
|
Cost of sales applicable to power
sales |
|
C |
|
|
(9) |
|
|
|
(20) |
|
|
|
(26) |
|
|
|
(55) |
|
|
|
Other metal sales |
|
D |
|
|
(41) |
|
|
|
(45) |
|
|
|
(130) |
|
|
|
(138) |
|
|
|
Realized (gains)/losses on hedge and
non-hedge |
|
E |
|
|
30 |
|
|
|
(3) |
|
|
|
78 |
|
|
|
(12) |
|
|
|
Non-recurring items2 |
|
|
|
|
(61) |
|
|
|
- |
|
|
|
(61) |
|
|
|
- |
|
|
|
Treatment and refinement
charges |
|
F |
|
|
3 |
|
|
|
4 |
|
|
|
10 |
|
|
|
8 |
|
|
|
|
|
|
|
Total production costs |
|
|
|
|
$ 1,259 |
|
|
|
$ 1,241 |
|
|
|
$ 3,748 |
|
|
|
$ 3,707 |
|
|
|
|
|
|
|
Depreciation |
|
G |
|
|
($ 349) |
|
|
|
($ 312) |
|
|
|
($ 1,017) |
|
|
|
($ 935) |
|
|
|
|
|
|
|
Cash Costs |
|
|
|
|
$ 910 |
|
|
|
$ 929 |
|
|
|
$ 2,731 |
|
|
|
$ 2,772 |
|
|
|
|
|
|
|
General & administrative
costs |
|
H |
|
|
21 |
|
|
|
66 |
|
|
|
133 |
|
|
|
219 |
|
|
|
Rehabilitation - accretion and amortization (operating
sites) |
|
I |
|
|
38 |
|
|
|
30 |
|
|
|
110 |
|
|
|
97 |
|
|
|
Mine on-site exploration and evaluation
costs |
|
J |
|
|
9 |
|
|
|
6 |
|
|
|
31 |
|
|
|
15 |
|
|
|
Mine development expenditures3 |
|
K |
|
|
131 |
|
|
|
149 |
|
|
|
461 |
|
|
|
514 |
|
|
|
Sustaining capital expenditures3 |
|
K |
|
|
122 |
|
|
|
137 |
|
|
|
381 |
|
|
|
361 |
|
|
|
|
|
|
|
All-in sustaining costs |
|
|
|
|
$ 1,231 |
|
|
|
$ 1,317 |
|
|
|
$ 3,847 |
|
|
|
$ 3,978 |
|
|
|
|
|
|
|
Community relations costs not related to current
operations |
|
L |
|
|
5 |
|
|
|
3 |
|
|
|
12 |
|
|
|
15 |
|
|
|
Rehabilitation - accretion and amortization not related to
current operations |
|
I |
|
|
3 |
|
|
|
3 |
|
|
|
9 |
|
|
|
9 |
|
|
|
Exploration and evaluation costs
(non-sustaining) |
|
J |
|
|
20 |
|
|
|
37 |
|
|
|
89 |
|
|
|
108 |
|
|
|
Non-sustaining capital expenditures3 |
|
|
|
|
|
|
|
|
|
|
|
|
|
|
|
|
|
|
|
|
Pascua-Lama |
|
K |
|
|
- |
|
|
|
61 |
|
|
|
- |
|
|
|
92 |
|
|
|
Cortez |
|
K |
|
|
11 |
|
|
|
4 |
|
|
|
42 |
|
|
|
14 |
|
|
|
Goldstrike thiosulfate project |
|
K |
|
|
(1) |
|
|
|
95 |
|
|
|
33 |
|
|
|
221 |
|
|
|
Bulyanhulu CIL |
|
K |
|
|
- |
|
|
|
10 |
|
|
|
(1) |
|
|
|
28 |
|
|
|
Hemlo |
|
K |
|
|
- |
|
|
|
- |
|
|
|
38 |
|
|
|
- |
|
|
|
Other |
|
K |
|
|
30 |
|
|
|
9 |
|
|
|
70 |
|
|
|
18 |
|
|
|
|
|
|
|
All-in costs |
|
|
|
|
$ 1,299 |
|
|
|
$ 1,539 |
|
|
|
$ 4,139 |
|
|
|
$ 4,483 |
|
|
|
|
|
|
|
Ounces sold - consolidated basis (000s
ounces) |
|
|
|
|
1,784 |
|
|
|
1,755 |
|
|
|
4,992 |
|
|
|
5,219 |
|
|
|
Ounces sold - non-controlling interest
(000s ounces)1 |
|
|
|
|
(188) |
|
|
|
(177) |
|
|
|
(545) |
|
|
|
(507) |
|
|
|
Ounces sold - equity basis (000s
ounces) |
|
|
|
|
1,596 |
|
|
|
1,578 |
|
|
|
4,447 |
|
|
|
4,712 |
|
|
|
|
|
|
|
Total production costs per ounce4 |
|
|
|
|
$ 789 |
|
|
|
$ 787 |
|
|
|
$ 843 |
|
|
|
$ 786 |
|
|
|
|
|
|
|
Cash costs per ounce4 |
|
|
|
|
$ 570 |
|
|
|
$ 589 |
|
|
|
$ 614 |
|
|
|
$ 588 |
|
|
|
Cash costs per ounce (on a co-product
basis)4,5 |
|
|
|
|
$ 592 |
|
|
|
$ 607 |
|
|
|
$ 639 |
|
|
|
$ 609 |
|
|
|
|
|
|
|
All-in sustaining costs per ounce4 |
|
|
|
|
$ 771 |
|
|
|
$ 834 |
|
|
|
$ 866 |
|
|
|
$ 844 |
|
|
|
All-in sustaining costs per ounce (on a
co-product basis)4,5 |
|
|
|
|
$ 793 |
|
|
|
$ 852 |
|
|
|
$ 891 |
|
|
|
$ 865 |
|
|
|
|
|
|
|
All-in costs per ounce4 |
|
|
|
|
$ 815 |
|
|
|
$ 975 |
|
|
|
$ 932 |
|
|
|
$ 951 |
|
|
|
All-in costs per ounce (on a co-product basis)4,5 |
|
|
|
|
$ 837 |
|
|
|
$ 993 |
|
|
|
$ 957 |
|
|
|
$ 972 |
|
|
|
|
|
| |
1 |
Amounts represent our share of capital expenditures. |
| |
2 |
Non-recurring items primarily consists of $10 million of severance costs arising from the closure of our Golden Sunlight mine and $47 million of costs (net of
non-controlling interest) arising from a change in our supplies inventory obsolescence provision. These costs are not indicative of our cost of production and as a result have been excluded from the calculation of cash costs. |
| |
3 |
Amounts represent our share of capital expenditures. |
| |
4 |
Total production costs, cash costs, all-in sustaining costs, and all-in costs per ounce may not calculate based on amounts presented in this table due to
rounding. |
| |
5 |
Amounts presented on a co-product basis remove the impact of other metal sales (net of non-controlling interest) from cost per ounce calculations that are
produced as a by-product of our gold production. |
|
|
|
|
|
| BARRICK THIRD QUARTER 2015 |
|
54 |
|
MANAGEMENT’S DISCUSSION AND ANALYSIS |
|
|
|
|
|
|
|
|
|
|
|
|
|
|
|
|
|
|
|
| ($ millions, except per ounce information in dollars) |
|
For the three months ended
September 30 |
|
|
For the nine months ended
September 30 |
|
| |
|
| |
|
|
|
2015 |
|
|
2014 |
|
|
2015 |
|
|
2014 |
|
| |
|
|
|
References |
|
|
|
|
|
|
|
|
|
|
|
|
|
|
|
|
| A |
|
Cost of sales - gold |
|
|
|
|
|
|
|
|
|
|
|
|
|
|
|
|
|
|
Cost of sales (statement of
income) |
|
|
$ 1,742 |
|
|
|
$ 1,681 |
|
|
|
$ 5,139 |
|
|
|
$ 5,031 |
|
|
|
Less: cost of sales - copper |
|
|
(210) |
|
|
|
(229) |
|
|
|
(698) |
|
|
|
(679) |
|
|
|
Direct mining, royalties and community
relations |
|
|
192 |
|
|
|
182 |
|
|
|
618 |
|
|
|
566 |
|
|
|
Depreciation |
|
|
18 |
|
|
|
49 |
|
|
|
80 |
|
|
|
118 |
|
|
|
Hedge gains |
|
|
- |
|
|
|
(2) |
|
|
|
- |
|
|
|
(5) |
|
|
|
Less: cost of sales - non-operating
sites |
|
|
- |
|
|
|
(2) |
|
|
|
- |
|
|
|
(7) |
|
|
|
Less: cost of sales - corporate |
|
|
(43) |
|
|
|
(15) |
|
|
|
(118) |
|
|
|
(59) |
|
|
|
|
|
|
|
Total Cost of Sales - Gold |
|
|
$ 1,489 |
|
|
|
1,435 |
|
|
|
$ 4,323 |
|
|
|
4,286 |
|
|
|
|
|
|
|
|
|
|
|
| B |
|
Cost of sales applicable to non-controlling interests |
|
|
|
|
|
|
|
|
|
|
|
|
|
|
|
|
|
|
Cost of sales applicable to Acacia (Note
5) |
|
|
|
|
|
|
|
|
|
|
|
|
|
|
|
|
|
|
Direct mining, royalties and community
relations |
|
|
$ 141 |
|
|
|
$ 137 |
|
|
|
$ 435 |
|
|
|
$ 406 |
|
|
|
Depreciation |
|
|
32 |
|
|
|
29 |
|
|
|
99 |
|
|
|
94 |
|
|
|
|
|
|
|
Total related to Acacia |
|
|
$ 173 |
|
|
|
$ 166 |
|
|
|
$ 534 |
|
|
|
$ 500 |
|
|
|
|
|
|
|
Portion attributable to non-controlling
interest |
|
|
$ 60 |
|
|
|
$ 55 |
|
|
|
$ 184 |
|
|
|
$ 160 |
|
|
|
|
|
|
|
Cost of sales applicable to Pueblo Viejo
(Note 5) |
|
|
|
|
|
|
|
|
|
|
|
|
|
|
|
|
|
|
Direct mining, royalties and community
relations |
|
|
$ 169 |
|
|
|
$ 165 |
|
|
|
$ 485 |
|
|
|
$ 486 |
|
|
|
Depreciation |
|
|
83 |
|
|
|
67 |
|
|
|
222 |
|
|
|
187 |
|
|
|
|
|
|
|
Total related to Pueblo Viejo |
|
|
$ 252 |
|
|
|
$ 232 |
|
|
|
$ 707 |
|
|
|
$ 673 |
|
|
|
|
|
|
|
Portion attributable to non-controlling
interest |
|
|
$92 |
|
|
|
$75 |
|
|
|
$262 |
|
|
|
$222 |
|
|
|
|
|
|
|
Cost of sales applicable to
non-controlling interests |
|
|
$ 152 |
|
|
|
$ 130 |
|
|
|
$ 446 |
|
|
|
$ 382 |
|
|
|
|
|
|
|
|
|
|
|
| C |
|
Cost of sales applicable to power sales |
|
|
|
|
|
|
|
|
|
|
|
|
|
|
|
|
|
|
|
|
Equal to the cost of sales related to power sales from our Pueblo Viejo mine that are included in consolidated costs of sales but
excluded from cash costs. These figures cannot be tied directly to the financial statements or notes. |
|
|
|
|
|
|
|
| D |
|
Other metal sales |
|
|
|
|
|
|
|
|
|
|
|
|
|
|
|
|
|
|
|
|
By-product revenues from metals produced in conjunction with gold are deducted from the costs incurred to produce gold (Note 6). By
product revenues from metals produced net of copper, power revenues and non-controlling interest for the three and nine months ended September 30, 2015 were $26 million and $84 million, respectively (2014: $32 million and $105 million,
respectively). |
|
|
|
|
|
|
|
| E |
|
Realized gains/losses on hedge and non-hedge |
|
|
|
|
|
|
|
|
|
|
|
|
|
|
|
|
|
|
Realized (gains)/Losses on non-hedge
derivatives |
|
|
$ 9 |
|
|
|
($3) |
|
|
|
$ 12 |
|
|
|
($ 12) |
|
|
|
Realized (gains)/losses on hedge
derivatives |
|
|
21 |
|
|
|
- |
|
|
|
66 |
|
|
|
- |
|
|
|
|
|
|
|
Realized (gains)/losses on hedge and
non-hedge |
|
|
$ 30 |
|
|
|
($3) |
|
|
|
$ 78 |
|
|
|
($ 12) |
|
|
|
|
|
|
|
|
|
|
|
| F |
|
Treatment and refinement charges |
|
|
|
|
|
|
|
|
|
|
|
|
|
|
|
|
|
|
|
|
Treatment and refinement charges, which are recorded against concentrate revenues, for the three and nine months ended
September 30, 2015 were $3 million and $10 million, respectively (2014: $4 million and $8 million, respectively). |
|
|
|
|
|
|
| BARRICK THIRD QUARTER 2015 |
|
55 |
|
MANAGEMENT’S DISCUSSION AND ANALYSIS |
|
|
|
|
|
|
|
|
|
|
|
|
|
|
|
|
|
|
|
| |
|
|
|
For the three months ended |
|
|
For the nine months ended |
|
| ($ millions, except per ounce information in dollars) |
|
September 30 |
|
|
September 30 |
|
| |
|
| |
|
|
|
2015 |
|
|
2014 |
|
|
2015 |
|
|
2014 |
|
| |
|
| G |
|
Depreciation - gold |
|
|
|
|
|
|
|
|
|
|
|
|
|
|
|
|
|
|
Depreciation (Note 7) |
|
|
$ 432 |
|
|
|
$ 412 |
|
|
|
$ 1,272 |
|
|
|
$ 1,214 |
|
|
|
Less: copper depreciation |
|
|
(18) |
|
|
|
(49) |
|
|
|
(80) |
|
|
|
(118) |
|
|
|
Less: NCI portion
|
|
|
(48) |
|
|
|
(36) |
|
|
|
(130) |
|
|
|
(105) |
|
|
|
Less: Depreciation- corporate assets |
|
|
(17) |
|
|
|
(15) |
|
|
|
(45) |
|
|
|
(56) |
|
|
|
|
|
|
|
Total depreciation - gold |
|
|
$ 349 |
|
|
|
$ 312 |
|
|
|
$ 1,017 |
|
|
|
$ 935 |
|
|
|
|
|
| H |
|
General & administrative costs |
|
|
|
|
|
|
|
|
|
|
|
|
|
|
|
|
|
|
Total general & administrative
costs (statement of income) |
|
|
$ 44 |
|
|
|
$ 98 |
|
|
|
$ 181 |
|
|
|
$ 283 |
|
|
|
Less: non-gold and non-operating
general & administrative costs |
|
|
(10) |
|
|
|
(16) |
|
|
|
(22) |
|
|
|
(42) |
|
|
|
Less: NCI portion |
|
|
(2) |
|
|
|
(3) |
|
|
|
(12) |
|
|
|
(10) |
|
|
|
Add: World Gold Council fees |
|
|
- |
|
|
|
1 |
|
|
|
- |
|
|
|
3 |
|
|
|
Less: non-recurring items |
|
|
(11) |
|
|
|
(14) |
|
|
|
(14) |
|
|
|
(15) |
|
|
|
|
|
|
|
Total general & administrative
costs |
|
|
$ 21 |
|
|
|
$ 66 |
|
|
|
$ 133 |
|
|
|
$ 219 |
|
|
|
|
|
| I |
|
Rehabilitation - accretion and amortization |
|
|
|
|
|
|
|
|
|
|
|
|
|
|
|
|
|
|
Includes depreciation (Note 7) on the assets
related to rehabilitation provisions of our gold operations of $27 million and $78 million for the three and nine months ended September 30, 2015, respectively (2014: $17 million and $55 million, respectively) and accretion (Note 11) on the
rehabilitation provision of our gold operations of $14 million and $41 million for the three and nine months ended September 30, 2015, respectively (2014: $16 million and $51 million, respectively). |
|
| J |
|
Exploration and evaluation costs |
|
|
|
|
|
|
|
|
|
|
|
|
|
|
|
|
|
|
Exploration and evaluation costs
(Note 8) |
|
|
$ 31 |
|
|
|
$ 45 |
|
|
|
$ 128 |
|
|
|
$ 130 |
|
|
|
Less: exploration and evaluation
costs - non-gold & NCI |
|
|
(2) |
|
|
|
(2) |
|
|
|
(8) |
|
|
|
(7) |
|
|
|
|
|
|
|
Total exploration and evaluation
costs - gold |
|
|
$ 29 |
|
|
|
$ 43 |
|
|
|
$ 120 |
|
|
|
$ 123 |
|
|
|
|
|
|
|
Exploration & evaluation costs
(sustaining) |
|
|
9 |
|
|
|
6 |
|
|
|
31 |
|
|
|
15 |
|
|
|
Exploration and evaluation costs
(non-sustaining) |
|
|
20 |
|
|
|
37 |
|
|
|
89 |
|
|
|
108 |
|
|
|
|
|
|
|
Total exploration and evaluation
costs - gold |
|
|
$ 29 |
|
|
|
$ 43 |
|
|
|
$ 120 |
|
|
|
$ 123 |
|
|
|
|
|
| K |
|
Capital expenditures |
|
|
|
|
|
|
|
|
|
|
|
|
|
|
|
|
|
|
Gold segments (Note 5) |
|
|
$ 288 |
|
|
|
$ 445 |
|
|
|
$ 1,040 |
|
|
|
$ 1,265 |
|
|
|
Pascua-Lama operating unit (Note
5) |
|
|
- |
|
|
|
61 |
|
|
|
- |
|
|
|
92 |
|
|
|
Other gold projects |
|
|
35 |
|
|
|
8 |
|
|
|
82 |
|
|
|
25 |
|
|
|
|
|
|
|
Capital expenditures - gold |
|
|
$ 323 |
|
|
|
$ 514 |
|
|
|
$ 1,122 |
|
|
|
$ 1,382 |
|
|
|
|
|
|
|
Less: NCI portion |
|
|
(30) |
|
|
|
(41) |
|
|
|
(81) |
|
|
|
(112) |
|
|
|
Less: capitalized interest (Note
11) |
|
|
- |
|
|
|
(8) |
|
|
|
(17) |
|
|
|
(22) |
|
|
|
|
|
|
|
Total capital expenditures -
gold |
|
|
$ 293 |
|
|
|
$ 465 |
|
|
|
$ 1,024 |
|
|
|
$ 1,248 |
|
|
|
|
|
|
|
Mine development
expenditures |
|
|
131 |
|
|
|
149 |
|
|
|
461 |
|
|
|
514 |
|
|
|
Sustaining capital
expenditures |
|
|
122 |
|
|
|
137 |
|
|
|
381 |
|
|
|
361 |
|
|
|
Non-sustaining capital
expenditures |
|
|
40 |
|
|
|
179 |
|
|
|
182 |
|
|
|
373 |
|
|
|
|
|
|
|
Total capital expenditures -
gold |
|
|
$ 293 |
|
|
|
$ 465 |
|
|
|
$ 1,024 |
|
|
|
$ 1,248 |
|
|
|
|
|
| L |
|
Community relations costs |
|
|
|
|
|
|
|
|
|
|
|
|
|
|
|
|
|
|
Community relations costs (Note
7) |
|
|
$ 21 |
|
|
|
$ 19 |
|
|
|
$ 49 |
|
|
|
$ 52 |
|
|
|
Less: community relations costs
relating to current operations |
|
|
(16) |
|
|
|
(16) |
|
|
|
(37) |
|
|
|
(37) |
|
|
|
|
|
|
|
Community relations costs not related
to current operations |
|
|
$ 5 |
|
|
|
$ 3 |
|
|
|
$ 12 |
|
|
|
$ 15 |
|
|
|
|
|
|
|
|
|
|
| BARRICK THIRD QUARTER 2015 |
|
56 |
|
MANAGEMENT’S DISCUSSION AND ANALYSIS |
Reconciliation of Copper Cost of Sales to C1 cash costs per pound and C3 fully allocated costs per pound
|
|
|
|
|
|
|
|
|
|
|
|
|
|
|
|
|
| ($ millions, except per pound information in dollars) |
|
For the three months ended September 30 |
|
|
For the nine months ended September 30 |
|
| |
|
| |
|
2015 |
|
|
2014 |
|
|
2015 |
|
|
2014 |
|
| |
|
| Cost of sales |
|
|
$ 210 |
|
|
|
$ 231 |
|
|
|
$ 698 |
|
|
|
$ 682 |
|
| Depreciation/amortization |
|
|
(18) |
|
|
|
(49) |
|
|
|
(80) |
|
|
|
(118) |
|
| Treatment and refinement
charges |
|
|
46 |
|
|
|
32 |
|
|
|
129 |
|
|
|
78 |
|
| Less: royalties |
|
|
(15) |
|
|
|
(8) |
|
|
|
(85) |
|
|
|
(25) |
|
| Non-routine charges |
|
|
- |
|
|
|
- |
|
|
|
- |
|
|
|
(1) |
|
| Other metal sales |
|
|
- |
|
|
|
- |
|
|
|
- |
|
|
|
(1) |
|
| Other1 |
|
|
- |
|
|
|
- |
|
|
|
- |
|
|
|
(26) |
|
| |
|
| C1 cash cost of sales |
|
|
$ 223 |
|
|
|
$ 206 |
|
|
|
$ 662 |
|
|
|
$ 589 |
|
| |
|
| Depreciation/amortization |
|
|
18 |
|
|
|
49 |
|
|
|
80 |
|
|
|
118 |
|
| Royalties |
|
|
15 |
|
|
|
8 |
|
|
|
85 |
|
|
|
25 |
|
| Non-routine charges |
|
|
- |
|
|
|
- |
|
|
|
- |
|
|
|
1 |
|
| Other expense (income) |
|
|
(39) |
|
|
|
3 |
|
|
|
(46) |
|
|
|
6 |
|
| |
|
| C3 fully allocated cost of
sales |
|
|
$ 217 |
|
|
|
$ 266 |
|
|
|
$ 781 |
|
|
|
$ 739 |
|
| |
|
| Pounds sold - consolidated basis
(millions pounds) |
|
|
145 |
|
|
|
112 |
|
|
|
378 |
|
|
|
296 |
|
| |
|
| C1 cash cost per pound2 |
|
|
$ 1.53 |
|
|
|
$ 1.82 |
|
|
|
$ 1.75 |
|
|
|
$ 1.98 |
|
| |
|
| C3 fully allocated cost per pound2 |
|
|
$ 1.49 |
|
|
|
$ 2.36 |
|
|
|
$ 2.07 |
|
|
|
$ 2.50 |
|
| |
|
| |
1 |
Includes $17 million related to copper cathode purchases and $10 million of abnormal costs related to the conveyor collapse at Lumwana, as these costs are not
indicative of our normal production costs. |
| |
2 |
C1 cash costs per pound and C3 fully allocated costs may not calculate based on amounts presented in this table due to rounding. |
|
|
|
|
|
| BARRICK THIRD QUARTER 2015 |
|
57 |
|
MANAGEMENT’S DISCUSSION AND ANALYSIS |
EBITDA and Adjusted EBITDA
|
|
|
|
|
|
|
|
|
| |
| ($ millions, except per share amounts in dollars) |
|
For the three months ended September 30 |
|
For the nine months ended September 30 |
| |
| |
|
2015 |
|
2014 |
|
2015 |
|
2014 |
| |
| Net earnings (loss) |
|
$ (252) |
|
$177 |
|
$ (172) |
|
$81 |
| Income tax expense |
|
122 |
|
275 |
|
330 |
|
687 |
| Finance costs1 |
|
190 |
|
180 |
|
549 |
|
541 |
| Finance income |
|
(2) |
|
(3) |
|
(6) |
|
(9) |
| Depreciation |
|
432 |
|
412 |
|
1,272 |
|
1,214 |
| |
| EBITDA |
|
$ 490 |
|
$ 1,041 |
|
$ 1,973 |
|
$ 2,514 |
| Impairment charges |
|
452 |
|
18 |
|
492 |
|
542 |
| |
| Adjusted EBITDA |
|
$ 942 |
|
$ 1,059 |
|
$ 2,465 |
|
$ 3,056 |
| |
| Reported as: |
|
|
|
|
|
|
|
|
| |
| Cortez |
|
195 |
|
197 |
|
373 |
|
552 |
| Goldstrike |
|
177 |
|
164 |
|
395 |
|
514 |
| Pueblo Viejo |
|
196 |
|
248 |
|
563 |
|
715 |
| Lagunas Norte |
|
85 |
|
133 |
|
366 |
|
379 |
| Veladero |
|
55 |
|
101 |
|
247 |
|
326 |
| Turquoise Ridge |
|
27 |
|
41 |
|
88 |
|
126 |
| Porgera |
|
52 |
|
58 |
|
134 |
|
133 |
| Kalgoorlie |
|
41 |
|
34 |
|
90 |
|
113 |
| Acacia |
|
39 |
|
92 |
|
175 |
|
247 |
| Zaldívar |
|
47 |
|
83 |
|
131 |
|
226 |
| Lumwana |
|
28 |
|
54 |
|
38 |
|
66 |
| Other |
|
- |
|
(146) |
|
(135) |
|
(341) |
| Impairment charges |
|
(452) |
|
(18) |
|
(492) |
|
(542) |
| |
| EBITDA |
|
$ 490 |
|
$ 1,041 |
|
$ 1,973 |
|
$ 2,514 |
| Impairment charges |
|
452 |
|
18 |
|
492 |
|
542 |
| |
| Adjusted EBITDA |
|
$ 942 |
|
$ 1,059 |
|
$ 2,465 |
|
$ 3,056 |
| |
| |
1 |
Finance costs exclude accretion. |
Reconciliation of Sales to Realized Price per ounce/pound
|
|
|
|
|
|
|
|
|
|
|
|
|
|
|
|
|
|
|
|
|
|
|
|
|
|
|
|
|
|
|
|
|
| |
|
For the three months ended September 30 |
|
|
For the nine months ended September 30 |
|
| |
|
| ($ millions, except per ounce/pound
information in dollars) |
|
Gold |
|
|
Copper |
|
|
Gold |
|
|
Copper |
|
| |
|
| |
|
2015 |
|
|
2014 |
|
|
2015 |
|
|
2014 |
|
|
2015 |
|
|
2014 |
|
|
2015 |
|
|
2014 |
|
| |
|
| Sales |
|
|
$ 1,992 |
|
|
|
$ 2,235 |
|
|
|
$ 269 |
|
|
|
$ 318 |
|
|
|
$ 5,832 |
|
|
|
$ 6,664 |
|
|
|
$793 |
|
|
|
$ 860 |
|
| Sales applicable to non-controlling
interests |
|
|
(210) |
|
|
|
(224) |
|
|
|
- |
|
|
|
- |
|
|
|
(642) |
|
|
|
(650) |
|
|
|
- |
|
|
|
- |
|
| Realized non-hedge gold/copper derivative (losses)
gains |
|
|
- |
|
|
|
1 |
|
|
|
- |
|
|
|
(3) |
|
|
|
- |
|
|
|
1 |
|
|
|
- |
|
|
|
(8) |
|
| Treatment and refinement
charges |
|
|
3 |
|
|
|
4 |
|
|
|
46 |
|
|
|
32 |
|
|
|
10 |
|
|
|
8 |
|
|
|
129 |
|
|
|
78 |
|
| Export duties |
|
|
9 |
|
|
|
12 |
|
|
|
- |
|
|
|
- |
|
|
|
28 |
|
|
|
37 |
|
|
|
- |
|
|
|
- |
|
| Other1 |
|
|
- |
|
|
|
- |
|
|
|
- |
|
|
|
- |
|
|
|
- |
|
|
|
- |
|
|
|
- |
|
|
|
(17) |
|
| |
|
| Revenues - as adjusted |
|
|
$ 1,794 |
|
|
|
$ 2,028 |
|
|
|
$ 315 |
|
|
|
$ 347 |
|
|
|
$ 5,228 |
|
|
|
$ 6,060 |
|
|
|
$922 |
|
|
|
$ 913 |
|
| |
|
| Ounces/pounds sold (000s ounces/millions pounds) |
|
|
1,596 |
|
|
|
1,578 |
|
|
|
145 |
|
|
|
112 |
|
|
|
4,447 |
|
|
|
4,712 |
|
|
|
378 |
|
|
|
296 |
|
| |
|
| Realized gold/copper price per ounce/pound2 |
|
|
$ 1,125 |
|
|
|
$ 1,285 |
|
|
|
$2.18 |
|
|
|
$ 3.09 |
|
|
|
$1,176 |
|
|
|
$ 1,286 |
|
|
|
$ 2.44 |
|
|
|
$ 3.08 |
|
| |
|
| |
1 |
Revenue related to copper cathode purchases made in second quarter 2014. |
| |
2 |
Realized price per ounce/pound may not calculate based on amounts presented in this table due to rounding. |
|
|
|
|
|
| BARRICK THIRD QUARTER 2015 |
|
58 |
|
MANAGEMENT’S DISCUSSION AND ANALYSIS |
Consolidated Statements of Income
|
|
|
|
|
|
|
|
|
|
|
|
|
|
|
|
|
| Barrick Gold Corporation (in millions of United States dollars,
except per share data) (Unaudited) |
|
Three months ended
September 30, |
|
|
Nine months ended
September 30, |
|
| |
|
| |
|
2015 |
|
|
2014 |
|
|
2015 |
|
|
2014 |
|
| |
|
|
|
|
|
|
| Revenue (notes 5 and 6) |
|
$ |
2,315 |
|
|
$ |
2,624 |
|
|
$ |
6,791 |
|
|
$ |
7,729 |
|
| |
|
| Costs and expenses (income) |
|
|
|
|
|
|
|
|
|
|
|
|
|
|
|
|
| Cost of sales (notes 5 and 7) |
|
|
1,742 |
|
|
|
1,681 |
|
|
|
5,139 |
|
|
|
5,031 |
|
| General and administrative expenses |
|
|
44 |
|
|
|
98 |
|
|
|
181 |
|
|
|
283 |
|
| Exploration, evaluation and project expenses (note 8) |
|
|
86 |
|
|
|
102 |
|
|
|
269 |
|
|
|
307 |
|
| Impairment charges (note 10B) |
|
|
452 |
|
|
|
18 |
|
|
|
492 |
|
|
|
542 |
|
| Loss (gain) on currency translation |
|
|
(43) |
|
|
|
30 |
|
|
|
(12) |
|
|
|
140 |
|
| Closed mine rehabilitation |
|
|
(8) |
|
|
|
(4) |
|
|
|
(19) |
|
|
|
45 |
|
| Loss on non-hedge derivatives (note 19D) |
|
|
12 |
|
|
|
65 |
|
|
|
23 |
|
|
|
- |
|
| Other expense (income) (note 10A) |
|
|
(45) |
|
|
|
(13) |
|
|
|
(31) |
|
|
|
23 |
|
| |
|
| Income before finance items and income taxes |
|
$ |
75 |
|
|
$ |
647 |
|
|
$ |
749 |
|
|
$ |
1,358 |
|
| Finance items |
|
|
|
|
|
|
|
|
|
|
|
|
|
|
|
|
| Finance income |
|
|
2 |
|
|
|
3 |
|
|
|
6 |
|
|
|
9 |
|
| Finance costs (note 11) |
|
|
(207) |
|
|
|
(198) |
|
|
|
(597) |
|
|
|
(599) |
|
| |
|
| Income (loss) before income taxes |
|
$ |
(130) |
|
|
$ |
452 |
|
|
$ |
158 |
|
|
$ |
768 |
|
| Income tax expense (note 12) |
|
|
(122) |
|
|
|
(275) |
|
|
|
(330) |
|
|
|
(687) |
|
| |
|
| Net income (loss) |
|
$ |
(252) |
|
|
$ |
177 |
|
|
$ |
(172) |
|
|
$ |
81 |
|
| |
|
| Attributable to: |
|
|
|
|
|
|
|
|
|
|
|
|
|
|
|
|
| Equity holders of Barrick Gold Corporation |
|
$ |
(264) |
|
|
$ |
125 |
|
|
$ |
(216) |
|
|
$ |
(56) |
|
| Non-controlling interests (note 22) |
|
$ |
12 |
|
|
$ |
52 |
|
|
$ |
44 |
|
|
$ |
137 |
|
| |
|
|
| Earnings (loss) per share data attributable to the equity holders of Barrick Gold Corporation (note 9) |
|
| Net income (loss) |
|
|
|
|
|
|
|
|
|
|
|
|
|
|
|
|
| Basic |
|
$ |
(0.23) |
|
|
$ |
0.11 |
|
|
$ |
(0.19) |
|
|
$ |
(0.05) |
|
| Diluted |
|
$ |
(0.23) |
|
|
$ |
0.11 |
|
|
$ |
(0.19) |
|
|
$ |
(0.05) |
|
| |
|
The accompanying notes are an integral part of these consolidated financial statements.
|
|
|
|
|
| BARRICK THIRD QUARTER 2015 |
|
59 |
|
FINANCIAL STATEMENTS (UNAUDITED) |
Consolidated Statements of Comprehensive Income
|
|
|
|
|
|
|
|
|
|
|
|
|
|
|
|
|
| Barrick Gold Corporation
(in millions of United States dollars) (Unaudited) |
|
Three months ended
September 30, |
|
|
Nine months ended
September 30, |
|
| |
|
| |
|
2015 |
|
|
2014 |
|
|
2015 |
|
|
2014 |
|
| |
|
| Net income (loss) |
|
$ |
(252) |
|
|
$ |
177 |
|
|
$ |
(172) |
|
|
$ |
81 |
|
| Other comprehensive income (loss), net of taxes |
|
|
|
|
|
|
|
|
|
|
|
|
|
|
|
|
|
|
|
|
|
| Movement in equity investments fair value reserve: |
|
|
|
|
|
|
|
|
|
|
|
|
|
|
|
|
| Net unrealized change on equity investments, net of tax $nil, $nil, $nil and $nil |
|
|
(3) |
|
|
|
(2) |
|
|
|
(14) |
|
|
|
20 |
|
| Net realized change on equity investments, net of tax $nil, $nil, $nil and $nil |
|
|
- |
|
|
|
(7) |
|
|
|
18 |
|
|
|
- |
|
| Impairment losses on equity investments, net of tax $nil, $nil, $nil and $nil |
|
|
- |
|
|
|
- |
|
|
|
- |
|
|
|
16 |
|
|
|
|
|
|
| Items that may be reclassified subsequently to profit or loss: |
|
|
|
|
|
|
|
|
|
|
|
|
|
|
|
|
| Unrealized gains (losses) on derivatives designated as cash flow hedges, net of tax $30, $2, $31 and $3 |
|
|
(74) |
|
|
|
(35) |
|
|
|
(107) |
|
|
|
(7) |
|
| Realized (gains) losses on derivatives designated as cash flow hedges, net of tax ($8), ($1), ($8) and $nil |
|
|
15 |
|
|
|
(22) |
|
|
|
66 |
|
|
|
(76) |
|
| Currency translation adjustments, net of tax $nil, $nil, $nil and $nil |
|
|
(46) |
|
|
|
(26) |
|
|
|
(76) |
|
|
|
(19) |
|
| |
|
| Total other comprehensive income (loss) |
|
|
(108) |
|
|
|
(92) |
|
|
|
(113) |
|
|
|
(66) |
|
| |
|
| Total comprehensive income (loss) |
|
$ |
(360) |
|
|
$ |
85 |
|
|
$ |
(285) |
|
|
$ |
15 |
|
| |
|
| Attributable to: |
|
|
|
|
|
|
|
|
|
|
|
|
|
|
|
|
| Equity holders of Barrick Gold Corporation |
|
$ |
(372) |
|
|
$ |
33 |
|
|
$ |
(329) |
|
|
$ |
(122) |
|
| Non-controlling interests |
|
$ |
12 |
|
|
$ |
52 |
|
|
$ |
44 |
|
|
$ |
137 |
|
| |
|
The accompanying notes are an integral part of these consolidated financial statements.
|
|
|
|
|
| BARRICK THIRD QUARTER 2015 |
|
60 |
|
FINANCIAL STATEMENTS (UNAUDITED) |
Consolidated Statements of Cash Flow
|
|
|
|
|
|
|
|
|
|
|
|
|
|
|
|
|
| Barrick Gold Corporation |
|
Three months ended |
|
|
Nine months ended |
|
| (in millions of United States dollars) (Unaudited) |
|
September 30, |
|
|
September 30, |
|
| |
|
| |
|
2015 |
|
|
2014 |
|
|
2015 |
|
|
2014 |
|
| |
|
| OPERATING ACTIVITIES |
|
|
|
|
|
|
|
|
|
|
|
|
|
|
|
|
| Net income (loss) |
|
$ |
(252) |
|
|
$ |
177 |
|
|
$ |
(172) |
|
|
$ |
81 |
|
| Adjusted for the following items: |
|
|
|
|
|
|
|
|
|
|
|
|
|
|
|
|
| Depreciation |
|
|
432 |
|
|
|
412 |
|
|
|
1,272 |
|
|
|
1,214 |
|
| Finance costs |
|
|
207 |
|
|
|
198 |
|
|
|
597 |
|
|
|
599 |
|
| Impairment charges (note 10B) |
|
|
452 |
|
|
|
18 |
|
|
|
492 |
|
|
|
542 |
|
| Income tax expense (note 12) |
|
|
122 |
|
|
|
275 |
|
|
|
330 |
|
|
|
687 |
|
| (Increase) decrease in inventory |
|
|
48 |
|
|
|
(12) |
|
|
|
(17) |
|
|
|
(7) |
|
| Loss on non-hedge derivatives |
|
|
12 |
|
|
|
65 |
|
|
|
23 |
|
|
|
- |
|
| Gain on sale of long-lived assets |
|
|
(54) |
|
|
|
(14) |
|
|
|
(80) |
|
|
|
(37) |
|
| Deposit on gold and silver streaming agreement |
|
|
610 |
|
|
|
- |
|
|
|
610 |
|
|
|
- |
|
| Other operating activities (note 13A) |
|
|
(152) |
|
|
|
(120) |
|
|
|
(240) |
|
|
|
(345) |
|
| |
|
| Operating cash flows before interest and income taxes |
|
|
1,425 |
|
|
|
999 |
|
|
|
2,815 |
|
|
|
2,734 |
|
| Interest paid |
|
|
(86) |
|
|
|
(77) |
|
|
|
(435) |
|
|
|
(429) |
|
| Income taxes paid |
|
|
(84) |
|
|
|
(70) |
|
|
|
(284) |
|
|
|
(380) |
|
| |
|
| Net cash provided by operating activities |
|
|
1,255 |
|
|
|
852 |
|
|
|
2,096 |
|
|
|
1,925 |
|
| |
|
| INVESTING ACTIVITIES |
|
|
|
|
|
|
|
|
|
|
|
|
|
|
|
|
| Property, plant and equipment |
|
|
|
|
|
|
|
|
|
|
|
|
|
|
|
|
| Capital expenditures (note 5) |
|
|
(389) |
|
|
|
(653) |
|
|
|
(1,402) |
|
|
|
(1,885) |
|
| Sales proceeds |
|
|
8 |
|
|
|
18 |
|
|
|
27 |
|
|
|
55 |
|
| Divestitures (note 4) |
|
|
842 |
|
|
|
- |
|
|
|
844 |
|
|
|
166 |
|
| Investments sales |
|
|
- |
|
|
|
67 |
|
|
|
33 |
|
|
|
119 |
|
| Other investing activities (note 13B) |
|
|
(3) |
|
|
|
(2) |
|
|
|
(10) |
|
|
|
(81) |
|
| |
|
| Net cash (used in) provided by investing activities |
|
|
458 |
|
|
|
(570) |
|
|
|
(508) |
|
|
|
(1,626) |
|
| |
|
| FINANCING ACTIVITIES |
|
|
|
|
|
|
|
|
|
|
|
|
|
|
|
|
| Proceeds from divestment of 10% of issued ordinary share capital of Acacia |
|
|
- |
|
|
|
- |
|
|
|
- |
|
|
|
186 |
|
| Debt |
|
|
|
|
|
|
|
|
|
|
|
|
|
|
|
|
| Proceeds |
|
|
1 |
|
|
|
6 |
|
|
|
6 |
|
|
|
139 |
|
| Repayments |
|
|
(493) |
|
|
|
(71) |
|
|
|
(765) |
|
|
|
(164) |
|
| Dividends |
|
|
(23) |
|
|
|
(59) |
|
|
|
(139) |
|
|
|
(175) |
|
| Funding from non-controlling interests |
|
|
10 |
|
|
|
2 |
|
|
|
32 |
|
|
|
4 |
|
| Disbursements to non-controlling interests |
|
|
(26) |
|
|
|
- |
|
|
|
(90) |
|
|
|
- |
|
| |
|
| Net cash used in by financing activities |
|
|
(531) |
|
|
|
(122) |
|
|
|
(956) |
|
|
|
(10) |
|
| |
|
| Effect of exchange rate changes on cash and equivalents |
|
|
(5) |
|
|
|
(4) |
|
|
|
(12) |
|
|
|
(8) |
|
| |
|
| Net increase in cash and equivalents |
|
|
1,177 |
|
|
|
156 |
|
|
|
620 |
|
|
|
281 |
|
| Cash and equivalents excluding assets classified as held for sale at the beginning of period |
|
|
2,122 |
|
|
|
2,549 |
|
|
|
2,699 |
|
|
|
2,404 |
|
| Add: cash and equivalents of assets classified as held for sale at the beginning of period |
|
|
20 |
|
|
|
- |
|
|
|
- |
|
|
|
20 |
|
| |
|
| Cash and equivalents at the end of period |
|
$ |
3,319 |
|
|
$ |
2,705 |
|
|
$ |
3,319 |
|
|
$ |
2,705 |
|
| |
|
| Less: cash and equivalents of assets classified as held for sale at the end of period |
|
|
2 |
|
|
|
- |
|
|
|
2 |
|
|
|
- |
|
| |
|
| Cash and equivalents excluding assets classified as held for sale at the end of period |
|
$ |
3,317 |
|
|
$ |
2,705 |
|
|
$ |
3,317 |
|
|
$ |
2,705 |
|
| |
|
The accompanying notes are an integral part of these consolidated financial statements.
|
|
|
|
|
| BARRICK THIRD QUARTER 2015 |
|
61 |
|
FINANCIAL STATEMENTS (UNAUDITED) |
Consolidated Balance Sheets
|
|
|
|
|
|
|
|
|
| Barrick Gold Corporation
(in millions of United States dollars) (Unaudited) |
|
As at September 30, |
|
|
As at December 31, |
|
| |
|
| |
|
2015 |
|
|
2014 |
|
| |
|
| ASSETS |
|
|
|
|
|
|
|
|
| Current assets |
|
|
|
|
|
|
|
|
| Cash and equivalents (note 19A) |
|
$ |
3,317 |
|
|
$ |
2,699 |
|
| Accounts receivable |
|
|
291 |
|
|
|
418 |
|
| Inventories (note 15) |
|
|
2,006 |
|
|
|
2,722 |
|
| Other current assets |
|
|
276 |
|
|
|
311 |
|
| |
|
| Total current assets (excluding assets classified as held for sale) |
|
$ |
5,890 |
|
|
$ |
6,150 |
|
| Assets classified as held for sale (note 4A) |
|
|
2,570 |
|
|
|
- |
|
| |
|
| Total current assets |
|
$ |
8,460 |
|
|
$ |
6,150 |
|
|
|
|
| Non-current assets |
|
|
|
|
|
|
|
|
| Equity in investees (note 14) |
|
|
208 |
|
|
|
206 |
|
| Other investments |
|
|
8 |
|
|
|
35 |
|
| Property, plant and equipment (note 16) |
|
|
17,150 |
|
|
|
19,193 |
|
| Goodwill |
|
|
3,115 |
|
|
|
4,426 |
|
| Intangible assets |
|
|
273 |
|
|
|
308 |
|
| Deferred income tax assets |
|
|
549 |
|
|
|
674 |
|
| Non-current portion of inventory (note 15) |
|
|
1,482 |
|
|
|
1,684 |
|
| Other assets |
|
|
1,152 |
|
|
|
1,203 |
|
| |
|
| Total assets |
|
$ |
32,397 |
|
|
$ |
33,879 |
|
| |
|
| LIABILITIES AND EQUITY |
|
|
|
|
|
|
|
|
| Current liabilities |
|
|
|
|
|
|
|
|
| Accounts payable |
|
$ |
1,322 |
|
|
$ |
1,653 |
|
| Debt (note 19B) |
|
|
1,038 |
|
|
|
333 |
|
| Current income tax liabilities |
|
|
1 |
|
|
|
84 |
|
| Other current liabilities |
|
|
414 |
|
|
|
490 |
|
| |
|
| Total current liabilities (excluding liabilities classified as held for sale) |
|
$ |
2,775 |
|
|
$ |
2,560 |
|
| Liabilities classified as held for sale (note 4A) |
|
|
571 |
|
|
|
- |
|
| |
|
| Total current liabilities |
|
$ |
3,346 |
|
|
$ |
2,560 |
|
|
|
|
| Non-current liabilities |
|
|
|
|
|
|
|
|
| Debt (note 19B) |
|
|
11,283 |
|
|
|
12,748 |
|
| Provisions |
|
|
2,302 |
|
|
|
2,561 |
|
| Deferred income tax liabilities |
|
|
1,500 |
|
|
|
2,036 |
|
| Other liabilities |
|
|
1,594 |
|
|
|
1,112 |
|
| |
|
| Total liabilities |
|
$ |
20,025 |
|
|
$ |
21,017 |
|
| |
|
| Equity |
|
|
|
|
|
|
|
|
| Capital stock (note 21) |
|
$ |
20,866 |
|
|
$ |
20,864 |
|
| Deficit |
|
|
(11,001) |
|
|
|
(10,739) |
|
| Accumulated other comprehensive loss |
|
|
(411) |
|
|
|
(199) |
|
| Other |
|
|
321 |
|
|
|
321 |
|
| |
|
| Total equity attributable to Barrick Gold Corporation shareholders |
|
$ |
9,775 |
|
|
$ |
10,247 |
|
| Non-controlling interests (note 22) |
|
|
2,597 |
|
|
|
2,615 |
|
| |
|
| Total equity |
|
$ |
12,372 |
|
|
$ |
12,862 |
|
| |
|
| Contingencies and commitments (notes 15, 16 and 23) |
|
|
|
|
|
|
|
|
| |
|
| Total liabilities and equity |
|
$ |
32,397 |
|
|
$ |
33,879 |
|
| |
|
The accompanying notes are an integral part of these consolidated financial statements.
|
|
|
|
|
| BARRICK THIRD QUARTER 2015 |
|
62 |
|
FINANCIAL STATEMENTS (UNAUDITED) |
Consolidated Statements of Changes in Equity
|
|
|
|
|
|
|
|
|
|
|
|
|
|
|
|
|
|
|
|
|
|
|
|
|
|
|
|
|
|
|
|
|
|
|
|
|
|
|
|
|
|
|
|
|
|
|
|
|
|
| Barrick Gold Corporation |
|
|
|
|
Attributable to equity holders of the company |
|
|
|
|
|
|
|
| |
|
(in millions of United States dollars)
(Unaudited) |
|
Common Shares
(in thousands) |
|
|
Capital stock |
|
|
Retained
deficit |
|
|
Accumulated
other
comprehensive
income (loss)1 |
|
|
Other2 |
|
|
Total equity
attributable to
shareholders |
|
|
Non-controlling
interests |
|
|
Total equity |
|
| |
|
| At December 31, 2014 |
|
|
1,164,670 |
|
|
$ |
20,864 |
|
|
$ |
(10,739) |
|
|
$ |
(199) |
|
|
$ |
321 |
|
|
$ |
10,247 |
|
|
$ |
2,615 |
|
|
$ |
12,862 |
|
| |
|
| Impact of adopting IFRS 9 on January 1, 2015 (note 2B) |
|
|
- |
|
|
|
- |
|
|
|
99 |
|
|
|
(99) |
|
|
|
- |
|
|
|
- |
|
|
|
- |
|
|
|
- |
|
| |
|
| At January 1, 2015 (restated) |
|
|
1,164,670 |
|
|
$ |
20,864 |
|
|
$ |
(10,640) |
|
|
$ |
(298) |
|
|
$ |
321 |
|
|
$ |
10,247 |
|
|
$ |
2,615 |
|
|
$ |
12,862 |
|
| |
|
| Net income |
|
|
- |
|
|
|
- |
|
|
|
(216) |
|
|
|
- |
|
|
|
- |
|
|
|
(216) |
|
|
|
44 |
|
|
|
(172) |
|
| Total other comprehensive loss |
|
|
- |
|
|
|
- |
|
|
|
- |
|
|
|
(113) |
|
|
|
- |
|
|
|
(113) |
|
|
|
- |
|
|
|
(113) |
|
| |
|
| Total comprehensive income (loss) |
|
|
- |
|
|
|
- |
|
|
|
(216) |
|
|
|
(113) |
|
|
|
- |
|
|
|
(329) |
|
|
|
44 |
|
|
|
(285) |
|
| |
|
| Transactions with owners |
|
|
|
|
|
|
|
|
|
|
|
|
|
|
|
|
|
|
|
|
|
|
|
|
|
|
|
|
|
|
|
|
| Dividends |
|
|
- |
|
|
|
- |
|
|
|
(139) |
|
|
|
- |
|
|
|
- |
|
|
|
(139) |
|
|
|
- |
|
|
|
(139) |
|
| Recognition of stock option expense |
|
|
- |
|
|
|
2 |
|
|
|
- |
|
|
|
- |
|
|
|
- |
|
|
|
2 |
|
|
|
- |
|
|
|
2 |
|
| Funding from non-controlling interests |
|
|
- |
|
|
|
- |
|
|
|
- |
|
|
|
- |
|
|
|
- |
|
|
|
- |
|
|
|
33 |
|
|
|
33 |
|
| Other decrease in non-controlling interest |
|
|
- |
|
|
|
- |
|
|
|
- |
|
|
|
- |
|
|
|
- |
|
|
|
- |
|
|
|
(95) |
|
|
|
(95) |
|
| Dividend reinvestment plan (note 21) |
|
|
127 |
|
|
|
- |
|
|
|
- |
|
|
|
- |
|
|
|
- |
|
|
|
- |
|
|
|
- |
|
|
|
- |
|
| Other decreases |
|
|
- |
|
|
|
- |
|
|
|
(6) |
|
|
|
- |
|
|
|
- |
|
|
|
(6) |
|
|
|
- |
|
|
|
(6) |
|
| |
|
| Total transactions with owners |
|
|
127 |
|
|
|
2 |
|
|
|
(145) |
|
|
|
- |
|
|
|
- |
|
|
|
(143) |
|
|
|
(62) |
|
|
|
(205) |
|
| |
|
| At September 30, 2015 |
|
|
1,164,797 |
|
|
$ |
20,866 |
|
|
$ |
(11,001) |
|
|
$ |
(411) |
|
|
$ |
321 |
|
|
$ |
9,775 |
|
|
$ |
2,597 |
|
|
$ |
12,372 |
|
| |
|
| |
|
|
|
|
|
|
|
|
|
|
|
|
|
|
|
|
|
|
|
|
|
|
|
|
|
|
|
|
|
|
|
|
| |
|
| At January 1, 2014 |
|
|
1,164,652 |
|
|
$ |
20,869 |
|
|
$ |
(7,581) |
|
|
$ |
(69) |
|
|
$ |
314 |
|
|
$ |
13,533 |
|
|
$ |
2,468 |
|
|
$ |
16,001 |
|
| |
|
| Net income (loss) |
|
|
- |
|
|
|
- |
|
|
|
(56) |
|
|
|
- |
|
|
|
- |
|
|
|
(56) |
|
|
|
137 |
|
|
|
81 |
|
| Total other comprehensive income |
|
|
- |
|
|
|
- |
|
|
|
- |
|
|
|
(66) |
|
|
|
- |
|
|
|
(66) |
|
|
|
- |
|
|
|
(66) |
|
| |
|
| Total comprehensive income (loss) |
|
|
- |
|
|
|
- |
|
|
|
(56) |
|
|
|
(66) |
|
|
|
- |
|
|
|
(122) |
|
|
|
137 |
|
|
|
15 |
|
| |
|
| Transactions with owners |
|
|
|
|
|
|
|
|
|
|
|
|
|
|
|
|
|
|
|
|
|
|
|
|
|
|
|
|
|
|
|
|
| Dividends |
|
|
- |
|
|
|
- |
|
|
|
(175) |
|
|
|
- |
|
|
|
- |
|
|
|
(175) |
|
|
|
- |
|
|
|
(175) |
|
| Issued on exercise of stock options |
|
|
18 |
|
|
|
- |
|
|
|
- |
|
|
|
- |
|
|
|
- |
|
|
|
- |
|
|
|
- |
|
|
|
- |
|
| Recognized on divestment of 10% of Acacia |
|
|
- |
|
|
|
- |
|
|
|
- |
|
|
|
- |
|
|
|
7 |
|
|
|
7 |
|
|
|
174 |
|
|
|
181 |
|
| Derecognition of stock option expense |
|
|
- |
|
|
|
(6) |
|
|
|
- |
|
|
|
- |
|
|
|
- |
|
|
|
(6) |
|
|
|
- |
|
|
|
(6) |
|
| Funding from non-controlling interests |
|
|
- |
|
|
|
- |
|
|
|
- |
|
|
|
- |
|
|
|
- |
|
|
|
- |
|
|
|
7 |
|
|
|
7 |
|
| |
|
| Total transactions with owners |
|
|
18 |
|
|
|
(6) |
|
|
|
(175) |
|
|
|
- |
|
|
|
7 |
|
|
|
(174) |
|
|
|
181 |
|
|
|
7 |
|
| |
|
| At September 30, 2014 |
|
|
1,164,670 |
|
|
$ |
20,863 |
|
|
$ |
(7,812) |
|
|
$ |
(135) |
|
|
$ |
321 |
|
|
$ |
13,237 |
|
|
$ |
2,786 |
|
|
$ |
16,023 |
|
| |
|
1 Includes cumulative translation losses at September 30, 2015:
$198 million (September 30, 2014: losses of $99 million).
2 Includes additional paid-in capital
as at September 30, 2015: $283 million (December 31, 2014: $283 million; September 30, 2014: $283 million) and convertible borrowings - equity component as at September 30, 2015: $38 million (December 31, 2014: $38 million;
September 30, 2014: $38 million).
The accompanying notes are an integral part of these consolidated financial statements.
|
|
|
|
|
| BARRICK THIRD QUARTER 2015 |
|
63 |
|
FINANCIAL STATEMENTS (UNAUDITED) |
NOTES TO CONSOLIDATED
FINANCIAL STATEMENTS
Barrick Gold Corporation. Tabular dollar amounts in millions
of United States dollars, unless otherwise shown. References to A$, ARS, C$, CLP, DOP, EUR, GBP, JPY, PGK, SAR, TZS, ZAR, and ZMW are to Australian dollars, Argentine pesos, Canadian dollars, Chilean pesos, Dominican pesos, Euros, British pound
sterling, Japanese yen, Papua New Guinea kina, Saudi riyal, Tanzanian shillings, South African rand, and Zambian kwacha, respectively.
1 > CORPORATE
INFORMATION
Barrick Gold Corporation (“Barrick”, “we” or the “Company”) is a corporation governed by the Business
Corporations Act (Ontario). The Company’s head and registered office is located at Brookfield Place, TD Canada Trust Tower, 161 Bay Street, Suite 3700, Toronto, Ontario, M5J 2S1. We are principally engaged in the production and sale of gold and
copper, as well as related activities such as exploration and mine development. Our producing gold mines are located in Canada, the United States, Peru, Argentina, Australia and Dominican Republic. We hold a 50% interest in Barrick Niugini Limited
(“BNL”), which owns a 95% interest in Porgera, a gold mine located in Papua New Guinea. We also hold a 63.9% equity interest in Acacia Mining plc (“Acacia”), a company listed on the London Stock Exchange that owns gold mines and
exploration properties in Africa. Our Copper business contains producing copper mines located in Chile and Zambia and a mine under construction in Saudi Arabia. We also have projects located in South America and North America. We sell our gold and
copper production into the world market.
2 > SIGNIFICANT ACCOUNTING POLICIES
| A) |
Statement of Compliance |
These
condensed interim consolidated financial statements have been prepared in accordance with International Accounting Standard 34 Interim Financial Reporting (“IAS 34”) as issued by the International Accounting Standards Board
(“IASB”). These interim financial statements should be read in conjunction with Barrick’s most recently issued Annual Report which includes information necessary or useful to understanding the Company’s business and financial
statement presentation. In particular, the Company’s significant accounting policies were presented in Note 2 of the consolidated financial statements for the year ended December 31, 2014, and have been consistently applied in the
preparation of these interim financial
statements except for note 2J, “Other Investments”, which as a result of the adoption of IFRS 9
in the current interim period has been replaced with the following: Investments in publicly quoted equity securities that are neither subsidiaries nor associates are categorized as Fair Value through Other Comprehensive Income (“FVOCI”)
using the irrevocable election available in IFRS 9 for these instruments. FVOCI equity investments (referred to as “Other Investments”) are recorded at fair value with all realized and unrealized gains and losses recorded permanently in
OCI. These interim consolidated financial statements were authorized for issuance by the Board of Directors on October 28, 2015.
| B) |
New Accounting Standards Effective in 2015 |
Impact of Adoption of IFRS 9 (2014)
We have early adopted all of
the requirements of IFRS 9 Financial Instruments 2014 (“IFRS 9”) as of January 1, 2015. IFRS 9 uses a single approach to determine whether a financial asset is classified and measured at amortized cost or fair value, replacing the
multiple rules in IAS 39. The approach in IFRS 9 is based on how an entity manages its financial instruments and the contractual cash flow characteristics of the financial asset. Most of the requirements in IAS 39 for classification and measurement
of financial liabilities were carried forward in IFRS 9. IFRS 9 introduced a single expected credit loss impairment model, which is based on changes in credit quality since initial recognition. The adoption of the expected credit loss impairment
model did not have a significant impact on the company’s financial statements.
IFRS 9 changes the requirements for hedge effectiveness and,
consequently for the application of hedge accounting. The IAS 39 effectiveness test is replaced with a requirement for an economic relationship between the hedged item and hedging instrument, and for the ‘hedged ratio’ to be the same as
that used by the entity for risk management purposes. Certain restrictions that prevented some hedging strategies and hedging instruments from qualifying for hedge accounting were removed under IFRS 9. Generally, the mechanics of hedge accounting
remain unchanged.
As a result of the early adoption of IFRS 9, we have changed our accounting policy for financial instruments retrospectively,
except as described below. The change did not result in a change in carrying value of any of our
|
|
|
|
|
| BARRICK THIRD QUARTER 2015 |
|
64 |
|
NOTES TO FINANCIAL STATEMENTS (UNAUDITED) |
financial instruments on transition date. The two main areas of change are the accounting for a) equity securities previously classified as available for sale and b) derivative instruments, which
includes the accounting for hedging relationships that now qualify for hedge accounting and the exclusion of the time value component of options from hedging instruments.
| a) |
Impact of adoption on the accounting for equity securities previously designated as available for sale |
The revised policy on the accounting for Other Investments, which represent equity securities previously designated as available for sale, is described in
note 2A). The adjustment to opening retained earnings on January 1, 2015 was $95 million with a corresponding adjustment to accumulated other comprehensive income. There was no impact on net income for 2015.
| b) |
Impact of adoption on accounting for derivative instruments |
We have reassessed all of our existing hedging relationships that qualified for hedge accounting under IAS 39 upon adoption of IFRS 9 and these have
continued to qualify for hedge accounting under IFRS 9. We have also reassessed economic hedges that did not qualify for hedge accounting under IAS 39. IFRS 9 has enabled us to apply hedge accounting for most of our fuel positions, thus reducing the
volatility of reported net income. These positions previously did not qualify for hedge accounting since component hedging was not permitted under IAS 39. We have applied these changes prospectively from January 1, 2015.
Under IFRS 9, we also began separating the intrinsic value and time value of option contracts and designating only the change in intrinsic value as the
hedging instrument. IFRS 9 does not require restatement of comparatives. However, we have reflected the retrospective impact of the adoption of IFRS 9 relating to the change in accounting for time value of option contracts as an adjustment to
opening retained earnings. The adjustment to opening retained earnings on January 1, 2015 was $4 million with a corresponding adjustment to accumulated other comprehensive income. There was no impact on net income.
We recognize a financial asset or a financial liability when we become a party to the contractual provisions of the instrument. Financial assets are
initially measured at fair value and are derecognized either when we have transferred substantially all the risks and rewards of ownership of the financial asset or when cash flows expire.
We classify and measure financial assets (excluding derivatives) on initial recognition as described below:
| ● |
|
Cash and equivalents and restricted cash include cash, term deposits, treasury bills and money market investments with original maturities of less than 90
days. All of these are classified as financial assets at fair value through profit or loss and are measured at fair value. Unrealized gains or losses related to changes in fair value are reported in income; |
| ● |
|
Trade and other receivables are classified as and measured at amortized cost using the effective interest method, less impairment allowance, if any;
|
| ● |
|
Equity instruments are designated as financial assets at fair value through other comprehensive income and are recorded at fair value on the settlement date,
net of transaction costs. Future changes in fair value are recognized in other comprehensive income and are not recycled into income. |
Financial liabilities (excluding derivatives) are derecognized when the obligation specified in the contract is discharged, cancelled or expired. For
financial liabilities, IFRS 9 retains most of the IAS 39 requirements and since we do not have any financial liabilities designated at fair value through profit or loss, the adoption of IFRS 9 did not impact our accounting policies for financial
liabilities.
| C) |
New Accounting Standards Issued But Not Yet Effective |
IFRS 15 Revenue from Contracts with Customers
In May 2014, the
IASB issued IFRS 15 Revenue from Contracts with Customers, which covers principles that an entity shall apply to report useful information to users of financial statements about the nature, amount, timing, and uncertainty of revenue and cash flows
arising from a contract with a customer. In September 2015, the IASB deferred the effective date of the standard to annual reporting periods beginning on or after January 1, 2018, with earlier application permitted. We are currently assessing
the impact on our consolidated financial statements along with the planned timing of our adoption of IFRS 15.
3 > SIGNIFICANT JUDGMENTS, ESTIMATES,
ASSUMPTIONS AND RISKS
The judgments, estimates, assumptions and risks discussed here reflect updates from the most recently filed annual
consolidated financial statements for the year ended December 31, 2014. For judgments, estimates, assumptions and risks related to other areas not discussed in these interim consolidated financial statements, please refer to Notes 3 and 27 of
the 2014 annual consolidated financial statements.
|
|
|
|
|
| BARRICK THIRD QUARTER 2015 |
|
65 |
|
NOTES TO FINANCIAL STATEMENTS (UNAUDITED) |
| A) |
Gold and Copper Mineral Reserves |
At the end of each fiscal year, as part of our annual business cycle, we prepare estimates of the proven and probable reserves and the portion of
resources expected to be extracted economically for each mineral property. We prospectively revise calculations of depreciation of property, plant and equipment and also transfer amounts allocated to non-depreciable mining interest to mining
interest subject to depreciation based on the ounces/pounds that have become probable of being economically extracted. The effect of changes in the proven and probable reserves and the portion of resources expected to be extracted economically on
depreciation expense for the three months ended September 30, 2015 was an increase of $114 million (2014: $51 million increase) and for the nine months ended September 30, 2015 was an increase $301 million (2014: $144 million increase).
The effect of transfers to mining interest subject to depreciation on depreciation expense for the three months ended September 30, 2015 was an increase of $3 million (2014: $1 million increase) and for the nine months ended September 30,
2015 was an increase of $8 million (2014: $4 million increase).
| B) |
Provision for Environmental Rehabilitation (“PER”) |
Provisions are updated each reporting period for changes to expected cash flows and for the effect of changes in the discount rate, foreign exchange rate
and the change in estimate is added or deducted from the related asset and depreciated over the expected economic life of the operation to which it relates. We recorded a decrease of $164 million (2014: $89 million decrease ) to the PER at our
minesites for the three months ended September 30, 2015 primarily due to an increase in the discount rate and the divestitures of Cowal and 50% of our interest in Porgera.
| C) |
Impairment and reversal of impairment for non-current assets and impairment of goodwill |
Non-current assets other than goodwill are tested for impairment, or reversal of impairment, when events or changes in circumstances suggest that the
carrying amount may not be fully recoverable, or an impairment loss recognized in prior periods for an asset other than goodwill may no longer exist or may have decreased. We conduct an annual test for impairment of goodwill in the fourth quarter of
each fiscal year and at any other time of the year if an indicator of impairment or reversal of impairment is identified. We recorded $452 million (2014: $18 million) of impairment charges for the three months ended September 30, 2015 and $492
million (2014: $542 million) of impairment charges for the nine months ended September 30, 2015.
In the three months ended September 30, 2015, the change in the Zambian royalty rate was identified as
an indicator of potential reversal, however, we concluded that no reversal was required.
Liquidity risk is
the risk of loss from not having access to sufficient funds to meet both expected and unexpected cash demands. We manage our exposure to liquidity risk by maintaining cash reserves, access to undrawn credit facilities and access to public debt
markets, by staggering the maturities of outstanding debt instruments to mitigate refinancing risk and by monitoring of forecast and actual cash flows.
As part of our capital allocation strategy, we evaluate our capital expenditures in order to ensure they generate an appropriate risk-adjusted return. We
work towards divesting assets that do not meet our capital allocation criteria.
Our primary source of liquidity is our operating cash flow. Other
options to enhance liquidity include drawing the $4.0 billion available under our 2012 Credit Facility (subject to compliance with covenants and the making of certain representations and warranties, this facility is available for drawdown as a
source of financing), further asset sales and issuances of debt or equity securities in the public markets or to private investors, which could be undertaken for liquidity enhancement and/or in connection with establishing a strategic partnership.
Many factors, including but not limited to general market conditions and then prevailing metals prices, could impact our ability to issue securities on acceptable terms, as could our credit ratings. Moody’s and S&P currently rate our
long-term debt Baa3 (stable) and BBB- (stable), respectively, after our credit ratings were downgraded by S&P on March 2, 2015 to BBB- (stable) and by Moody’s on Aug 12, 2015 to Baa3 (stable), both of which are the lowest investment
grade ratings. Changes in our ratings could affect the trading prices of our securities or our cost of capital. If we were to borrow under our 2012 Credit Facility, the applicable interest rate on the amounts borrowed would be based, in part, on our
credit ratings at the time. The key financial covenant in the 2012 Credit Facility (undrawn as at September 30, 2015) requires Barrick to maintain a consolidated tangible net worth (“CTNW”) of at least $3.0 billion (Barrick’s
CTNW was $6.0 billion as at September 30, 2015).
|
|
|
|
|
| BARRICK THIRD QUARTER 2015 |
|
66 |
|
NOTES TO FINANCIAL STATEMENTS (UNAUDITED) |
The upfront
cash deposit received from Royal Gold on the gold and silver streaming transaction has been accounted for a deferred revenue as we have determined that it is not a derivative as it will satisfied through the delivery of nonfinancial items (i.e. gold
and silver) rather than cash or financial assets. It is our intention to settle the obligations under the streaming arrangement through our own production and if we were to fail to settle the obligations with Royal Gold through our own production,
this would lead to the streaming arrangement becoming a derivative. This would cause a change to the accounting treatment, resulting in the revaluation of the fair value of the agreement through profit and loss on a recurring basis. Refer to note 4
for further details.
4 > DIVESTITURES AND NEW DEVELOPMENTS
|
|
|
|
|
|
|
|
|
|
|
|
|
|
|
|
|
| |
|
For the three months
ended September 30 |
|
|
For the nine months
ended September 30 |
|
| |
|
| |
|
2015 |
|
|
2014 |
|
|
2015 |
|
|
2014 |
|
| |
|
| Gross cash proceeds on divesture |
|
|
|
|
|
|
|
|
|
|
|
|
|
|
|
|
| Cowal |
|
|
$ 550 |
|
|
|
$ - |
|
|
|
$ 550 |
|
|
|
$ - |
|
| Porgera |
|
|
298 |
|
|
|
- |
|
|
|
298 |
|
|
|
- |
|
| Marigold |
|
|
- |
|
|
|
- |
|
|
|
- |
|
|
|
86 |
|
| Kanowna |
|
|
- |
|
|
|
- |
|
|
|
- |
|
|
|
67 |
|
| Plutonic |
|
|
- |
|
|
|
- |
|
|
|
- |
|
|
|
22 |
|
| Other |
|
|
- |
|
|
|
- |
|
|
|
2 |
|
|
|
- |
|
| |
|
|
|
|
$ 848 |
|
|
|
$ - |
|
|
|
$ 850 |
|
|
|
$ 175 |
|
| Less: cash divested |
|
|
(6) |
|
|
|
- |
|
|
|
(6) |
|
|
|
(9) |
|
| |
|
|
|
|
$ 842 |
|
|
|
$ - |
|
|
|
$ 844 |
|
|
|
$ 166 |
|
| |
|
On
July 30, 2015, we announced the sale of 50% of our Zaldívar copper mine in Chile to Antofagasta Plc for total cash consideration of $1.005 billion. The transaction is expected to be completed in late 2015 and is subject to customary
closing conditions. As at September 30, 2015, all of the assets and liabilities of Zaldivar (refer to the table below) were classified as held for sale as the transaction will result in a loss of control. As the agreed selling price is lower
than previously recorded book values, we recorded a goodwill impairment of $476 million in third quarter 2015. Refer to note 18 for further details of the impairment loss. We have determined that Zaldívar will be accounted for as a joint
venture and upon closing we will use the equity method of accounting for it.
|
|
|
|
|
| |
|
As at September 30
2015 |
|
| |
|
| Assets |
|
|
|
|
| Current Assets |
|
|
|
|
| Cash and equivalents |
|
|
$ 2 |
|
| Accounts receivable |
|
|
86 |
|
| Inventories |
|
|
491 |
|
| Other current assets |
|
|
56 |
|
| |
|
| Total current assets |
|
|
$ 635 |
|
|
|
| Non-current assets |
|
|
|
|
|
|
| Property, plant and equipment |
|
|
1,118 |
|
| Goodwill and intangibles |
|
|
731 |
|
| Non-current portion of inventory |
|
|
76 |
|
| Other |
|
|
10 |
|
| |
|
| Total assets |
|
|
$ 2,570 |
|
| |
|
|
|
| Liabilities |
|
|
|
|
| Current liabilities |
|
|
$ 83 |
|
|
|
| Non-current liabilities |
|
|
|
|
| Provisions and other |
|
|
100 |
|
| Deferred income tax liabilities |
|
|
388 |
|
| |
|
| Total liabilities |
|
|
$ 571 |
|
| |
|
| B) |
Disposition of Cowal and 50 percent interest in Porgera mines |
On July 23, 2015, we completed the sale of our Cowal mine in Australia for cash consideration of $550 million. The transaction resulted in a gain of
$28 million for the nine months ended September 30, 2015.
On August 31, 2015, we completed the sale of 50% of our interest in the Porgera
mine in Papua New Guinea to Zijin Mining Group Company (‘Zijin’) for cash consideration of $298 million. The transaction resulted in a gain of $24 million for the nine months ended September 30, 2015. The transaction remains subject
to certain customary closing adjustments. Subsequent to completion of the transaction, we account for Porgera as a joint operation and include our share of Porgera’s assets, liabilities, revenues and expenses in our financial statements.
| C) |
Disposition of 50 percent interest in Jabal Sayid |
On July 13, 2014, Barrick entered into an agreement to form a joint venture with Ma’aden to operate the Jabal Sayid copper project.
Ma’aden, which is 50 percent owned by the Saudi Arabian government, acquired its 50 percent interest in the new joint venture company for cash consideration of $216 million. The transaction closed on December 3, 2014. The transaction
resulted in a loss of control, consequently the assets and liabilities were written down to their fair
|
|
|
|
|
| BARRICK THIRD QUARTER 2015 |
|
67 |
|
NOTES TO FINANCIAL STATEMENTS (UNAUDITED) |
value less costs of disposal, which resulted in an impairment loss of $514 million, including $316 million of goodwill recorded in 2014. Refer to note 18 for further details of the impairment
loss.
| D) |
Disposition of Plutonic and Kanowna mines |
On January 31, 2014, we closed the sale of our Plutonic mine for total cash consideration of $22 million. In addition, on March 1, 2014, we
completed the sale of our Kanowna mine for total cash consideration of $67 million. The transactions resulted in a loss of $5 million in 2014.
| E) |
Disposition of 10 percent interest in Acacia |
On March 11, 2014, we completed the divestment of 41 million ordinary shares in Acacia, representing 10 percent of the issued ordinary share
capital of Acacia for net cash proceeds of $186 million. Subsequent to the divestment, we continue to retain a controlling financial interest in Acacia and continue to consolidate Acacia. We accounted for the divestment as an equity transaction and,
accordingly, recorded the difference between the proceeds received and the carrying value of $179 million as $7 million of additional paid-in capital in shareholders’ equity.
| F) |
Disposition of Marigold mine |
On
April 4, 2014, we completed the divestiture of our minority interest in the Marigold mine, for total cash consideration of $86 million. The transaction resulted in a gain of $21 million, which we recorded in 2014.
On
September 29, 2015 we closed a gold and silver streaming transaction with Royal Gold, Inc. (“Royal Gold”) for production linked to Barrick’s 60 percent interest in the Pueblo Viejo mine. Royal Gold made an upfront cash payment of
$610 million and will continue to make cash payments for gold and silver delivered under the agreement. The $610 million upfront payment is not repayable and Barrick is obligated to deliver gold and silver based on Pueblo Viejo’s production. We
have accounted for the upfront payment as deferred revenue and will recognize it in earnings, along with the ongoing cash payments, as the gold and silver is delivered to Royal Gold. We will also be recording accretion expense on the deferred
revenue balance as the time value of the upfront deposit represents a significant component of the transaction.
Under the terms of the agreement, Barrick will sell gold and silver to Royal Gold equivalent to:
| ● |
|
7.5 percent of Barrick’s interest in the gold produced at Pueblo Viejo until 990,000 ounces of gold have been delivered, and 3.75 percent thereafter.
|
| ● |
|
75 percent of Barrick’s interest in the silver produced at Pueblo Viejo until 50 million ounces have been delivered, and 37.5 percent thereafter.
Silver will be delivered based on a fixed recovery rate of 70 percent. Silver above this recovery rate is not subject to the stream. |
Barrick will receive ongoing cash payments from Royal Gold equivalent to 30 percent of the prevailing spot prices for the first 550,000 ounces of gold
and 23.1 million ounces of silver delivered. Thereafter payments will double to 60 percent of prevailing spot prices for each subsequent ounce of gold and silver delivered. Ongoing cash payments to Barrick are tied to prevailing spot prices
rather than fixed in advance.
On
September 29, 2015, we commenced a cash tender offer up to $750 million for specified series of outstanding notes. The offer was subsequently amended to equal $850 million. The settlement for this tender offer was October 28, 2015. An
amount of $834 million was reclassified as a current liability as at September 30, 2015 as we had the expectation to settle it within the next 12 months. We expect to record a loss on extinguishment of approximately $30 million in fourth
quarter 2015. In addition, on October 15, 2015, the company redeemed the outstanding $264 million aggregate principal amount of 5.75% notes due 2016, issued by a wholly-owned subsidiary.
|
|
|
|
|
| BARRICK THIRD QUARTER 2015 |
|
68 |
|
NOTES TO FINANCIAL STATEMENTS (UNAUDITED) |
5 > SEGMENT INFORMATION
Barrick’s business is organized into fifteen individual mine sites, one publicly traded company and one project. Barrick’s Chief Operating
Decision Maker (“CODM”), the President, reviews the operating results, assesses performance and makes capital allocation decisions at the mine site, Company and/or project level. Therefore, each individual mine site and Acacia are
operating segments for financial reporting purposes. For segment reporting purposes, we present our reportable operating segments as follows: eight individual gold mines, two individual copper mines, Acacia and our Pascua-Lama project. The remaining
operating segments have been grouped into an “other” category consisting of our remaining gold mines. The prior periods have been restated to reflect the change in presentation.
Segment performance is evaluated based on a number of measures including operating income before tax, production levels and unit production costs.
Certain costs are managed on a consolidated basis and are therefore not reflected in segment income. Starting January 1, 2015, we updated the allocation of our general and administration costs to individual mine sites to reflect the removal of
all regional oversight and the transfer of most functional services to mine sites and to hold the mine sites directly accountable for the cost of the functional services they require to run their business.
Consolidated Statement of Income Information
|
|
|
|
|
|
|
|
|
|
|
|
|
|
|
|
|
|
|
|
|
|
|
|
|
| |
|
| |
|
|
|
|
Cost of
Sales |
|
|
|
|
|
|
|
|
|
|
| For the three months ended
September 30, 2015 |
|
Revenue |
|
|
Direct mining,
royalties and
community
relations |
|
|
Depreciation |
|
|
Exploration,
evaluation and
project expenses |
|
|
Other expenses
(income)1 |
|
|
Segment
income (loss) |
|
| |
|
|
|
|
|
|
|
|
| Goldstrike |
|
|
$ 329 |
|
|
|
$ 150 |
|
|
|
$ 59 |
|
|
|
$ 1 |
|
|
|
$ 1 |
|
|
|
$ 118 |
|
|
|
|
|
|
|
|
| Cortez |
|
|
315 |
|
|
|
116 |
|
|
|
77 |
|
|
|
1 |
|
|
|
3 |
|
|
|
118 |
|
|
|
|
|
|
|
|
| Pueblo Viejo |
|
|
366 |
|
|
|
169 |
|
|
|
83 |
|
|
|
- |
|
|
|
1 |
|
|
|
113 |
|
|
|
|
|
|
|
|
| Lagunas Norte |
|
|
140 |
|
|
|
50 |
|
|
|
45 |
|
|
|
2 |
|
|
|
3 |
|
|
|
40 |
|
|
|
|
|
|
|
|
| Veladero |
|
|
168 |
|
|
|
111 |
|
|
|
27 |
|
|
|
1 |
|
|
|
1 |
|
|
|
28 |
|
|
|
|
|
|
|
|
| Turquoise Ridge |
|
|
59 |
|
|
|
32 |
|
|
|
6 |
|
|
|
- |
|
|
|
- |
|
|
|
21 |
|
|
|
|
|
|
|
|
| Porgera |
|
|
144 |
|
|
|
93 |
|
|
|
3 |
|
|
|
- |
|
|
|
(1) |
|
|
|
49 |
|
|
|
|
|
|
|
|
| Kalgoorlie |
|
|
101 |
|
|
|
58 |
|
|
|
15 |
|
|
|
1 |
|
|
|
1 |
|
|
|
26 |
|
|
|
|
|
|
|
|
| Acacia |
|
|
191 |
|
|
|
141 |
|
|
|
32 |
|
|
|
8 |
|
|
|
3 |
|
|
|
7 |
|
|
|
|
|
|
|
|
| Lumwana |
|
|
124 |
|
|
|
95 |
|
|
|
9 |
|
|
|
- |
|
|
|
1 |
|
|
|
19 |
|
|
|
|
|
|
|
|
| Zaldivar |
|
|
145 |
|
|
|
97 |
|
|
|
9 |
|
|
|
- |
|
|
|
1 |
|
|
|
38 |
|
|
|
|
|
|
|
|
| Pascua-Lama |
|
|
- |
|
|
|
- |
|
|
|
8 |
|
|
|
30 |
|
|
|
(3) |
|
|
|
(35) |
|
|
|
|
|
|
|
|
| Other Mines2 |
|
|
235 |
|
|
|
171 |
|
|
|
53 |
|
|
|
1 |
|
|
|
(47) |
|
|
|
57 |
|
| |
|
|
|
|
$ 2,317 |
|
|
|
$ 1,283 |
|
|
|
$ 426 |
|
|
|
$ 45 |
|
|
|
$ (36) |
|
|
|
$ 599 |
|
| |
|
|
|
|
|
|
| BARRICK THIRD QUARTER 2015 |
|
69 |
|
NOTES TO FINANCIAL STATEMENTS (UNAUDITED) |
Consolidated Statement of Income Information
|
|
|
|
|
|
|
|
|
|
|
|
|
|
|
|
|
|
|
|
|
|
|
| |
|
| |
|
|
|
Cost of Sales |
|
|
|
|
|
|
|
|
|
|
| For the three months ended
September 30, 2014 |
|
Revenue |
|
Direct mining,
royalties and
community
relations |
|
|
Depreciation |
|
|
Exploration,
evaluation and
project expenses |
|
|
Other expenses
(income)1 |
|
|
Segment
income (loss) |
|
| |
|
|
|
|
|
|
|
|
| Goldstrike |
|
$ 295 |
|
|
$ 131 |
|
|
|
$ 31 |
|
|
|
$ - |
|
|
|
$ - |
|
|
|
$ 133 |
|
|
|
|
|
|
|
|
| Cortez |
|
324 |
|
|
122 |
|
|
|
67 |
|
|
|
1 |
|
|
|
4 |
|
|
|
130 |
|
|
|
|
|
|
|
|
| Pueblo Viejo |
|
412 |
|
|
165 |
|
|
|
67 |
|
|
|
- |
|
|
|
(1) |
|
|
|
181 |
|
|
|
|
|
|
|
|
| Lagunas Norte |
|
190 |
|
|
63 |
|
|
|
25 |
|
|
|
- |
|
|
|
(6) |
|
|
|
108 |
|
|
|
|
|
|
|
|
| Veladero |
|
204 |
|
|
100 |
|
|
|
23 |
|
|
|
- |
|
|
|
3 |
|
|
|
78 |
|
|
|
|
|
|
|
|
| Turquoise Ridge |
|
62 |
|
|
22 |
|
|
|
4 |
|
|
|
- |
|
|
|
(1) |
|
|
|
37 |
|
|
|
|
|
|
|
|
| Porgera |
|
177 |
|
|
119 |
|
|
|
19 |
|
|
|
1 |
|
|
|
(1) |
|
|
|
39 |
|
|
|
|
|
|
|
|
| Kalgoorlie |
|
101 |
|
|
66 |
|
|
|
11 |
|
|
|
1 |
|
|
|
- |
|
|
|
23 |
|
|
|
|
|
|
|
|
| Acacia |
|
240 |
|
|
137 |
|
|
|
29 |
|
|
|
3 |
|
|
|
8 |
|
|
|
63 |
|
|
|
|
|
|
|
|
| Lumwana |
|
136 |
|
|
79 |
|
|
|
30 |
|
|
|
- |
|
|
|
3 |
|
|
|
24 |
|
|
|
|
|
|
|
|
| Zaldivar |
|
181 |
|
|
103 |
|
|
|
19 |
|
|
|
- |
|
|
|
(5) |
|
|
|
64 |
|
|
|
|
|
|
|
|
| Pascua-Lama |
|
- |
|
|
- |
|
|
|
4 |
|
|
|
29 |
|
|
|
(3) |
|
|
|
(30) |
|
|
|
|
|
|
|
|
| Other Mines2 |
|
298 |
|
|
182 |
|
|
|
73 |
|
|
|
10 |
|
|
|
2 |
|
|
|
31 |
|
| |
|
|
|
$ 2,620 |
|
|
$ 1,289 |
|
|
|
$ 402 |
|
|
|
$ 45 |
|
|
|
$ 3 |
|
|
|
$ 881 |
|
| |
|
| Consolidated Statement of
Income Information |
|
| |
|
| |
|
|
|
Cost of Sales |
|
|
|
|
|
|
|
|
|
|
| For the nine months ended
September 30, 2015 |
|
Revenue |
|
Direct mining,
royalties and
community
relations |
|
|
Depreciation |
|
|
Exploration,
evaluation and
project expenses |
|
|
Other expenses
(income)1 |
|
|
Segment
income (loss) |
|
| |
|
|
|
|
|
|
|
|
| Goldstrike |
|
$ 759 |
|
|
$ 352 |
|
|
|
$ 119 |
|
|
|
$ 7 |
|
|
|
$ 5 |
|
|
|
$ 276 |
|
|
|
|
|
|
|
|
| Cortez |
|
747 |
|
|
363 |
|
|
|
221 |
|
|
|
2 |
|
|
|
9 |
|
|
|
152 |
|
|
|
|
|
|
|
|
| Pueblo Viejo |
|
1,047 |
|
|
485 |
|
|
|
222 |
|
|
|
- |
|
|
|
(1) |
|
|
|
341 |
|
|
|
|
|
|
|
|
| Lagunas Norte |
|
540 |
|
|
165 |
|
|
|
132 |
|
|
|
3 |
|
|
|
6 |
|
|
|
234 |
|
|
|
|
|
|
|
|
| Veladero |
|
547 |
|
|
297 |
|
|
|
79 |
|
|
|
2 |
|
|
|
1 |
|
|
|
168 |
|
|
|
|
|
|
|
|
| Turquoise Ridge |
|
178 |
|
|
89 |
|
|
|
17 |
|
|
|
- |
|
|
|
1 |
|
|
|
71 |
|
|
|
|
|
|
|
|
| Porgera |
|
438 |
|
|
300 |
|
|
|
30 |
|
|
|
1 |
|
|
|
3 |
|
|
|
104 |
|
|
|
|
|
|
|
|
| Kalgoorlie |
|
275 |
|
|
180 |
|
|
|
37 |
|
|
|
2 |
|
|
|
3 |
|
|
|
53 |
|
|
|
|
|
|
|
|
| Acacia |
|
634 |
|
|
435 |
|
|
|
99 |
|
|
|
18 |
|
|
|
6 |
|
|
|
76 |
|
|
|
|
|
|
|
|
| Lumwana |
|
382 |
|
|
341 |
|
|
|
36 |
|
|
|
- |
|
|
|
3 |
|
|
|
2 |
|
|
|
|
|
|
|
|
| Zaldivar |
|
411 |
|
|
277 |
|
|
|
44 |
|
|
|
- |
|
|
|
3 |
|
|
|
87 |
|
|
|
|
|
|
|
|
| Pascua-Lama |
|
- |
|
|
- |
|
|
|
16 |
|
|
|
86 |
|
|
|
(16) |
|
|
|
(86) |
|
|
|
|
|
|
|
|
| Other Mines2 |
|
823 |
|
|
502 |
|
|
|
195 |
|
|
|
5 |
|
|
|
(26) |
|
|
|
147 |
|
| |
|
|
|
$ 6,781 |
|
|
$ 3,786 |
|
|
|
$ 1,247 |
|
|
|
$ 126 |
|
|
|
$ (3) |
|
|
|
$ 1,625 |
|
| |
|
|
|
|
|
|
| BARRICK THIRD QUARTER 2015 |
|
70 |
|
NOTES TO FINANCIAL STATEMENTS (UNAUDITED) |
Consolidated Statement of Income Information
|
|
|
|
|
|
|
|
|
|
|
|
|
|
|
|
|
|
|
|
|
|
|
| |
|
| |
|
|
|
Cost of Sales |
|
|
|
|
|
|
|
|
|
|
| For the nine months ended
September 30, 2014 |
|
Revenue |
|
Direct mining,
royalties and
community
relations |
|
|
Depreciation |
|
|
Exploration,
evaluation and
project expenses |
|
|
Other expenses
(income)1 |
|
|
Segment
income (loss) |
|
| |
|
|
|
|
|
|
|
|
| Goldstrike |
|
$ 919 |
|
|
$ 401 |
|
|
|
$ 103 |
|
|
|
$ 1 |
|
|
|
$ 3 |
|
|
|
$ 411 |
|
|
|
|
|
|
|
|
| Cortez |
|
868 |
|
|
307 |
|
|
|
182 |
|
|
|
1 |
|
|
|
8 |
|
|
|
370 |
|
|
|
|
|
|
|
|
| Pueblo Viejo |
|
1,200 |
|
|
486 |
|
|
|
187 |
|
|
|
- |
|
|
|
(1) |
|
|
|
528 |
|
|
|
|
|
|
|
|
| Lagunas Norte |
|
546 |
|
|
169 |
|
|
|
51 |
|
|
|
- |
|
|
|
(2) |
|
|
|
328 |
|
|
|
|
|
|
|
|
| Veladero |
|
660 |
|
|
326 |
|
|
|
89 |
|
|
|
1 |
|
|
|
7 |
|
|
|
237 |
|
|
|
|
|
|
|
|
| Turquoise Ridge |
|
193 |
|
|
67 |
|
|
|
12 |
|
|
|
- |
|
|
|
- |
|
|
|
114 |
|
|
|
|
|
|
|
|
| Porgera |
|
480 |
|
|
345 |
|
|
|
60 |
|
|
|
2 |
|
|
|
- |
|
|
|
73 |
|
|
|
|
|
|
|
|
| Kalgoorlie |
|
320 |
|
|
205 |
|
|
|
32 |
|
|
|
1 |
|
|
|
1 |
|
|
|
81 |
|
|
|
|
|
|
|
|
| Acacia |
|
682 |
|
|
406 |
|
|
|
94 |
|
|
|
14 |
|
|
|
15 |
|
|
|
153 |
|
|
|
|
|
|
|
|
| Lumwana |
|
333 |
|
|
262 |
|
|
|
66 |
|
|
|
- |
|
|
|
5 |
|
|
|
- |
|
|
|
|
|
|
|
|
| Zaldivar |
|
527 |
|
|
304 |
|
|
|
52 |
|
|
|
- |
|
|
|
(3) |
|
|
|
174 |
|
|
|
|
|
|
|
|
| Pascua-Lama |
|
- |
|
|
- |
|
|
|
12 |
|
|
|
103 |
|
|
|
6 |
|
|
|
(121) |
|
|
|
|
|
|
|
|
| Other Mines2 |
|
983 |
|
|
596 |
|
|
|
234 |
|
|
|
31 |
|
|
|
18 |
|
|
|
104 |
|
| |
|
|
|
$ 7,711 |
|
|
$ 3,874 |
|
|
|
$ 1,174 |
|
|
|
$ 154 |
|
|
|
$ 57 |
|
|
|
$ 2,452 |
|
| |
|
1 Other expenses include accretion
expense, which is included within finance costs in the consolidated statement of income. For the three months ended September 30, 2015, accretion expense was $11 million (2014: $12 million) and for the nine months ended September 30, 2015,
accretion expense was $34 million (2014: $40 million).
2 Includes exploration
and evaluation expense and losses from equity investees.
Reconciliation of Segment Income to Income Before Income Taxes
|
|
|
|
|
|
|
|
|
|
|
|
|
| |
|
For the three months ended |
|
For the nine months ended |
|
| |
|
September 30 |
|
September 30 |
|
| |
|
| |
|
2015 |
|
2014 |
|
2015 |
|
|
2014 |
|
| |
|
| Segment income |
|
$ 599 |
|
$ 881 |
|
|
$ 1,625 |
|
|
|
$ 2,452 |
|
| Other
revenue1 |
|
(2) |
|
4 |
|
|
10 |
|
|
|
18 |
|
| Other cost of sales/amortization1,2 |
|
(33) |
|
10 |
|
|
(106) |
|
|
|
17 |
|
| Exploration, evaluation and project expenses not attributable
to segments |
|
(41) |
|
(57) |
|
|
(143) |
|
|
|
(153) |
|
| General and administrative expenses |
|
(44) |
|
(98) |
|
|
(181) |
|
|
|
(283) |
|
| Other (expense) income not attributable to segments |
|
(2) |
|
4 |
|
|
(6) |
|
|
|
(6) |
|
| Impairment charges not attributable to segments |
|
(452) |
|
(18) |
|
|
(492) |
|
|
|
(542) |
|
| Gain (loss) on currency translation |
|
43 |
|
(30) |
|
|
12 |
|
|
|
(140) |
|
| Closed mine rehabilitation |
|
8 |
|
4 |
|
|
19 |
|
|
|
(45) |
|
| Finance income |
|
2 |
|
3 |
|
|
6 |
|
|
|
9 |
|
| Finance costs (includes non segment accretion) |
|
(196) |
|
(186) |
|
|
(563) |
|
|
|
(559) |
|
| Loss on non-hedge derivatives |
|
(12) |
|
(65) |
|
|
(23) |
|
|
|
- |
|
| |
|
| Income (loss) before income taxes |
|
$ (130) |
|
$ 452 |
|
|
$ 158 |
|
|
|
$ 768 |
|
| |
|
1 Includes revenue and costs from Pierina which is
not considered part of any of our operating segments as Pierina entered closure in 2013.
2 Includes all realized hedge gains/losses.
|
|
|
|
|
| BARRICK THIRD QUARTER 2015 |
|
71 |
|
NOTES TO FINANCIAL STATEMENTS (UNAUDITED) |
|
|
|
|
|
|
|
|
|
|
|
|
|
|
|
|
|
| Capital Expenditures Information |
|
Segment capital expenditures1 |
|
| |
|
For the three months ended |
|
|
For the nine months ended |
|
| |
|
September 30 |
|
|
September 30 |
|
| |
|
2015 |
|
|
2014 |
|
|
2015 |
|
|
2014 |
|
| |
|
| Goldstrike |
|
|
$ 14 |
|
|
|
$ 180 |
|
|
|
$ 144 |
|
|
|
$ 434 |
|
|
|
|
|
|
| Cortez |
|
|
38 |
|
|
|
31 |
|
|
|
128 |
|
|
|
151 |
|
|
|
|
|
|
| Pueblo Viejo |
|
|
23 |
|
|
|
28 |
|
|
|
84 |
|
|
|
99 |
|
|
|
|
|
|
| Lagunas Norte |
|
|
19 |
|
|
|
17 |
|
|
|
50 |
|
|
|
60 |
|
|
|
|
|
|
| Veladero |
|
|
51 |
|
|
|
40 |
|
|
|
187 |
|
|
|
104 |
|
|
|
|
|
|
| Turquoise Ridge |
|
|
7 |
|
|
|
7 |
|
|
|
23 |
|
|
|
22 |
|
|
|
|
|
|
| Porgera |
|
|
30 |
|
|
|
9 |
|
|
|
84 |
|
|
|
22 |
|
|
|
|
|
|
| Kalgoorlie |
|
|
4 |
|
|
|
13 |
|
|
|
27 |
|
|
|
39 |
|
|
|
|
|
|
| Acacia |
|
|
51 |
|
|
|
81 |
|
|
|
134 |
|
|
|
196 |
|
|
|
|
|
|
| Lumwana |
|
|
28 |
|
|
|
69 |
|
|
|
71 |
|
|
|
160 |
|
|
|
|
|
|
| Zaldivar |
|
|
33 |
|
|
|
21 |
|
|
|
61 |
|
|
|
73 |
|
|
|
|
|
|
| Pascua-Lama |
|
|
- |
|
|
|
61 |
|
|
|
- |
|
|
|
92 |
|
|
|
|
|
|
| Other Mines |
|
|
51 |
|
|
|
39 |
|
|
|
179 |
|
|
|
138 |
|
| |
|
| Segment total |
|
|
$ 349 |
|
|
|
$ 596 |
|
|
|
$ 1,172 |
|
|
|
$ 1,590 |
|
|
|
|
|
|
| Other items not allocated to segments |
|
|
35 |
|
|
|
8 |
|
|
|
82 |
|
|
|
25 |
|
| |
|
|
|
|
|
|
| Total |
|
|
$ 384 |
|
|
|
$ 604 |
|
|
|
$ 1,254 |
|
|
|
$ 1,615 |
|
| |
|
| 1 |
Segment capital expenditures are presented for internal management reporting purposes on an accrual basis. Capital expenditures in the Consolidated Statements
of Cash Flow are presented on a cash basis. For the three months ended September 30, 2015, cash expenditures were $389 million (2014: $653 million) and the decrease in accrued expenditures was $5 million (2014: $ 49 million decrease). For
the nine months ended September 30, 2015, cash expenditures were $ 1,402 million (2014: $1,885 million) and the decrease in accrued expenditures was $148 million (2014: $270 million decrease). |
6 > REVENUE
|
|
|
|
|
|
|
|
|
| |
|
For the three months
ended September 30 |
|
For the nine months
ended September 30 |
| |
| |
|
2015 |
|
2014 |
|
2015 |
|
2014 |
| |
| Gold bullion sales |
|
|
|
|
|
|
|
|
| Spot market sales |
|
$ 1,937 |
|
$ 2,158 |
|
$ 5,639 |
|
$ 6,475 |
| Concentrate sales |
|
55 |
|
77 |
|
193 |
|
189 |
| |
|
|
$ 1,992 |
|
$ 2,235 |
|
$ 5,832 |
|
$ 6,664 |
| Copper sales |
|
|
|
|
|
|
|
|
| Copper cathode sales |
|
$ 145 |
|
$ 182 |
|
$ 411 |
|
$ 527 |
| Concentrate sales |
|
124 |
|
136 |
|
382 |
|
333 |
| |
|
|
$ 269 |
|
$ 318 |
|
$ 793 |
|
$ 860 |
| |
| Other
sales1 |
|
$ 54 |
|
$ 71 |
|
$ 166 |
|
$ 205 |
| |
| Total |
|
$ 2,315 |
|
$ 2,624 |
|
$ 6,791 |
|
$ 7,729 |
| |
| 1 |
Revenues include the sale of by-products for our gold and copper mines and energy sales from Monte Rio. |
Provisional
Copper and Gold Sales
We have provisionally priced sales for which price finalization, referenced to the relevant copper and gold index, is
outstanding at the balance sheet date. Our exposure at September 30, 2015 to the impact of movements in market commodity prices for provisionally priced sales is set out in the following table:
|
|
|
|
|
|
|
|
|
|
|
|
|
|
|
|
|
| |
|
Volumes subject to
final pricing
Copper (millions)
Gold (000’s) |
|
|
Impact on net income
before taxation of
10% movement in
market price US$ |
|
| |
|
| For the nine months
ended September 30 |
|
2015 |
|
|
2014 |
|
|
2015 |
|
|
2014 |
|
| |
|
| Copper pounds |
|
|
62 |
|
|
|
54 |
|
|
|
$ 15 |
|
|
|
$ 16 |
|
| Gold ounces |
|
|
22 |
|
|
|
31 |
|
|
|
2 |
|
|
|
4 |
|
| |
|
For the three months ended September 30, 2015, our provisionally priced copper sales included provisional pricing
losses of $23 million (2014: $10 million losses) and our provisionally priced gold sales included provisional pricing losses of $1 million (2014: $2 million losses). For the nine months ended September 30, 2015, our provisionally priced copper
sales included provisional pricing losses of $47 million (2014: $25 million losses) and our provisionally priced gold sales included provisional pricing losses of $2 million (2014: $nil).
At September 30, 2015, our provisionally priced copper and gold sales subject to final settlement were recorded at average prices of $2.35/lb (2014:
$3.04/lb) and $ 1,125/oz (2014: $1,240/oz), respectively. The sensitivities in the above table show the impact of a 10 percent change in commodity prices, while holding all other variables constant.
|
|
|
|
|
| BARRICK THIRD QUARTER 2015 |
|
72 |
|
NOTES TO FINANCIAL STATEMENTS (UNAUDITED) |
7 > COST OF SALES
|
|
|
|
|
|
|
|
|
| |
|
For the three months
ended September 30 |
|
For the nine months
ended September 30 |
| |
| |
|
2015 |
|
2014 |
|
2015 |
|
2014 |
| |
| Direct mining
cost1,2 |
|
$ 1,209 |
|
$ 1,172 |
|
$ 3,559 |
|
$ 3,539 |
| Depreciation |
|
432 |
|
412 |
|
1,272 |
|
1,214 |
| Royalty expense |
|
80 |
|
78 |
|
259 |
|
226 |
| Community relations |
|
21 |
|
19 |
|
49 |
|
52 |
| |
|
|
$ 1,742 |
|
$ 1,681 |
|
$ 5,139 |
|
$ 5,031 |
| |
| 1 |
Direct mining cost includes charges to reduce the cost of inventory to net realizable value as follows: $63 million for the three months ended September 30, 2015 (2014: $15 million) and $151 million for the nine
months ended September 30, 2015 (2014: $56 million). |
| 2 |
Direct mining cost includes the costs of extracting by-products. |
Beginning in January 1, 2015, we
updated the allocation of general & administration (“G&A”) costs to individual mine sites to reflect the removal of all regional oversight and the transfer of most functional services to mine sites and have the mine sites
directly accountable for the cost of the functional services they require to run their business. These costs now form part of mine site G&A costs which is included within direct mining costs.
8 > EXPLORATION, EVALUATION AND PROJECT EXPENSES
|
|
|
|
|
|
|
|
|
| |
|
For the three months
ended September 30 |
|
For the nine months
ended September 30 |
| |
| |
|
2015 |
|
2014 |
|
2015 |
|
2014 |
| |
| Exploration |
|
|
|
|
|
|
|
|
| Minesite exploration |
|
$ 9 |
|
$ 6 |
|
$ 28 |
|
$ 23 |
| Global programs |
|
18 |
|
33 |
|
86 |
|
92 |
| |
|
|
$ 27 |
|
$ 39 |
|
$ 114 |
|
$ 115 |
| Evaluation costs |
|
4 |
|
6 |
|
14 |
|
15 |
| |
| Exploration and evaluation expense1 |
|
$ 31 |
|
$ 45 |
|
$ 128 |
|
$ 130 |
| Advanced project costs: |
|
|
|
|
|
|
|
|
| Pascua-Lama |
|
28 |
|
27 |
|
82 |
|
94 |
| Jabal Sayid |
|
- |
|
7 |
|
- |
|
24 |
| Other project related costs: |
|
|
|
|
|
|
|
|
| Cerro Casale |
|
1 |
|
3 |
|
5 |
|
9 |
| Kainantu |
|
- |
|
1 |
|
- |
|
3 |
| Reko Diq |
|
2 |
|
3 |
|
2 |
|
8 |
| Corporate |
|
|
|
|
|
|
|
|
| Development |
|
22 |
|
14 |
|
48 |
|
30 |
| Community relations related to projects |
|
2 |
|
2 |
|
4 |
|
9 |
| |
| Exploration, evaluation and project expenses |
|
$ 86 |
|
$ 102 |
|
$ 269 |
|
$ 307 |
| |
| 1 |
Approximates the impact on operating cash flow. |
9 > EARNINGS (LOSS) PER SHARE
|
|
|
|
|
|
|
|
|
|
|
|
|
|
|
|
|
|
|
|
|
|
|
|
|
|
|
|
|
|
|
|
|
| |
|
For the three months ended September 30 |
|
|
For the nine months ended September 30 |
|
|
|
|
|
|
| |
|
2015 |
|
|
2014 |
|
|
2015 |
|
|
2014 |
|
| |
|
| ($ millions, except shares in millions and
per share amounts in dollars) |
|
Basic |
|
|
Diluted |
|
|
Basic |
|
|
Diluted |
|
|
Basic |
|
|
Diluted |
|
|
Basic |
|
|
Diluted |
|
| |
|
| Net income (loss) |
|
|
$ (252) |
|
|
|
$ (252) |
|
|
|
$ 177 |
|
|
|
$ 177 |
|
|
|
$ (172) |
|
|
|
$ (172) |
|
|
|
$ 81 |
|
|
|
$ 81 |
|
| Net income attributable to non-controlling interests |
|
|
(12) |
|
|
|
(12) |
|
|
|
(52) |
|
|
|
(52) |
|
|
|
(44) |
|
|
|
(44) |
|
|
|
(137) |
|
|
|
(137) |
|
| |
|
| Net income (loss) attributable to equity holders of Barrick Gold Corporation |
|
|
$ (264) |
|
|
|
$ (264) |
|
|
|
$ 125 |
|
|
|
$ 125 |
|
|
|
$ (216) |
|
|
|
$ (216) |
|
|
|
$ (56) |
|
|
|
$ (56) |
|
| |
|
| Weighted average shares outstanding |
|
|
1,165 |
|
|
|
1,165 |
|
|
|
1,165 |
|
|
|
1,165 |
|
|
|
1,165 |
|
|
|
1,165 |
|
|
|
1,165 |
|
|
|
1,165 |
|
| |
|
| Earnings per share data attributable to the equity holders of Barrick Gold Corporation |
|
|
|
|
|
|
|
|
|
|
|
|
|
|
|
|
|
|
|
|
|
|
|
|
|
|
|
|
|
|
|
|
| |
|
| Net income (loss) |
|
|
$ (0.23) |
|
|
|
$ (0.23) |
|
|
|
$ 0.11 |
|
|
|
$ 0.11 |
|
|
|
$ (0.19) |
|
|
|
$ (0.19) |
|
|
|
$ (0.05) |
|
|
|
$ (0.05) |
|
| |
|
|
|
|
|
|
| BARRICK THIRD QUARTER 2015 |
|
73 |
|
NOTES TO FINANCIAL STATEMENTS (UNAUDITED) |
10 > OTHER EXPENSES
A Other Expense (Income)
|
|
|
|
|
|
|
|
|
| |
|
For the three months
ended September 30 |
|
For the nine months
ended September 30 |
| |
| |
|
2015 |
|
2014 |
|
2015 |
|
2014 |
| |
| Other expense: |
|
|
|
|
|
|
|
|
| Consulting fees |
|
$ 1 |
|
$ 4 |
|
$ 6 |
|
$ 23 |
| Bank charges |
|
4 |
|
4 |
|
15 |
|
13 |
| Mine site severance and non-operational costs |
|
- |
|
- |
|
1 |
|
8 |
| Office closure costs |
|
4 |
|
- |
|
31 |
|
15 |
| Management Fee |
|
1 |
|
(3) |
|
1 |
|
(3) |
| Toll Milling |
|
1 |
|
(1) |
|
5 |
|
- |
| World Gold Council fees |
|
- |
|
1 |
|
- |
|
3 |
| Pension and other post-retirement benefit expense |
|
1 |
|
1 |
|
3 |
|
4 |
| |
| Total other expense |
|
$ 12 |
|
$ 6 |
|
$ 62 |
|
$ 63 |
| |
|
|
|
|
|
| Other income: |
|
|
|
|
|
|
|
|
| Gain on sale of long-lived assets |
|
$ (54) |
|
$ (14) |
|
$ (80) |
|
$ (37) |
| Insurance (recovery) expense |
|
(2) |
|
6 |
|
(3) |
|
6 |
| Royalty income |
|
(1) |
|
(1) |
|
(3) |
|
(2) |
| Miscellaneous write offs (recovery) |
|
- |
|
1 |
|
(4) |
|
4 |
| Incidental income |
|
- |
|
(11) |
|
(3) |
|
(11) |
| |
| Total other income |
|
$ (57) |
|
$ (19) |
|
$ (93) |
|
$ (40) |
| |
| Total |
|
$ (45) |
|
$ (13) |
|
$ (31) |
|
$ 23 |
| |
B Impairment Charges
|
|
|
|
|
|
|
|
|
| |
|
For the three months
ended September 30 |
|
For the nine months
ended September 30 |
| |
| |
|
2015 |
|
2014 |
|
2015 |
|
2014 |
| |
| Impairment (reversal) of long-lived assets |
|
$ (24) |
|
$ 18 |
|
$ 16 |
|
$ 203 |
| Impairment of other intangibles |
|
- |
|
- |
|
- |
|
7 |
| |
|
|
$ (24) |
|
$ 18 |
|
$ 16 |
|
$ 210 |
| Impairment of goodwill |
|
476 |
|
- |
|
476 |
|
316 |
| Impairment of other investments |
|
- |
|
- |
|
- |
|
16 |
| |
| Total |
|
$ 452 |
|
$ 18 |
|
$ 492 |
|
$ 542 |
| |
11 > FINANCE COSTS
|
|
|
|
|
|
|
|
|
| |
|
For the three months
ended September 30 |
|
For the nine months
ended September 30 |
| |
| |
|
2015 |
|
2014 |
|
2015 |
|
2014 |
| |
| Interest |
|
$ 184 |
|
$ 184 |
|
$ 549 |
|
$ 550 |
| Amortization of debt issue costs |
|
5 |
|
5 |
|
15 |
|
15 |
| Losses (gains) on interest rate hedges |
|
1 |
|
(1) |
|
2 |
|
(2) |
| Interest capitalized |
|
- |
|
(8) |
|
(17) |
|
(22) |
| Accretion |
|
17 |
|
18 |
|
48 |
|
58 |
| |
| Total |
|
$ 207 |
|
$ 198 |
|
$ 597 |
|
$ 599 |
| |
12 > INCOME TAX EXPENSE (RECOVERY)
|
|
|
|
|
|
|
|
|
| |
|
For the three months
ended September 30 |
|
For the nine months
ended September 30 |
| |
| |
|
2015 |
|
2014 |
|
2015 |
|
2014 |
| |
| Current |
|
$ 143 |
|
$ 225 |
|
$ 329 |
|
$ 621 |
| Deferred |
|
(21) |
|
50 |
|
1 |
|
66 |
| |
|
|
$ 122 |
|
$ 275 |
|
$ 330 |
|
$ 687 |
| |
The tax rate for income in the nine months ended September 30, 2015 was 209% (2014: 89%). After adjusting for the
impact of de-recognition of a deferred tax asset, net currency translation losses on deferred tax balances, the impact of impairments charges, asset sales and non-hedge derivatives and the impact of non-deductible foreign exchange losses, the
underlying effective tax rate for ordinary income in the nine months ended September 30, 2015 was 53% (2014: 50%).
Currency Translation
Deferred tax balances are subject to remeasurement for changes in currency exchange rates each period. The most significant balances are Argentinean net
deferred tax liabilities. In the nine months ended September 30, 2015 and 2014, tax expense of $18 million and $50 million respectively primarily arose from translation losses on tax balances in Argentina, due to the weakening of the
Argentinean peso against the US dollar. These translation losses are included within deferred income tax expense/recovery.
De-Recognition of a Deferred Tax Asset
In second quarter 2015, we recorded a deferred tax expense of $20 million related to de-recognition of a deferred tax asset in Pueblo Viejo.
Restructure of Internal Debt to Equity
In second quarter 2014,
a deferred tax recovery of $112 million arose from a restructure of internal debt to equity in subsidiary corporations, which resulted in the release of a deferred tax liability and a net increase in deferred tax assets.
|
|
|
|
|
| BARRICK THIRD QUARTER 2015 |
|
74 |
|
NOTES TO FINANCIAL STATEMENTS (UNAUDITED) |
13 > CASH FLOW – OTHER ITEMS
|
|
|
|
|
|
|
|
|
| A Operating Cash Flows – Other Items |
|
For the three months ended September 30 |
|
For the nine months ended September 30 |
| |
| |
|
2015 |
|
2014 |
|
2015 |
|
2014 |
| |
| Adjustments for non-cash income statement items: |
|
|
|
|
|
|
|
|
| Net currency translation (gains) losses |
|
$ (43) |
|
$ 30 |
|
$ (12) |
|
$ 140 |
| RSU (recovery) expense |
|
(8) |
|
(2) |
|
8 |
|
10 |
| Stock option expense (recovery) |
|
1 |
|
1 |
|
2 |
|
(6) |
| Change in estimate of rehabilitation costs at closed mines |
|
(8) |
|
(4) |
|
(19) |
|
45 |
| Net inventory impairment charges (note 15) |
|
63 |
|
15 |
|
151 |
|
56 |
| Cash flow arising from changes in: |
|
|
|
|
|
|
|
|
| Accounts receivable |
|
(26) |
|
(14) |
|
28 |
|
(13) |
| Other current assets |
|
19 |
|
(10) |
|
(42) |
|
4 |
| Accounts payable |
|
27 |
|
(38) |
|
(53) |
|
(332) |
| Other current liabilities |
|
(26) |
|
34 |
|
(109) |
|
12 |
| Other assets and liabilities |
|
(132) |
|
(103) |
|
(125) |
|
(193) |
| Settlement of rehabilitation obligations |
|
(19) |
|
(29) |
|
(69) |
|
(68) |
| |
| Other net operating activities |
|
$ (152) |
|
$ (120) |
|
$ (240) |
|
$ (345) |
| |
|
|
|
| B Investing Cash Flows – Other Items |
|
For the three months ended September 30 |
|
For the nine months ended September 30 |
| |
| |
|
2015 |
|
2014 |
|
2015 |
|
2014 |
| |
| Value added tax recoverable on project capital expenditures |
|
$ - |
|
$ - |
|
$ - |
|
$ (58) |
| Other |
|
(3) |
|
(2) |
|
(10) |
|
(23) |
| |
| Other net investing activities |
|
$ (3) |
|
$ (2) |
|
$ (10) |
|
$ (81) |
| |
|
|
|
|
|
| BARRICK THIRD QUARTER 2015 |
|
75 |
|
NOTES TO FINANCIAL STATEMENTS (UNAUDITED) |
14 > EQUITY ACCOUNTING METHOD INVESTMENT CONTINUITY
|
|
|
|
|
|
|
|
|
|
|
|
|
| |
|
Kabanga |
|
|
Jabal Sayid1 |
|
|
Total |
|
| |
|
| At January 1, 2014 |
|
|
$ 27 |
|
|
|
$ - |
|
|
|
$ 27 |
|
| Funds invested |
|
|
1 |
|
|
|
178 |
|
|
|
179 |
|
| |
|
| At December 31, 2014 |
|
|
$ 28 |
|
|
|
$ 178 |
|
|
|
$ 206 |
|
| Funds invested |
|
|
2 |
|
|
|
- |
|
|
|
2 |
|
| |
|
| At September 30, 2015 |
|
|
$ 30 |
|
|
|
$ 178 |
|
|
|
$ 208 |
|
| |
|
| Publicly traded |
|
|
No |
|
|
|
No |
|
|
|
|
|
| |
|
| 1 |
A $164 million non-interest bearing shareholder loan due from the Jabal Sayid JV as a result of the divestment of 50 percent interest in Jabal Sayid is presented as
part of Other Assets in the Consolidated Financial Statements. |
15 > INVENTORIES
|
|
|
|
|
|
|
|
|
| |
|
Gold |
|
Copper |
| |
|
As at September 30,
2015 |
|
As at December 31,
2014 |
|
As at September 30,
2015 |
|
As at December 31,
2014 |
| |
| Raw materials |
|
|
|
|
|
|
|
|
| Ore in stockpiles |
|
$ 1,881 |
|
$ 2,036 |
|
$ 50 |
|
$ 182 |
| Ore on leach pads |
|
417 |
|
357 |
|
- |
|
392 |
| Mine operating supplies |
|
750 |
|
875 |
|
77 |
|
132 |
| Work in process |
|
240 |
|
245 |
|
- |
|
7 |
| Finished products |
|
|
|
|
|
|
|
|
| Gold doré |
|
55 |
|
129 |
|
- |
|
- |
| Copper cathode |
|
- |
|
- |
|
- |
|
12 |
| Copper concentrate |
|
- |
|
- |
|
10 |
|
28 |
| Gold concentrate |
|
8 |
|
11 |
|
- |
|
- |
| |
|
|
$ 3,351 |
|
$ 3,653 |
|
$ 137 |
|
$ 753 |
| Non-current ore in stockpiles1 |
|
(1,473) |
|
(1,584) |
|
(9) |
|
(100) |
| |
|
|
$ 1,878 |
|
$ 2,069 |
|
$ 128 |
|
$ 653 |
| |
| 1 |
Ore that we do not expect to process in the next 12 months is classified as long-term. |
|
|
|
|
|
|
|
|
|
|
|
|
|
|
|
|
|
| |
|
For the three months ended
September 30 |
|
|
For the nine months ended
September 30 |
|
| |
|
| |
|
2015 |
|
|
2014 |
|
|
2015 |
|
|
2014 |
|
| |
|
| Inventory impairment charges1 |
|
|
$ 63 |
|
|
|
$ 15 |
|
|
|
$ 152 |
|
|
|
$ 56 |
|
| Inventory impairment charges
reversed |
|
|
- |
|
|
|
- |
|
|
|
(1) |
|
|
|
- |
|
| |
|
| 1 |
Impairment charges in 2015 primarily relates to production costs exceeding net realizable value at Cortez as well as mine operating supplies obsolescence across the sites. |
Purchase Commitments
At September 30, 2015, we had
purchase obligations for supplies and consumables of $ 1,011 million.
|
|
|
|
|
| BARRICK THIRD QUARTER 2015 |
|
76 |
|
NOTES TO FINANCIAL STATEMENTS (UNAUDITED) |
16 > PROPERTY, PLANT AND EQUIPMENT
|
|
|
|
|
|
|
|
|
| |
|
As at September 30,
2015 |
|
|
As at December 31,
2014 |
|
| |
|
| Depreciable assets |
|
|
$ 13,940 |
|
|
|
$ 14,947 |
|
| Non-depreciable
assets |
|
|
|
|
|
|
|
|
| Projects |
|
|
|
|
|
|
|
|
| Pascua-Lama |
|
|
1,801 |
|
|
|
1,910 |
|
| Cerro Casale1 |
|
|
444 |
|
|
|
444 |
|
| Donlin Gold |
|
|
146 |
|
|
|
138 |
|
| Construction-in-progress2 |
|
|
689 |
|
|
|
1,490 |
|
| Acquired mineral resources and exploration potential |
|
|
130 |
|
|
|
264 |
|
| |
|
|
|
|
$ 17,150 |
|
|
|
$ 19,193 |
|
| |
|
| 1 |
Amount presented on a 100% basis and includes our partner’s non-controlling interest. |
| 2 |
Represents assets under construction at our operating mine sites. |
Capital Commitments
In addition to entering into various operational commitments in the normal course of business, we had capital commitments of $177 million at
September 30, 2015.
17 > GOODWILL
|
|
|
|
|
|
|
|
|
| |
|
As at September 30,
2015 |
|
|
As at December 31,
2014 |
|
| |
|
| Goldstrike |
|
|
$730 |
|
|
|
$730 |
|
| Cortez |
|
|
869 |
|
|
|
869 |
|
| Pueblo Viejo |
|
|
412 |
|
|
|
412 |
|
| Lagunas Norte |
|
|
247 |
|
|
|
247 |
|
| Veladero |
|
|
195 |
|
|
|
195 |
|
| Turquoise Ridge |
|
|
528 |
|
|
|
528 |
|
| Hemlo |
|
|
63 |
|
|
|
63 |
|
| Kalgoorlie |
|
|
71 |
|
|
|
71 |
|
|
Cowal1 |
|
|
- |
|
|
|
64 |
|
|
Porgera2 |
|
|
- |
|
|
|
71 |
|
|
Zaldivar3 |
|
|
- |
|
|
|
1,176 |
|
| |
|
| Total carrying amount |
|
|
$ 3,115 |
|
|
|
$ 4,426 |
|
| |
|
| 1 |
As a result of the disposition of Cowal, its goodwill was derecognized. Refer to note 4B. |
| 2 |
As a result of losing control of Porgera, its goodwill was derecognized. Refer to note 4B. |
| 3 |
At September 30, 2015, Zaldivar was classified as held for sale and its goodwill was presented in assets held for sale after an impairment of $476 million. Refer to note 4A.
|
18 > IMPAIRMENT OF GOODWILL AND OTHER ASSETS
In accordance with our accounting policy, goodwill is tested for impairment in the fourth quarter and also when there is an indicator of impairment.
Non-current assets are tested for impairment when events or changes in circumstances suggest that the carrying amount may not be recoverable. Refer to note 20 of the 2014 annual consolidated financial statements for further information.
Summary of impairments (reversals)
For the three months ended
September 30, 2015, we recorded impairment reversals of $24 million (2014: $18 million losses) for non-current assets and $476 million (2014: $nil million) for goodwill, as summarized in the following table:
|
|
|
|
|
|
|
|
|
|
|
|
|
|
|
|
|
| |
|
For the three months
ended September 30 |
|
|
For the nine months
ended September 30 |
|
| |
|
| |
|
2015 |
|
|
2014 |
|
|
2015 |
|
|
2014 |
|
| |
|
| Copper goodwill |
|
|
$ - |
|
|
|
$ - |
|
|
|
$ - |
|
|
|
$ 316 |
|
| Jabal Sayid |
|
|
- |
|
|
|
- |
|
|
|
- |
|
|
|
198 |
|
| Lumwana |
|
|
- |
|
|
|
- |
|
|
|
- |
|
|
|
4 |
|
| Cortez |
|
|
- |
|
|
|
- |
|
|
|
2 |
|
|
|
- |
|
| Goldstrike |
|
|
- |
|
|
|
- |
|
|
|
8 |
|
|
|
- |
|
| Golden Sunlight |
|
|
- |
|
|
|
- |
|
|
|
6 |
|
|
|
- |
|
| Zaldivar goodwill |
|
|
476 |
|
|
|
- |
|
|
|
476 |
|
|
|
- |
|
| Pascua-Lama |
|
|
(18) |
|
|
|
1 |
|
|
|
(18) |
|
|
|
1 |
|
| Pueblo Viejo |
|
|
(7) |
|
|
|
13 |
|
|
|
11 |
|
|
|
(9) |
|
| Exploration (Kainantu) |
|
|
- |
|
|
|
- |
|
|
|
- |
|
|
|
7 |
|
| Other investments |
|
|
- |
|
|
|
- |
|
|
|
- |
|
|
|
16 |
|
| Other |
|
|
1 |
|
|
|
4 |
|
|
|
7 |
|
|
|
9 |
|
| |
|
| Total |
|
|
$ 452 |
|
|
|
$ 18 |
|
|
|
$ 492 |
|
|
|
$ 542 |
|
| |
|
Indicators of impairment
Third Quarter
2015
In third quarter 2015, the trading price of the company’s shares declined such that the carrying value of our net assets exceeded our
market capitalization, which is a potential indicator of impairment. We have reviewed our key assumptions, including long-term metal prices and discount rates, and believe that the decline in our share price is not representative of the fair value
of our business. Therefore, notwithstanding the specific items noted below, no other impairments were recognized in third quarter 2015. In fourth quarter 2015, as per our policy, we will perform our annual goodwill impairment test and will assess
any potential indicators of impairment.
|
|
|
|
|
| BARRICK THIRD QUARTER 2013 |
|
77 |
|
NOTES TO FINANCIAL STATEMENTS (UNAUDITED) |
In July 2015, the Zambian government passed legislation that amended the country’s mining tax regime.
This was an indicator of potential reversal of previous impairments recorded on our Lumwana mine in fourth quarter 2014. In third quarter 2015, we evaluated the Fair Value Less Costs of Disposal (“FVLCD”) and based on the current mine
plan, lower short-term copper prices and a higher observable discount rate offset the lower royalty rate. Therefore no reversal of impairment is required at the current time.
As at September 30, 2015, all of the assets and liabilities of Zaldívar were classified as held-for-sale as the transaction will result in a
loss of control. As the agreed selling price is lower than previously recognized carrying values, we recorded a goodwill impairment of $476 million. The agreed selling price was lower than our previous assessment of FVLCD due to lower short-term
copper prices, the impact of 10 months’ worth of production on the fair value and an increase in observable discount rates.
In third quarter
2015, a net reversal of $16M was recognized relating to the termination of contracts of certain leased assets at Pascua-Lama that had previously been impaired. They are now carried at their expected realizable value.
Second Quarter 2015
In second quarter 2015, we determined that
we expect to sell the Monte Rio power asset at our Pueblo Viejo mine. Power supply to Pueblo Viejo is not impacted by this disposition. In third quarter 2015, we entered into an agreement to sell the asset and recorded a partial reversal of this
impairment based on the agreed upon sales price. For the nine months ended September 30, 2015, we recorded an impairment loss of $11 million to reduce its carrying value down to its net realizable value.
2014
As at June 30, 2014, our Jabal Sayid project in
Saudi Arabia met the criteria as an asset held for sale. Accordingly, we were required to allocate goodwill from the Copper Operating Unit to Jabal Sayid and test the Jabal Sayid group of assets for impairment. We determined that the carrying value
exceeded the FVLCD, and consequently recorded $514 million in impairment charges, including the full amount of goodwill allocated on a relative fair value basis, of $316 million. Subsequent to quarter end, on July 13, 2014 we signed an
agreement to sell a 50% interest of Jabal Sayid for cash proceeds of $216 million.
We reached an agreement to sell a power-related asset at our Pueblo Viejo mine for proceeds that exceeded
its carrying value. This asset had previously been impaired in fourth quarter 2012 and therefore we recognized an impairment reversal of $9 million.
Key
assumptions
The key assumptions and estimates used in determining the FVLCD are related to commodity prices, discount rates, NAV multiples for
gold assets, operating costs, exchange rates and capital expenditures. In addition, assumptions related to comparable entities, market values per ounce and per pound and the inclusion of reserves and resources in market multiples calculations are
used. For further details refer to note 20 of the Annual Consolidated Financial Statements.
The key assumptions used in our impairment testing are
summarized in the table below:
|
|
|
|
|
|
|
|
|
| |
|
| |
|
Third Quarter
2015 |
|
|
Second Quarter
2014 |
|
| |
|
| Copper price per lb (long-term) |
|
|
$3.00 |
|
|
|
$3.25 |
|
| WACC - copper |
|
|
10% |
|
|
|
7%-9% |
|
| LOM years - copper |
|
|
23 |
|
|
|
14-24 |
|
| |
|
Sensitivities
Based on the
results of our last impairment test performed in fourth quarter 2014, the carrying value of the operating segments and CGUs that are most sensitive to the change in sales prices used in the annual test are:
|
|
|
|
|
| |
|
| As at September 30, 2015 |
|
Carrying value |
|
| |
|
|
Cortez1 |
|
|
$ 3,768 |
|
|
Zaldivar1,2 |
|
|
2,010 |
|
|
Pascua-Lama2 |
|
|
1,298 |
|
|
Veladero1 |
|
|
1,123 |
|
| Bald
Mountain2 |
|
|
517 |
|
| Cerro
Casale2 |
|
|
510 |
|
|
Lumwana2 |
|
|
349 |
|
| Round
Mountain2 |
|
|
173 |
|
| |
|
| 1 |
Carrying value includes goodwill. |
| 2 |
These CGUs have been impaired or had an impairment reversal in 2014 and therefore their fair value approximates carrying value.
|
|
|
|
|
|
| BARRICK THIRD QUARTER 2013 |
|
78 |
|
NOTES TO FINANCIAL STATEMENTS (UNAUDITED) |
19 > FINANCIAL INSTRUMENTS
Financial instruments include cash; evidence of ownership in an entity; or a contract that imposes an obligation on one party and conveys a right to a
second entity to deliver/receive cash or another financial instrument.
A Cash and Equivalents
Cash and equivalents include cash, term deposits, treasury bills and money market funds with original maturities of less than 90 days. Cash and
equivalents also include $449 million cash held at Acacia and Pueblo Viejo, which may not be readily deployed outside of Acacia and/or Pueblo Viejo.
B Debt
|
|
|
|
|
|
|
|
|
| |
|
As at September 30, 2015 |
|
|
As at December 31, 2014 |
|
| |
|
| 4.4%/5.7%
notes1 |
|
|
$ 2,182 |
|
|
|
$ 2,409 |
|
| 3.85%/5.25% notes |
|
|
1,985 |
|
|
|
1,983 |
|
| 5.80% notes |
|
|
395 |
|
|
|
395 |
|
| 5.75%/6.35% notes |
|
|
856 |
|
|
|
855 |
|
| Other fixed rate notes2 |
|
|
2,723 |
|
|
|
2,720 |
|
| Project financing |
|
|
644 |
|
|
|
850 |
|
| Capital
leases3 |
|
|
164 |
|
|
|
354 |
|
| Other debt obligations |
|
|
663 |
|
|
|
794 |
|
| 2.5%/4.10%/5.75% notes4 |
|
|
2,581 |
|
|
|
2,579 |
|
| Acacia credit facility5 |
|
|
128 |
|
|
|
142 |
|
| |
|
|
|
|
$ 12,321 |
|
|
|
$ 13,081 |
|
| Less: current portion |
|
|
(1,038) |
|
|
|
(333) |
|
| |
|
|
|
|
$ 11,283 |
|
|
|
$ 12,748 |
|
| |
|
| 1 |
Consists of $2.2 billion in conjunction with our wholly-owned subsidiary Barrick North America Finance LLC (“BNAF”). This consists of $1.35 billion
of BNAF notes due 2021 and $850 million of BNAF notes due 2041. We provide an unconditional and irrevocable guarantee on all BNAF Notes and generally provide such guarantees on all BNAF notes issued, which will rank equally with our other unsecured
and unsubordinated obligations. |
| 2 |
Consists of $2.8 billion in conjunction with our wholly-owned subsidiary Barrick North America Finance LLC (“BNAF”) and our wholly-owned subsidiary
Barrick (PD) Australia Finance Pty Ltd. (“BPDAF”). This consists of $500 million of BNAF notes due 2018, $750 million of BGC notes due 2019, $400 million of BPDAF notes due 2020, $250 million of BNAF notes due 2038 and $850 million of
BPDAF notes due 2039. We provide an unconditional and irrevocable guarantee on all BNAF and BPDAF notes and generally provide such guarantees on all BNAF and BPDAF notes issued, which will rank equally with our other unsecured and unsubordinated
obligations. |
| 3 |
Consists primarily of capital leases at Pascua-Lama $59 million and Lagunas Norte $97 million (2014: $199 million and $123 million, respectively).
|
| 4 |
Consists of $2.6 billion in conjunction with our wholly-owned subsidiary Barrick North America Finance LLC (“BNAF”). This consists of $252 million
of BGC notes due 2018, $1.5 billion of BGC notes due 2023 and $850 million of BNAF notes due 2043. We provide an unconditional and irrevocable guarantee on all BNAF notes and generally provide such guarantees on all BNAF notes issued, which will
rank equally with our other unsecured and unsubordinated obligations. |
| 5 |
Consists of an export credit backed term loan facility. |
Jabal Sayid Financing Facility
On April 2, 2015,
Ma’aden Barrick Copper Company signed a financing agreement with the Saudi British Bank to finance the Jabal Sayid copper project (an equity method investment for Barrick) for SAR 750 million ($200 million USD). Barrick has provided a
guarantee equal to our proportionate ownership interest (50%).
|
|
|
|
|
| BARRICK THIRD QUARTER 2015 |
|
79 |
|
NOTES TO FINANCIAL STATEMENTS (UNAUDITED) |
C Derivative Instruments at September 30, 2015
|
|
|
|
|
|
|
|
|
|
|
|
|
|
|
|
|
|
|
|
|
|
|
|
|
|
|
|
|
| |
|
Notional amount by term to maturity |
|
|
Accounting classification by
notional amount |
|
|
|
|
|
|
|
|
|
| |
|
Within 1
year |
|
|
2 to 3
years |
|
|
4+ years |
|
|
Total |
|
|
Cash flow
hedge |
|
|
Non-hedge |
|
|
Fair value
(USD) |
|
| |
|
| US dollar interest rate contracts |
|
|
|
|
|
|
|
|
|
|
|
|
|
|
|
|
|
|
|
|
|
|
|
|
|
|
|
|
| Total receive - float swap positions |
|
|
$ 28 |
|
|
|
$ 57 |
|
|
|
$ 43 |
|
|
|
$ 128 |
|
|
|
$ 128 |
|
|
|
$ - |
|
|
|
$ - |
|
| |
|
| Currency contracts |
|
|
|
|
|
|
|
|
|
|
|
|
|
|
|
|
|
|
|
|
|
|
|
|
|
|
|
|
| A$:US$ contracts (A$ millions) |
|
|
210 |
|
|
|
- |
|
|
|
- |
|
|
|
210 |
|
|
|
160 |
|
|
|
50 |
|
|
|
(68) |
|
| C$:US$ contracts (C$ millions) |
|
|
60 |
|
|
|
- |
|
|
|
- |
|
|
|
60 |
|
|
|
60 |
|
|
|
- |
|
|
|
(8) |
|
| CLP:US$ contracts (CLP millions) |
|
|
25,500 |
|
|
|
- |
|
|
|
- |
|
|
|
25,500 |
|
|
|
22,513 |
|
|
|
2,987 |
|
|
|
(6) |
|
| ZAR:US$ contracts (ZAR millions) |
|
|
93 |
|
|
|
- |
|
|
|
- |
|
|
|
93 |
|
|
|
86 |
|
|
|
7 |
|
|
|
(1) |
|
| |
|
| Commodity contracts |
|
|
|
|
|
|
|
|
|
|
|
|
|
|
|
|
|
|
|
|
|
|
|
|
|
|
|
|
| Fuel contracts (thousands of barrels)1 |
|
|
2,889 |
|
|
|
3,592 |
|
|
|
270 |
|
|
|
6,751 |
|
|
|
6,240 |
|
|
|
511 |
|
|
|
(213) |
|
| |
|
| 1 |
Fuel contracts represent a combination of WTI swaps and Brent options. These derivatives hedge physical supply contracts based on the price of fuel across our
operating mine sites plus a spread. WTI represents West Texas Intermediate and BRENT represents Brent Crude Oil. |
Fair Values of Derivative
Instruments
|
|
|
|
|
|
|
|
|
|
|
|
|
|
|
|
|
|
|
|
|
|
|
| |
|
Asset Derivatives |
|
|
Liability Derivatives |
|
|
|
|
|
| |
|
Consolidated
Balance Sheet
Classification |
|
Fair Value at
September 30,
2015 |
|
|
Fair Value at
December 31,
2014 |
|
|
Consolidated
Balance Sheet
Classification |
|
|
Fair Value at
September 30,
2015 |
|
|
Fair Value at
December 31,
2014 |
|
| |
|
| Derivatives designated as hedging instruments |
|
|
|
|
|
|
|
|
|
|
|
|
|
|
|
|
|
|
|
|
|
|
| US dollar interest rate contracts |
|
Other assets |
|
|
$ - |
|
|
|
$ 2 |
|
|
|
Other liabilities |
|
|
|
$ - |
|
|
|
$ 1 |
|
| Currency contracts |
|
Other assets |
|
|
- |
|
|
|
- |
|
|
|
Other liabilities |
|
|
|
54 |
|
|
|
71 |
|
| Commodity
contracts1 |
|
Other assets |
|
|
- |
|
|
|
- |
|
|
|
Other liabilities |
|
|
|
201 |
|
|
|
- |
|
| |
|
| Total derivatives classified as hedging instruments |
|
|
|
|
$ - |
|
|
|
$ 2 |
|
|
|
|
|
|
|
$ 255 |
|
|
|
$ 72 |
|
| |
|
| Derivatives not designated as hedging instruments |
|
|
|
|
|
|
|
|
|
|
|
|
|
|
|
|
|
|
|
|
|
|
| US dollar interest rate contracts |
|
Other assets |
|
|
$ - |
|
|
|
$ - |
|
|
|
Other liabilities |
|
|
|
$ - |
|
|
|
$ - |
|
| Currency contracts |
|
Other assets |
|
|
1 |
|
|
|
4 |
|
|
|
Other liabilities |
|
|
|
30 |
|
|
|
30 |
|
| Commodity contracts |
|
Other assets |
|
|
- |
|
|
|
3 |
|
|
|
Other liabilities |
|
|
|
12 |
|
|
|
185 |
|
| |
|
| Total derivatives not designated as hedging instruments |
|
|
|
|
$ 1 |
|
|
|
$ 7 |
|
|
|
|
|
|
|
$ 42 |
|
|
|
$ 215 |
|
| |
|
| Total derivatives |
|
|
|
|
$ 1 |
|
|
|
$ 9 |
|
|
|
|
|
|
|
$ 297 |
|
|
|
$ 287 |
|
| |
|
| 1 |
Majority of our fuel contracts are now being designated as hedging instruments as a result of adoption of IFRS 9. These contracts did not qualify for hedge
accounting prior to Jan 1, 2015. |
|
|
|
|
|
| BARRICK THIRD QUARTER 2015 |
|
80 |
|
NOTES TO FINANCIAL STATEMENTS (UNAUDITED) |
As of September 30, 2015, we had 21 counterparties to our derivative positions. We proactively manage
our exposure to individual counterparties in order to mitigate both credit and liquidity risks. We are in a net liability position with all counterparties, for a total net liability of $296 million. On an ongoing basis, we monitor our exposures and
ensure that none of the counterparties with which we hold outstanding contracts has declared insolvency.
Cash Flow Hedge Gains (Losses) in Accumulated Other
Comprehensive Income
|
|
|
|
|
|
|
|
|
|
|
|
|
|
|
|
|
|
|
|
|
|
|
|
|
|
|
|
|
|
|
|
|
| |
|
|
|
|
|
|
|
|
|
|
|
|
|
|
|
|
|
|
|
Interest rate |
|
|
|
|
| |
|
Commodity price hedges |
|
|
Currency hedges |
|
|
hedges |
|
|
|
|
| |
|
Gold/Silver |
|
|
Copper |
|
|
Fuel |
|
|
Operating
costs |
|
|
Administration/
other costs |
|
|
Capital
expenditures |
|
|
Long-term
debt |
|
|
Total |
|
| |
|
| At December 31, 2014 |
|
|
$ 18 |
|
|
|
$ - |
|
|
|
$ - |
|
|
|
$ (79) |
|
|
|
$ (3) |
|
|
|
$ - |
|
|
|
$ (25) |
|
|
|
$ (89) |
|
| Impact of adopting IFRS 9 on January 1, 2015 |
|
|
- |
|
|
|
- |
|
|
|
- |
|
|
|
(5) |
|
|
|
- |
|
|
|
- |
|
|
|
- |
|
|
|
(5) |
|
| Effective portion of change in fair value of hedging instruments |
|
|
- |
|
|
|
- |
|
|
|
(94) |
|
|
|
(27) |
|
|
|
(15) |
|
|
|
(1) |
|
|
|
(1) |
|
|
|
(138) |
|
| Transfers to earnings: |
|
|
|
|
|
|
|
|
|
|
|
|
|
|
|
|
|
|
|
|
|
|
|
|
|
|
|
|
|
|
|
|
| On recording hedged items in earnings/PP&E1 |
|
|
(4) |
|
|
|
- |
|
|
|
10 |
|
|
|
54 |
|
|
|
11 |
|
|
|
1 |
|
|
|
2 |
|
|
|
74 |
|
| |
|
| At September 30, 2015 |
|
|
$ 14 |
|
|
|
$ - |
|
|
|
$ (84) |
|
|
|
$ (57) |
|
|
|
$ (7) |
|
|
|
$ - |
|
|
|
$ (24) |
|
|
|
$ (158) |
|
| |
|
| 1 |
Realized gains (losses) on qualifying currency hedges of capital expenditures are transferred from OCI to PP&E on settlement. |
D Gains (Losses) on Non-hedge Derivatives
|
|
|
|
|
|
|
|
|
|
|
|
|
|
|
|
|
| |
|
For the three months
ended September 30 |
|
|
For the nine months
ended September 30 |
|
| |
|
| |
|
2015 |
|
|
2014 |
|
|
2015 |
|
|
2014 |
|
| |
|
|
|
|
|
|
| Commodity contracts |
|
|
|
|
|
|
|
|
|
|
|
|
|
|
|
|
| Gold |
|
|
$ - |
|
|
|
$ 1 |
|
|
|
$ - |
|
|
|
$ 1 |
|
| Silver |
|
|
- |
|
|
|
- |
|
|
|
5 |
|
|
|
- |
|
| Copper |
|
|
- |
|
|
|
- |
|
|
|
- |
|
|
|
1 |
|
| Fuel |
|
|
(6) |
|
|
|
(52) |
|
|
|
(6) |
|
|
|
20 |
|
| Currency contracts |
|
|
(6) |
|
|
|
(9) |
|
|
|
(22) |
|
|
|
(11) |
|
| |
|
|
|
|
$ (12) |
|
|
|
$ (60) |
|
|
|
$ (23) |
|
|
|
$ 11 |
|
| |
|
|
|
|
|
|
| Gains (losses) attributable to copper option collar hedges1 |
|
|
$ - |
|
|
|
$ (2) |
|
|
|
$ - |
|
|
|
$ (4) |
|
| Gains (losses) attributable to currency option collar hedges1 |
|
|
- |
|
|
|
(3) |
|
|
|
- |
|
|
|
(1) |
|
| Hedge ineffectiveness |
|
|
- |
|
|
|
- |
|
|
|
- |
|
|
|
(6) |
|
| |
|
|
|
|
$ - |
|
|
|
$ (5) |
|
|
|
$ - |
|
|
|
$ (11) |
|
| |
|
|
|
|
$ (12) |
|
|
|
$ (65) |
|
|
|
$ (23) |
|
|
|
$ - |
|
| |
|
| 1 |
Represents unrealized gains (losses) attributable to changes in the time value of the collars, which were excluded from the hedge effectiveness assessment in 2014.
|
20 > FAIR VALUE MEASUREMENTS
A Assets and Liabilities Measured at Fair Value on a Recurring Basis
|
|
|
|
|
|
|
|
|
| As at September 30,
2015 |
|
Quoted
prices in
active
markets
for
identical
assets
(Level 1) |
|
Significant
other
observable
inputs
(Level 2) |
|
Significant
unobservable
inputs
(Level 3) |
|
Aggregate
fair value |
| |
| Cash and equivalents |
|
$ 3,317 |
|
$ - |
|
$ - |
|
$ 3,317 |
| Other investments |
|
8 |
|
- |
|
- |
|
8 |
| Derivatives |
|
- |
|
(296) |
|
- |
|
(296) |
| Receivables from provisional copper and gold sales |
|
- |
|
82 |
|
- |
|
82 |
| |
|
|
$ 3,325 |
|
$ (214) |
|
$ - |
|
$ 3,111 |
| |
|
|
|
|
|
| BARRICK THIRD QUARTER 2015 |
|
81 |
|
NOTES TO FINANCIAL STATEMENTS (UNAUDITED) |
B Fair Values of Financial Assets and Liabilities
|
|
|
|
|
|
|
|
|
|
|
|
|
|
|
|
|
| |
|
As at Sept. 30, 2015 |
|
|
As at Dec. 31, 2014 |
|
| |
|
| |
|
Carrying
amount |
|
|
Estimated
fair value |
|
|
Carrying
amount |
|
|
Estimated
fair value |
|
| |
|
| Financial assets |
|
|
|
|
|
|
|
|
|
|
|
|
|
|
|
|
| Other receivables |
|
|
$ 411 |
|
|
|
$ 411 |
|
|
|
$ 385 |
|
|
|
$ 385 |
|
| Other investments1 |
|
|
8 |
|
|
|
8 |
|
|
|
35 |
|
|
|
35 |
|
| Derivative assets |
|
|
1 |
|
|
|
1 |
|
|
|
9 |
|
|
|
9 |
|
| |
|
|
|
|
$ 420 |
|
|
|
$ 420 |
|
|
|
$ 429 |
|
|
|
$ 429 |
|
| |
|
| Financial liabilities |
|
|
|
|
|
|
|
|
|
|
|
|
|
|
|
|
| Debt2 |
|
|
$ 12,321 |
|
|
|
$ 11,584 |
|
|
|
$ 13,081 |
|
|
|
$ 13,356 |
|
| Derivative liabilities |
|
|
297 |
|
|
|
297 |
|
|
|
287 |
|
|
|
287 |
|
| Other liabilities |
|
|
855 |
|
|
|
855 |
|
|
|
360 |
|
|
|
360 |
|
| |
|
|
|
|
$ 13,473 |
|
|
|
$ 12,736 |
|
|
|
$ 13,728 |
|
|
|
$ 14,003 |
|
| |
|
| 1 |
Recorded at fair value. Quoted market prices are used to determine fair value. |
| 2 |
Debt is generally recorded at amortized cost. The fair value of debt is primarily determined using quoted market prices. Balance includes both current and long- term portions of debt. |
We do not offset financial assets with financial liabilities.
Valuation Techniques
Other investments
The fair value of other investments is determined based on the closing price of each security at the balance sheet date. The closing price is a quoted
market price obtained from the exchange that is the principal active market for the particular security, and therefore other investments are classified within Level 1 of the fair value hierarchy.
Derivative Instruments
The fair value of derivative
instruments is determined using either present value techniques or option pricing models that utilize a variety of inputs that are a combination of quoted prices and market-corroborated inputs. The fair value of all our derivative contracts includes
an adjustment for credit risk. For counterparties in a net asset position, credit risk is based upon the observed credit default swap spread for each particular counterparty, as appropriate. For counterparties in a net liability position, credit
risk is based upon Barrick’s observed credit default swap spread. The fair value of US dollar interest rate and currency swap contracts is determined by discounting contracted cash flows using a discount rate derived from observed LIBOR and
swap rate curves and CDS rates. In the case of currency contracts, we convert non-US dollar cash flows into US dollars using an exchange rate derived from currency swap curves and CDS rates. The fair value of commodity forward contracts is
determined by discounting contractual cash flows using a discount rate derived from observed LIBOR and swap rate curves and CDS rates. Contractual cash flows are calculated using a forward pricing curve derived from observed forward prices for
each commodity. Derivative instruments are classified within Level 2 of the fair value hierarchy.
Receivables from Provisional Copper and Gold Sales
The fair
value of receivables rising from copper and gold sales contracts that contain provisional pricing mechanisms is determined using the appropriate quoted forward price from the exchange that is the principal active market for the particular metal. As
such, these receivables, which meet the definition of an embedded derivative, are classified within Level 2 of the fair value hierarchy.
C Assets
Measured at Fair Value on a Non-Recurring Basis
|
|
|
|
|
|
|
|
|
|
|
|
|
|
|
|
|
| As at September 30,
2015 |
|
Quoted
prices in active
markets for
identical assets
(Level 1) |
|
|
Significant
other observable
inputs (Level 2) |
|
|
Significant
unobservable inputs
(Level 3) |
|
|
Aggregate
fair value |
|
| |
|
| Property, plant and equipment1 |
|
|
$ - |
|
|
|
$ - |
|
|
|
$ 125 |
|
|
|
$ 125 |
|
| Goodwill2 |
|
|
- |
|
|
|
- |
|
|
|
700 |
|
|
|
700 |
|
| |
|
| 1 |
Property, plant and equipment were written down by $16 million which was included in earnings during the nine months ended September 30, 2015 to their fair value less costs of disposal of $125 million.
|
| 2 |
Goodwill relating to the Zaldivar mine was written down by $476 million which was included in earnings this period, to its fair value of $700 million. |
21 > CAPITAL STOCK
A Authorized Capital Stock
Our authorized capital stock includes an unlimited number of common shares (issued 1,164,796,918 common shares); an unlimited number of first
preferred shares issuable in series (the first series is designated as the “First Preferred Shares, Series A” and consists of 10,000,000 first preferred shares (issued nil); the second series is designated as the “First Preferred
Shares, Series B” and consists of 10,000,000 first preferred shares (issued nil); and the third series is designated as the “ First Preferred Share, Series C Special Voting Share” and consists of 1 Special Voting Share (issued nil));
and an unlimited number of second preferred shares issuable in series (the first series is designated as the “Second Preferred Shares, Series A” and consists of 15,000,000 second preferred shares (issued nil)). Our common shares have no
par value.
|
|
|
|
|
| BARRICK THIRD QUARTER 2015 |
|
82 |
|
NOTES TO FINANCIAL STATEMENTS (UNAUDITED) |
B Dividends
The Company’s practice has been to declare dividends after a quarter end in the announcement of the results for the quarter. Dividends declared are
paid in the same quarter.
The Company implemented a dividend reinvestment plan in third quarter 2015 resulting in 127,160 common shares issued to
shareholders.
22 > NON-CONTROLLING INTERESTS
|
|
|
|
|
|
|
|
|
|
|
| |
|
Pueblo
Viejo |
|
Acacia |
|
Cerro
Casale |
|
Other |
|
Total |
| |
| At January 1, 2015 |
|
$ 1,521 |
|
$ 758 |
|
$ 319 |
|
$ 17 |
|
$2,615 |
| Share of income (loss) |
|
48 |
|
1 |
|
(3) |
|
(2) |
|
44 |
| Cash contributed |
|
- |
|
- |
|
2 |
|
31 |
|
33 |
| Increase (decrease) in non-controlling interest1 |
|
(90) |
|
(7) |
|
- |
|
2 |
|
(95) |
| |
| At September 30, 2015 |
|
$ 1,479 |
|
$ 752 |
|
$ 318 |
|
$ 48 |
|
$2,597 |
| |
| 1 |
Primarily represents disbursements made to non-controlling interest at Pueblo Viejo. |
23 > CONTINGENCIES
Certain conditions may exist as of the date the financial statements are issued that may result in a loss to the Company, but which will only be resolved
when one or more future events occur or fail to occur. The impact of any resulting loss from such matters affecting these financial statements and noted below may be material.
Except as noted below, no material changes have occurred with respect to the matters disclosed in Note 35 “Contingencies” to the Company’s
audited consolidated financial statements for the year ended December 31, 2014 (the “Audited Annual Financial Statements”), and no new contingencies have occurred that are material to the Company since the issuance of the Audited
Annual Consolidated Financial Statements.
The description set out below should be read in conjunction with Note 35 “Contingencies” to the
Audited Consolidated Financial Statements.
A) Litigation and Claims Update
U.S. Shareholder Class Action
On April 1, 2015, the Court
issued its ruling on the Defendants’ motion to dismiss. The Court dismissed the plaintiffs’ claims relating to the cost and scheduling of the Project. However, the Court allowed the plaintiffs’ claims relating to the environmental
risks of the Project and
alleged internal control failures to go forward. The Court denied Barrick’s motion for reconsideration of certain aspects of that ruling on June 2, 2015, and discovery is continuing in
the case.
Proposed Canadian Securities Class Actions
On
May 21, 2015, the Divisional Court affirmed the lower court decision that determined which of the competing counsel groups will take the lead in the Ontario litigation. The losing counsel group is seeking leave to appeal to the Court of Appeal
for Ontario.
Pascua-Lama - SMA Regulatory Sanctions
On
April 22, 2015, Chile’s environmental regulator reopened the administrative proceeding against Compañía Minera Nevada, Barrick’s Chilean subsidiary that holds the Chilean portion of the Pascua-Lama project, in accordance
with the Environmental Court Decision. CMN has filed a petition to limit the scope of this administrative proceeding to the original allegations before the environmental regulator at the time it issued the May 2013 Resolution. A decision from the
SMA is pending in this matter.
Also on April 22, 2015, CMN was notified that the SMA has initiated a new administrative proceeding for alleged
deviations from certain requirements of the Project’s environmental approval, including with respect to the Project’s environmental impact and a series of monitoring requirements. In May 2015, CMN submitted a compliance program to address
certain of the allegations and presented its defense to the remainder of the alleged deviations. The SMA rejected CMN’s proposed compliance program on June 24, 2015, and denied CMN’s administrative appeal of that decision on
July 31, 2015. On August 28, 2015, CMN appealed the SMA’s decision to the Environmental Court, which is expected to schedule a hearing in this matter. A decision from the SMA is pending on CMN’s defense to the remainder of the
alleged deviations. The new administrative proceeding against CMN is separate from the original administrative proceeding described above, and could result in additional sanctions including new administrative fines and/or the revocation of the
Project’s environmental permit.
Pascua-Lama - Environmental Damage Claim
On March 23, 2015, the Environmental Court ruled in favor of CMN in this matter, finding that the Pascua-Lama project has not damaged glaciers in the
Project area. The plaintiffs did not file an appeal and the matter is now closed.
|
|
|
|
|
| BARRICK THIRD QUARTER 2015 |
|
83 |
|
NOTES TO FINANCIAL STATEMENTS (UNAUDITED) |
Pueblo Viejo - Amparo Action
On June 25, 2015, the Trial Court rejected the Petitioner’s amparo action, finding that the Petitioner failed to produce evidence to
support his allegations. The Petitioner appealed the Trial Court’s decision to the Constitutional Court on July 21, 2015. On July 28, 2015, PVDC filed a motion to challenge the timeliness of this appeal as it was submitted after the
expiration of the applicable filing deadline.
Marinduque Complaint
On June 11, 2015, the Nevada Supreme Court affirmed the trial court’s decision to dismiss the action on the grounds of forum non
conveniens (improper choice of forum). The matter is now closed.
B) Other Contingencies Update
Veladero
On September 13, 2015, a valve on a leach pad
pipeline at the Company’s Veladero mine in San Juan Province, Argentina failed, resulting in a release of cyanide-bearing process solution into a nearby waterway through a diversion channel gate that was open at the time of the incident. Minera
Argentina Gold S.A. (“MAGSA”), Barrick’s Argentine subsidiary that operates the Veladero mine, notified regulatory authorities of the situation. Environmental monitoring was conducted by MAGSA and independent third parties following
the incident. The Company believes this monitoring demonstrates that the incident posed no risk to human health at downstream communities. A temporary restriction on the addition of new cyanide to the mine’s processing circuit was lifted on
September 24, 2015, and mine operations have returned to normal.
On October 9, 2015, the San Juan mining authority initiated an
administrative sanction process against MAGSA for alleged violations of the mining code relating to the valve failure and release of cyanide-bearing process solution. MAGSA submitted its response to these allegations on October 20, 2015. This
process is expected to result in a fine. No amounts have been recorded for any potential liability under this matter, as the Company cannot reasonably predict the outcome.
|
|
|
|
|
| BARRICK THIRD QUARTER 2015 |
|
84 |
|
NOTES TO FINANCIAL STATEMENTS (UNAUDITED) |
|
|
|
| HEAD OFFICE
Barrick Gold Corporation Brookfield Place
TD Canada Trust Tower 161 Bay Street, Suite 3700
Toronto, Ontario M5J 2S1
Telephone: +1 416 861-9911 Toll-free: 1-800-720-7415
Fax: +1 416 861-2492 Email:
investor@barrick.com Website: www.barrick.com
SHARES LISTED
ABX – The New York Stock Exchange
The Toronto Stock Exchange
INVESTOR CONTACTS
Angela Parr
Vice President Investor Relations
Telephone: +1 416 307-7426 Email:
aparr@barrick.com Susan Muir
Vice President Investor Communications
Telephone: +1 416 307-5107 Email:
s.muir@barrick.com |
|
TRANSFER AGENTS AND REGISTRARS
CST Trust Company P.O. Box 700, Postal Station B
Montreal, Quebec H3B 3K3 or
American Stock Transfer & Trust Company, LLC 6201 – 15
Avenue Brooklyn, New York 11219
Telephone: 1-800-387-0825 Fax: 1-888-249-6189
Email: inquiries@canstockta.com Website: www.canstockta.com
MEDIA CONTACT
Andy Lloyd Senior Vice President
Communications Telephone: +1 416 307-7414
Email: alloyd@barrick.com |
CAUTIONARY STATEMENT ON FORWARD-LOOKING INFORMATION
Certain information contained or incorporated by reference in this Third Quarter 2015 Report, including any information as to our
strategy, projects, plans or future financial or operating performance, constitutes “forward-looking statements”. All statements, other than statements of historical fact, are forward-looking statements. The words “believe”,
“expect”, “anticipate”, “contemplate”, “target”, “plan”, “intend”, “project”, “continue”, “budget”, “estimate”, “potential”,
“may”, “will”, “can”, “could” and similar expressions identify forward-looking statements. In particular, this Third Quarter Report 2015 contains forward-looking statements with respect to cash flow forecasts,
projected capital, operating and exploration expenditures, targeted cost and debt reductions, mine life and production rates, potential mineralization and metal or mineral recoveries, and information pertaining to Barrick’s Value Realization
project (including potential improvements to financial and operating performance and mine life at Barrick’s Cortez, Lagunas Norte and Pueblo Viejo mines that may result from certain Value Realization initiatives). Forward-looking statements are
necessarily based upon a number of estimates and assumptions that, while considered reasonable by the company in light of management’s experience and perception of current conditions and expected developments, are inherently subject to
significant business, economic and competitive uncertainties and contingencies. Known and unknown factors could cause actual results to differ materially from those projected in the forward-looking statements. Such factors include, but are not
limited to: fluctuations in the spot and forward price of gold, copper or certain other commodities (such as silver, diesel fuel, natural gas and electricity); the speculative nature of mineral exploration and development; changes in mineral
production performance, exploitation and exploration successes; risks associated with the fact that Value Realization initiatives are still in the early stages of evaluation and additional engineering and other analysis is required to fully assess
their impact; diminishing quantities or grades of reserves; increased costs, delays, suspensions and technical challenges associated with the construction of capital projects; operating or technical difficulties in connection with mining or
development activities, including disruptions in the maintenance or provision of required infrastructure and information technology systems; failure to comply with environmental and health and safety laws and regulations; timing of receipt of, or
failure to comply with, necessary permits and approvals; uncertainty whether some or all of the Value Realization initiatives will meet the company’s capital allocation objectives; the impact of global liquidity and credit availability on the
timing of cash flows and the values of assets and liabilities based on projected future cash flows; adverse changes in our credit ratings; the impact of inflation; fluctuations in the currency markets; changes in U.S. dollar interest rates; risks
arising from holding derivative instruments; changes in national and local government legislation, taxation, controls or regulations and/or changes in the administration of laws, policies and practices, expropriation or nationalization of property
and political or economic developments in Canada, the United States and other jurisdictions in which the company does or may carry on business in the future; damage to the company’s reputation due to the actual or perceived occurrence of any
number of events, including negative publicity with respect to the company’s handling of environmental matters or dealings with community groups, whether true or not; the possibility that future exploration results will not be consistent with
the
company’s expectations; risks that exploration data may be incomplete and considerable additional work may be required to complete further evaluation, including but not limited to drilling,
engineering and socio-economic studies and investment; risk of loss due to acts of war, terrorism, sabotage and civil disturbances; litigation; contests over title to properties, particularly title to undeveloped properties, or over access to water,
power and other required infrastructure; business opportunities that may be presented to, or pursued by, the company; our ability to successfully integrate acquisitions or complete divestitures; employee relations; increased costs and risks related
to the potential impact of climate change; availability and increased costs associated with mining inputs and labor; and the organization of our previously held African gold operations and properties under a separate listed company. In addition,
there are risks and hazards associated with the business of mineral exploration, development and mining, including environmental hazards, industrial accidents, unusual or unexpected formations, pressures, cave-ins, flooding and gold bullion, copper
cathode or gold or copper concentrate losses (and the risk of inadequate insurance, or inability to obtain insurance, to cover these risks).
Many of these uncertainties and contingencies can affect our actual results and could cause actual results to differ materially from
those expressed or implied in any forward-looking statements made by, or on behalf of, us. Readers are cautioned that forward-looking statements are not guarantees of future performance. All of the forward-looking statements made in this Third
Quarter 2015 Report are qualified by these cautionary statements. Specific reference is made to the most recent Form 40-F/Annual Information Form on file with the SEC and Canadian provincial securities regulatory authorities for a discussion of some
of the factors underlying forward-looking statements.
The company disclaims any intention or obligation to update or revise any
forward-looking statements whether as a result of new information, future events or otherwise, except as required by applicable law.
Barrick Gold (NYSE:ABX)
Historical Stock Chart
From Mar 2024 to Apr 2024

Barrick Gold (NYSE:ABX)
Historical Stock Chart
From Apr 2023 to Apr 2024
