Total SA 3Q 2016 -- Forecast
October 25 2016 - 7:33AM
Dow Jones News
FRANKFURT--The following is a summary of analysts' forecasts for
Total SA (TOT) third-quarter results, based on a poll of nine
analysts conducted by Dow Jones Newswires. Figures in million
dollars, EPS in dollar, target price in euro, output in thousand
barrel of oil equivalent per day (kboe/d), according to IFRS).
Earnings figures are scheduled to be released October 28.
===
                Net income       EPS
3rd Quarter       adjusted  adjusted   Output
AVERAGE              1,938      0.81    2,421
Prev. Year           2,756      1.17    2,342
+/- in %               -30       -31     +3.4
Prev. Quarter        2,174      0.90    2,424
+/- in %               -11       -10     -0.1

MEDIAN               2,001      0.84    2,415
Maximum              2,061      0.87    2,451
Minimum              1,580      0.63    2,394
Amount                   9         6        9

Barclays             1,863        --    2,407
Deutsche Bank        2,030      0.86    2,450
Goldman Sachs        2,053      0.87    2,435
Jefferies            2,001      0.83    2,394
Kepler Cheuvreux     1,868        --    2,410
Morgan Stanley       1,978      0.83    2,415
Oddo                 2,012        --    2,415
Societe Generale     2,061      0.84    2,451
UBS                  1,580      0.63    2,408

            Target price  Rating
AVERAGE            48.53  positive 5
Prev. Quarter      46.55  neutral  2
+/- in %            +4.3  negative 0

MEDIAN             47.70
Maximum            55.00
Minimum            44.00
Amount                 7

Barclays           55.00  Overweight
Deutsche Bank      49.00  Buy
Goldman Sachs      47.70  Buy
Kepler Cheuvreux   47.00  Buy
Oddo               47.00  Neutral
Societe Generale   50.00  Buy
UBS                44.00  Neutral
===
Year-earlier figures are as adjusted by the company.
DJG/err
(END) Dow Jones Newswires
October 25, 2016 07:18 ET (11:18 GMT)
Copyright (c) 2016 Dow Jones & Company, Inc.
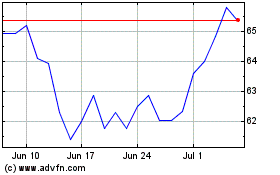
TotalEnergies (EU:TTE)
Historical Stock Chart
From Mar 2024 to Apr 2024

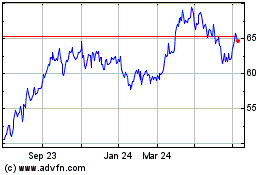
TotalEnergies (EU:TTE)
Historical Stock Chart
From Apr 2023 to Apr 2024
