The Best and Worst Performing Dividend ETFs of 2014
December 15 2014 - 7:00AM
ETFDB
2014 took investors on another wild ride, as markets continued
their impressive bull run. Despite a slump in October that had many
calling for a prolonged correction, equities resumed their bullish
pattern and are up over 12% for the year. It was also a year where
dividend-paying ETFs remained in the limelight. Though the Fed has
hinted at raising rates, there still is no definitive timeline for
when rates will climb from their near-zero levels. With that in
mind, investors have been searching for yield to add a steady
income stream to their portfolios [for more ETF news and analysis subscribe to our
free ETFdb Daily Roundup].
Below, we outline the best and worst performing dividend ETFs
this year. Note that the funds chosen are classified as
dividend-focused and not simply ones that pay a dividend.
The Best Performers google.load('visualization', '1', {packages:
['corechart']}); function drawVisualization() { // Create and
populate the data table. var data =
google.visualization.arrayToDataTable([ ['ETF', 'YTD
Performance',], ['ETRACS Monthly Pay 2x Leveraged Dow Jones Select
Dividend Index ETN (DVYL)', 28.0], ['ETRACS Monthly Pay 2x
Leveraged S&P Dividend ETN (SDYL)', 27.1], ['S&P 500 High
Dividend Portfolio (SPHD)', 19.9], ['Ultra Dividend Fund (RDIV)',
19.7], ['SuperDividend U.S. ETF (DIV)', 19.2], ['Sector Dividend
Dogs ETF (SDOG)', 17.0], ['High Yield Dividend Achievers (PEY)',
16.2], ['S&P 500 Aristocrats ETF (NOBL)', 15.6], ['Equity
Income Fund (DHS)', 15.5], ['Value Line Dividend Index Fund (FVD)',
15.2], ]); var formatter = new google.visualization.NumberFormat(
{suffix: "%"}); formatter.format(data,1); var options = {
title:"Best Performing Dividend ETFs of 2014", width:600,
height:400, hAxis: {title: ""}, colors: ["green"] }; // Create and
draw the visualization. new
google.visualization.ColumnChart(document.getElementById('visualization105372')).
draw(data, options); } google.setOnLoadCallback(drawVisualization);
With equity markets charging forward, two leveraged funds take
the top spot in 2014. Note that while these funds can provide
stellar returns in bear markets, they have the potential for big
losses in bear stretches. All 10 of these ETFs outperformed
the SPDR S&P 500 ETF (SPY), all while providing a
dividend-focused strategy for investors [see also The Best and
Worst Performing Dividend ETFs of 2013].
The Worst Performers google.load('visualization', '1', {packages:
['corechart']}); function drawVisualization() { // Create and
populate the data table. var data =
google.visualization.arrayToDataTable([ ['ETF', 'YTD
Performance',], ['Global Natural Resources Fund (GNAT)', -15.0],
['Low Volatility Emerging Markets Dividend ETF (HILO)', -9.8],
['Emerging Markets Equity Income Fund (DEM)', -8.3], ['Commodity
Country Equity Fund (CCXE)', -7.5], ['Europe SmallCap Dividend Fund
(DFE)', -7.5], ['International SmallCap Fund (DLS)', -7.2],
['iShares Emerging Markets Dividend ETF (DVYE)', -5.8], ['Australia
Dividend Fund (AUSE)', -4.3], ['SPDR S&P Emerging Markets
Dividend ETF (EDIV)', -4.1], ['S&P Global Dividend
Opportunities Index ETF (LVL)', -3.9], ]); var formatter = new
google.visualization.NumberFormat( {suffix: "%"});
formatter.format(data,1); var options = { title:"Worst Performing
Dividend ETFs of 2014", width:600, height:400, hAxis: {title: ""},
colors: ["red"] }; // Create and draw the visualization. new
google.visualization.ColumnChart(document.getElementById('visualization105378')).
draw(data, options); } google.setOnLoadCallback(drawVisualization);
The U.S. may have had a relatively strong year, but the story
was completely different overseas. None of the 10 worst
performers were U.S.-focused funds, but instead honed in on
emerging markets or other countries overseas.
The table below lists each ETF in the above charts:
ETF YTD Return
|
| ETRACS Monthly Pay 2x Leveraged Dow Jones Select Dividend Index
ETN (DVYL) |
28.00% |
| ETRACS Monthly Pay 2x Leveraged S&P Dividend ETN
(SDYL) |
27.12% |
| S&P 500 High Dividend Portfolio (SPHD) |
19.88% |
| Ultra Dividend Fund (RDIV) |
19.67% |
| SuperDividend U.S. ETF (DIV) |
19.16% |
| Sector Dividend Dogs ETF (SDOG) |
16.99% |
| High Yield Dividend Achievers (PEY) |
16.20% |
| S&P 500 Aristocrats ETF (NOBL) |
15.55% |
| Equity Income Fund (DHS) |
15.53% |
| Value Line Dividend Index Fund (FVD) |
15.22% |
| S&P Global Dividend Opportunities Index ETF
(LVL) |
-3.85% |
| SPDR S&P Emerging Markets Dividend ETF (EDIV) |
-4.10% |
| Australia Dividend Fund (AUSE) |
-4.34% |
| iShares Emerging Markets Dividend ETF (DVYE) |
-5.80% |
| International SmallCap Fund (DLS) |
-7.15% |
| Europe SmallCap Dividend Fund (DFE) |
-7.52% |
| Commodity Country Equity Fund (CCXE) |
-7.54% |
| Emerging Markets Equity Income Fund (DEM) |
-8.31% |
| Low Volatility Emerging Markets Dividend ETF (HILO) |
-9.78% |
| Global Natural Resources Fund (GNAT) |
-14.97% |
Follow me on
Twitter @JaredCummans.
[For more ETF analysis, make sure to
sign up for our free ETF newsletter]
Disclosure: No positions at time of
writing.
Click here to read the original article on ETFdb.com.
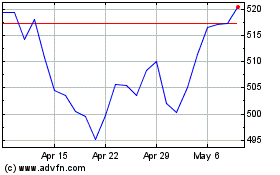
SPDR S&P 500 (AMEX:SPY)
Historical Stock Chart
From Mar 2024 to Apr 2024

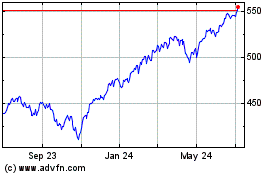
SPDR S&P 500 (AMEX:SPY)
Historical Stock Chart
From Apr 2023 to Apr 2024
