Teleflex Incorporated Hosts Investor and Analyst Day
May 21 2015 - 8:30AM
Business Wire
Reaffirms Previously Provided 2015 Financial
Outlook
Provides Financial Goals and Objectives Through
2018
Teleflex Incorporated (NYSE: TFX) will provide longer-term
financial goals and objectives through 2018 and discuss the
business plans and strategic initiatives that are expected to drive
the Company’s growth and margin expansion at the Company’s Investor
and Analyst Day meeting today.
Benson Smith, Chairman, President and Chief Executive Officer
commented, “The Company is off to a solid start in 2015, and we
have built momentum in executing our longer-term strategic
initiatives. As we look forward to the future, we believe that we
have a portfolio of products capable of consistently generating
mid-single digit constant currency revenue growth, as well as an
opportunity to further improve our gross and operating margins and
drive significant cash flow generation.”
The Company’s longer-term financial goals and objectives
include:
- constant currency revenue growth of
between 5% to 6% per year for 2016 through 2018;
- adjusted gross and operating margin
expansion of 350 basis points to 400 basis points beyond 2015
levels by 2018; and
- free cash flow growth of between 10% to
12% per year through 2018.
In addition to providing its longer-term outlook, the Company
reaffirmed its previously provided 2015 constant currency revenue
growth range of 4% to 6% and its previously provided 2015 adjusted
diluted earnings per share from continuing operations range of
$6.10 to $6.35.
A live webcast of the event will be available on the Company’s
website and can be accessed at www.teleflex.com. A replay of the
event and the presentation materials will be available at the same
website following the conclusion of the meeting.
FORECASTED 2015 CONSTANT CURRENCY
REVENUE GROWTH RECONCILIATION
Low High Forecasted 2015 GAAP
revenue growth (2 %) — Estimated impact of foreign currency
fluctuations 6 % 6 % Forecasted 2015 constant
currency revenue growth
4
%
6 %
FORECASTED 2015 ADJUSTED EARNINGS PER
SHARE RECONCILIATION
Low High
Diluted earnings per share attributable to common
shareholders $4.22 $4.37 Restructuring, impairment charges
and special items, net of tax $0.75 $0.80 Intangible
amortization expense, net of tax $0.95 $1.00 Amortization of
debt discount on convertible notes, net of tax $0.18
$0.18 Adjusted diluted earnings per
share $6.10 $6.35
FREE CASH FLOW GROWTH PER
YEAR THROUGH 2018 RECONCILIATION Dollars in Millions
2014 2018
CAGR Low High
Low High Net cash
provided by operating activities
from continuing operations
$ 290 $ 400 $ 430 8 % 10 % Less: capital expenditures
68 75 80
Free
cash flow $ 223 $ 325 $
350 10 % 12 %
ABOUT TELEFLEX INCORPORATED
Teleflex is a leading global provider of specialty medical
devices for a range of procedures in critical care and surgery. Our
mission is to provide solutions that enable healthcare providers to
improve outcomes and enhance patient and provider safety.
Headquartered in Wayne, PA, Teleflex employs approximately 12,200
people and serves healthcare providers worldwide. For additional
information about Teleflex please refer to www.teleflex.com.
NOTES ON NON-GAAP FINANCIAL MEASURES
This press release includes certain non-GAAP financial measures.
These measures include forecasted (i) 2015 adjusted diluted
earnings per share from continuing operations, which excludes the
effect of our restructuring programs, asset impairments and other
special charges, intangible amortization expense and the
amortization of debt discount on our convertible notes; (ii) 2015
constant currency revenue growth and constant currency revenue
growth per year for the three-year period from 2016 through 2018,
which exclude the impact of translating the results of
international subsidiaries at different currency exchange rates
from period to period; (iii) adjusted gross margin expansion for
the three-year period from 2016 through 2018, which excludes the
impact of certain losses, other charges and charge reversals; (iv)
adjusted operating margin expansion for the three-year period from
2016 through 2018, which excludes the impact of intangible
amortization expense and contingent consideration liabilities; and
(v) free cash flow growth per year through 2018, which is defined
as cash flow from operations less capital expenditures. Management
believes these measures are useful to investors because they
eliminate items that do not reflect Teleflex’s day-to-day
operations. In addition, management uses these financial measures
for internal managerial purposes, when publicly providing guidance
on possible future results, and to assist in our evaluation of
period-to-period comparisons. With respect to free cash flow,
management also believes that it is useful to investors because it
facilitates an assessment of funds available to satisfy current and
future obligations, pay dividends and fund acquisitions. Free cash
flow is not a measure of cash available for discretionary
expenditures since we have certain non-discretionary obligations,
such as debt service, that are not deducted from the measure. These
financial measures are presented in addition to results presented
in accordance with GAAP and should not be relied upon as a
substitute for GAAP financial measures.
Tables reconciling our forecasted 2015 constant currency revenue
growth, 2015 adjusted earnings per share and free cash flow growth
per year through 2018 to the most directly comparable GAAP measure
are set forth above. We have not provided a reconciliation of our
forecasted 2016 through 2018 constant currency revenue growth to
forecasted 2016 through 2018 GAAP revenue growth due to the
unpredictability of future changes in foreign exchange rates.
Similarly, we have not provided a reconciliation of our forecasted
expansion of adjusted gross and operating margins for 2016 through
2018 because we are unable to predict the effect of certain items
that typically would result in adjustments to the most comparable
GAAP measures. However, our forecasted adjusted operating margin
expansion for 2016 through 2018 currently assumes adjustments for
intangible amortization expense and contingent consideration
liabilities that would result in our forecasted 2018 adjusted
operating margin being approximately 3.0% greater than forecasted
2018 GAAP operating margin.
CAUTION CONCERNING FORWARD-LOOKING INFORMATION
This press release contains forward-looking statements,
including, but not limited to, (a) the ability of our products to
consistently generate mid-single digit constant currency revenue
growth; (b) forecasted 2015 constant currency revenue growth and
adjusted earnings per share from continuing operations; and (c)
forecasted 2016 through 2018 constant currency revenue growth,
adjusted gross and operating margin expansion and free cash flow
growth. Actual results could differ materially from those in the
forward-looking statements due to, among other things, conditions
in the end markets we serve, customer reaction to new products and
programs, our ability to achieve sales growth, price increases or
cost reductions; changes in the reimbursement practices of third
party payors; our ability to realize efficiencies and to execute on
our strategic initiatives; changes in material costs and
surcharges; market acceptance and unanticipated difficulties in
connection with the introduction of new products and product line
extensions; product recalls; unanticipated difficulties in
connection with the consolidation of manufacturing and
administrative functions, including as a result of difficulties
with various employees, labor representatives or regulators; the
loss of skilled employees in connection with such initiatives;
unanticipated difficulties, expenditures and delays in connection
with the integration of acquired businesses, including
unanticipated costs and difficulties in connection with integration
programs and customer reaction; unanticipated difficulties,
expenditures and delays in complying with government regulations
applicable to our businesses; the impact of government healthcare
reform legislation; our ability to meet our debt obligations;
changes in general and international economic conditions, including
fluctuations in foreign currency exchange rates; and other factors
described or incorporated in our filings with the Securities and
Exchange Commission, including our Annual Report on Form 10-K for
the year ended December 31, 2014.
View source
version on businesswire.com: http://www.businesswire.com/news/home/20150521005041/en/
Teleflex IncorporatedJake ElguiczeTreasurer and Vice President
of Investor Relations610-948-2836
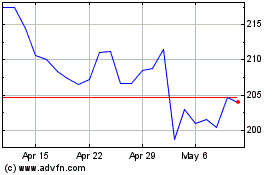
Teleflex (NYSE:TFX)
Historical Stock Chart
From Mar 2024 to Apr 2024

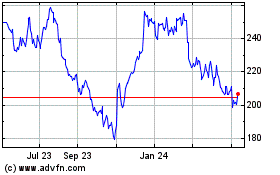
Teleflex (NYSE:TFX)
Historical Stock Chart
From Apr 2023 to Apr 2024
