Stock Market News for May 3, 2012 - Market News
May 03 2012 - 5:06AM
Zacks
Lower-than-expected private sector
hiring spooked investors and dragged the benchmarks lower
yesterday. In addition, new orders for U.S. factory goods declined
by its highest margin in three years and factory activity
contracted yet again in the Euro zone.
The Dow Jones Industrial Average
(DJI) slipped 0.1% to settle at 13,268.57. The Standard & Poor
500 (S&P 500) declined by 0.3% and closed yesterday’s trading
session at 1,402.31. However, the tech-laden Nasdaq Composite Index
managed to end in the green, gaining 0.3% to finish at 3,059.85.
The fear-gauge CBOE Volatility Index (VIX) edged up 1.7% to settle
at 16.9. Consolidated volumes on the New York Stock Exchange, the
Nasdaq and the American Stock Index were 6.4 billion shares, lower
than the daily average of roughly 6.76 billion. For every three
stocks that moved down on the NYSE, only a couple of stocks could
close in the green.
This decline comes just a day after
the Dow reached its highest point since late 2007. Among the 30 Dow
components, only 14 managed to end in positive territory but none
managed robust gains. Intel Corporation (NASDAQ:INTC) led the
advancers with modest gains of 0.8% followed by The Home Depot,
Inc. (NYSE:HD), Procter & Gamble Co. (NYSE:PG), and Caterpillar
Inc. (NYSE:CAT), which gained 0.7%, 0.6% and 0.5%, respectively. On
the other hand, the declines were much larger and included the
likes of Alcoa, Inc. (NYSE:AA), Bank of America Corporation
(NYSE:BAC), Chevron Corporation (NYSE:CVX) and JPMorgan Chase &
Co. (NYSE:JPM) and they plunged 2.4%, 1.8%, 1.2% and 1.4%,
respectively.
While encouraging economic data
helped benchmarks to soar on Tuesday, Wednesday’s declines were
sparked off by concerns over dismal reports. The Automatic Data
Processing, Inc.’s (NASDAQ:ADP) National Employment Report stated
that U.S. nonfarm private business sector added only 119,000 jobs
in April, far lower than expectations of an addition of 177,000
jobs. According to the report: “Employment in the private,
service-providing sector increased 123,000 in April, after rising
158,000 in March. Employment in the private, goods-producing sector
declined 4,000 jobs in April. Manufacturing employment dropped
5,000 jobs, the first loss since September of last year”.
Meanwhile, jobs numbers for March
was modestly revised downward from 209,000 to 201,000. Market
expectations took a downturn and investors expect nonfarm payroll
data to show additions of 125,000 to 150,000 jobs as against
170,000 job additions estimated by Reuters.
Markets were also jolted by data
from across the Atlantic, which painted dismal picture of the labor
market and factory activity. Data suggested that unemployment in
the Eurozone has touched its highest level in 15 years, soaring to
10.9% in March. In 1997, the unemployment rate in the region had
hovered around 10.95% for the months of February, March and April.
Separately, the Manufacturing Purchasing Managers’ Index (PMI)
declined to 45.9 in April from March’s reading of 47.7. The index
has now reached its lowest point since June 2009.
Coming back to the domestic front,
new orders for U.S. factory goods declined by its highest margin in
three years. According to the U.S. Department of Commerce, new
orders for manufactured goods in March declined 1.5% to $460.5
billion. This drop was higher than consensus estimates of a decline
of 1.6%, but reversed February’s increase of 1.1%.
ALCOA INC (AA): Free Stock Analysis Report
AUTOMATIC DATA (ADP): Free Stock Analysis Report
BANK OF AMER CP (BAC): Free Stock Analysis Report
CATERPILLAR INC (CAT): Free Stock Analysis Report
CHEVRON CORP (CVX): Free Stock Analysis Report
HOME DEPOT (HD): Free Stock Analysis Report
INTEL CORP (INTC): Free Stock Analysis Report
JPMORGAN CHASE (JPM): Free Stock Analysis Report
PROCTER & GAMBL (PG): Free Stock Analysis Report
To read this article on Zacks.com click here.
Zacks Investment Research
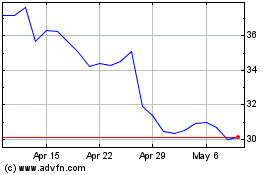
Intel (NASDAQ:INTC)
Historical Stock Chart
From Mar 2024 to Apr 2024

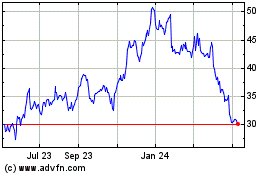
Intel (NASDAQ:INTC)
Historical Stock Chart
From Apr 2023 to Apr 2024
