State Street’s GX Private Equity Idx Drops in Q3 2015 for the First Time in Three Years, Marking End to Unprecedented Strea...
February 02 2016 - 10:30AM
Business Wire
Despite Dip, New Research Verifies Asset Owners’ Continued
Interest in Private Equity Investments
State Street Corporation (NYSE:STT) today announced the results
of its GX Private Equity IndexSM (PEI), a benchmark for comparative
analysis of private equity performance, which includes a
comprehensive data set dating back to 1980. In the third quarter of
2015, the index saw an overall return of -1.37 percent.
This Smart News Release features multimedia.
View the full release here:
http://www.businesswire.com/news/home/20160202006094/en/
“The third quarter marks an abrupt end to an uninterrupted,
12-quarter streak of positive returns, the longest winning streak
in the 20-year history of our Index,” said Will Kinlaw, senior vice
president of State Street Global Exchange. “With growing
uncertainty about the global economy and a big spike in public
capital market volatility over the past six months, it’s no
surprise that the private equity market is taking a pause.”
The Index is based on directly sourced limited partnership data
and represents more than $2.3 trillion in private equity
investments, with 2,462 unique private equity partnerships, as of
September 30, 2015.
“There has been a spike in exit activity over the past several
years, with private equity managers returning capital to investors
faster than they are calling it,” said Kinlaw. “This has been the
trend for 16 quarters, and while it did not reverse in Q3, it has
slowed sharply. Managers are being a lot more selective.”
Additional third quarter highlights include:
- The Q3 number represents the biggest
decline in the headline Index since Q3 2011. There have only been
10 quarters in its history where the index has posted larger
declines, including: Q3 1998 at the time of the Russian debt
default, Q4 2000 as the dot-com bubble imploded, Q3 2008 through Q1
2009 during the global financial crisis, and Q3 2011 when the Index
dropped by 5.1% amid fears of a Eurozone crisis.
- Total realized proceeds from exits
declined in the second half of 2015, dropping by nearly 17.8% in Q3
and by a further 16.4% in Q4 2015.
- All three major private equity
strategies, Buyout, Venture Capital and Private Debt, posted
negative quarterly returns in Q3: -1.63%, -0.51% and -1.27%,
respectively.
- Among sub-strategies within Buyout,
Mega and Large Buyout recorded -1.94%, while Mid and Small Buyout
only dropped by 0.11%.
- Private equity funds outside of the US
and Europe, primarily made up of emerging market funds, had a
volatile quarter: performance dropped from 4.47% in Q2 to -3.13% in
Q3 2015. European-focused private equity funds recorded a return of
0.29% in the third quarter, benefiting from a tailwind in the Euro
to US Dollar exchange rate. Private equity funds in the US posted
-1.43% and -1.25% quarterly return, respectively.
Soon-to-be-published research by State Street of more than 100
institutional investors globally finds that a majority expect their
allocations to private equity to increase over the next five years.
The complete research report will be released later this
quarter.
For additional insights, or to learn more about the GX Private
Equity Index please visit http://www.ssgx.com/peindex.
About State Street
State Street Corporation (NYSE: STT) is one of the world's
leading providers of financial services to institutional investors,
including investment servicing, investment management and
investment research and trading. With $28 trillion in assets under
custody and administration and $2 trillion* in assets under
management as of December 31, 2015, State Street operates in more
than 100 geographic markets worldwide, including the US, Canada,
Europe, the Middle East and Asia. For more information, visit State
Street’s website at www.statestreet.com.
* Assets under management include approximately $22 billion as
of December 31, 2015, for which State Street Global Markets, LLC,
an affiliate of SSGA, serves as the distribution agent.
Index returns are unmanaged and do not reflect the deduction of
any fees or expenses. Index returns reflect all items of income,
gain and loss and the reinvestment of dividends and other
income.
Past performance is not a guarantee of future results.
CORP-1784
View source
version on businesswire.com: http://www.businesswire.com/news/home/20160202006094/en/
State Street CorporationJulie Kane,
+1-617-664-3001jekane@statestreet.com@StateStreet
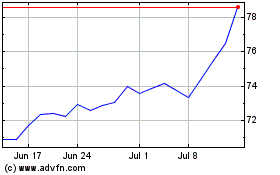
State Street (NYSE:STT)
Historical Stock Chart
From Mar 2024 to Apr 2024

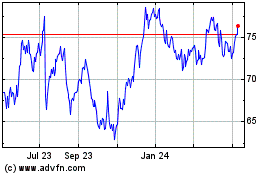
State Street (NYSE:STT)
Historical Stock Chart
From Apr 2023 to Apr 2024
