Royal Dutch Shell plc 3Q 2016 -- Forecast
October 27 2016 - 5:31AM
Dow Jones News
FRANKFURT--The following is a summary of analysts' forecasts for
Royal Dutch Shell plc (RDSA) third-quarter results, based on a poll
of 10 analysts conducted by Dow Jones Newswires. Figures in million
dollars, EPS and dividend in dollar, target price in pence,
production in thousand barrel of oil per day (kboe/d), according to
IFRS). Earnings figures are scheduled to be released November
1.
===
                 CCS Earnings   CCS EPS  Production
3rd Quarter       adjusted(a)   adj.(a)    (kboe/d)
AVERAGE                 1,757      0.24       3,541
Prev. Year              2,376      0.38       2,880
+/- in %                  -26       -38         +23
Prev. Quarter           1,045      0.13       3,508
+/- in %                  +68       +82        +0.9

MEDIAN                  1,793      0.23       3,518
Maximum                 2,238      0.28       3,720
Minimum                 1,258      0.20       3,399
Amount                     10         5          10

Barcalys                1,392        --       3,445
Deutsche Bank           2,090        --       3,429
Goldman Sachs           2,238      0.28       3,720
Jefferies               1,985      0.25       3,618
Kepler Cheuvreux        1,517        --       3,510
Morgan Stanley          1,258        --       3,399
Panmure                 1,625      0.20       3,672
Santander               1,880      0.23       3,525
Societe Generale        1,782      0.22       3,591
UBS                     1,804        --       3,502

           Target price    Rating                  DPS 2016
AVERAGE           2,346    positive 8    AVERAGE       1.88
Prev. Quarter     2,210    neutral  2    Prev. Year    1.88
+/- in %           +6.2    negative 0    +/- in %       0.0

MEDIAN            2,300                  MEDIAN        1.88
Maximum           2,600                  Maximum       1.88
Minimum           2,000                  Minimum       1.88
Amount                9                  Amount           5

Barcalys          2,600    Overweight                    --
Citi              2,000    Neutral                     1.88
Deutsche Bank     2,220    Buy                         1.88
Jefferies         2,400    Buy                         1.88
Kepler Cheuvreux     --    Buy                         1.88
Morgan Stanley    2,600    Overweight                    --
Panmure           2,300    Buy                           --
Santander         2,248    Hold                          --
Societe Generale  2,500    Buy                           --
UBS               2,250    Buy                         1.88
===
Year-earlier figures are as reported by the company.
(a) Clean cost of supplies.
DJG/err
(END) Dow Jones Newswires
October 27, 2016 05:16 ET (09:16 GMT)
Copyright (c) 2016 Dow Jones & Company, Inc.
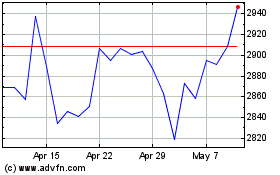
Shell (LSE:SHEL)
Historical Stock Chart
From Mar 2024 to Apr 2024

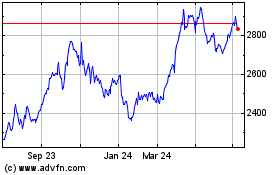
Shell (LSE:SHEL)
Historical Stock Chart
From Apr 2023 to Apr 2024
