UNITED STATES
SECURITIES AND EXCHANGE COMMISSION
Washington, DC 20549
FORM 6-K
Report of Foreign Private Issuer
Pursuant to Rule 13a-16 or 15d-16
Under the Securities Exchange Act of 1934
For the month of February, 2016
Cameco
Corporation
(Commission file No. 1-14228)
2121-11th Street West
Saskatoon, Saskatchewan, Canada S7M 1J3
(Address of Principal Executive Offices)
Indicate by check mark whether
the registrant files or will file annual reports under cover Form 20-F or Form 40-F.
Form 20-F ¨ Form 40-F x
Indicate by check mark whether the registrant by furnishing the information contained in this Form is also thereby furnishing the information to the
Commission pursuant to Rule 12g3-2(b) under the Securities Exchange Act of 1934.
Yes ¨ No
x
If “Yes” is marked, indicate below the file number assigned to the registrant in
connection with Rule 12g3-2(b):
Exhibit Index
|
|
|
|
|
| Exhibit
No. |
|
Description |
|
Page No. |
|
|
|
| 1. |
|
Press Release dated February 5, 2016 announcing financial results for the period ended December 31, 2015 |
|
|
|
|
|
| 2. |
|
2015 Cameco Corporation Consolidated Financial Statements |
|
|
|
|
|
| 3. |
|
Annual Management’s Discussion and Analysis of Cameco Corporation’s 2015 Consolidated Financial Statements |
|
|
SIGNATURE
Pursuant to the requirements of the Securities Exchange Act of 1934, the registrant has duly caused this report to be signed on its behalf by the undersigned,
thereunto duly authorized.
|
|
|
|
|
|
|
| Date: February 8, 2016 |
|
|
|
Cameco Corporation |
|
|
|
|
|
|
|
|
By: |
|
“Sean A. Quinn” |
|
|
|
|
|
|
Sean A. Quinn |
|
|
|
|
|
|
Senior Vice-President, Chief Legal Officer
and Corporate Secretary |
|
|
|
|
|
| TSX: CCO NYSE:
CCJ |
|

|
|
website: cameco.com
currency: Cdn (unless noted) |
| |
|
2121 – 11th Street West, Saskatoon, Saskatchewan, S7M 1J3 Canada
Tel: (306) 956-6200 Fax: (306) 956-6201
Cameco reports fourth quarter and 2015 financial results
| • |
|
delivered on annual guidance amid weak market conditions |
| • |
|
solid uranium segment results, record annual revenue and average realized price owing to a weaker Canadian dollar |
| • |
|
record annual uranium production on the back of strong results at Cigar Lake |
| • |
|
write-down of $210 million in the fourth quarter related to our Rabbit Lake operation |
Saskatoon, Saskatchewan, Canada, February 5, 2016 . . . . . . . . . . . . . . . . . .
Cameco (TSX: CCO; NYSE: CCJ) today reported its consolidated financial and operating results for the fourth quarter and year ended December 31, 2015 in
accordance with International Financial Reporting Standards (IFRS).
“In 2015, the company continued to perform well, in the context of the global
challenges our industry faces,” said president and CEO, Tim Gitzel. “But despite the challenges, we continued to concentrate on the aspects of our business that are within our control, which has led us to once again deliver on, and in some
cases exceed, our annual guidance.
“We are still waiting on a market recovery that was expected to come sooner, but we’ve learned to put those
expectations aside and prepare for whatever comes our way. Looking ahead, our strategy is to continue focusing our capital on tier-one assets, because it’s those world-class, low-cost mines that will position us to quickly respond when the
market calls for more production. And we believe that the question is not ‘if’ the market will make that call, but ‘when’, as we continue to see a bright long-term outlook for the nuclear industry.”
|
|
|
|
|
|
|
|
|
|
|
|
|
|
|
|
|
|
|
|
|
|
|
|
|
|
|
|
|
| |
|
THREE MONTHS ENDED
DECEMBER 31 |
|
|
|
|
|
YEAR ENDED
DECEMBER 31 |
|
|
|
|
| HIGHLIGHTS
($ MILLIONS EXCEPT WHERE INDICATED) |
|
2015 |
|
|
2014 |
|
|
CHANGE |
|
|
2015 |
|
|
2014 |
|
|
CHANGE |
|
| Revenue |
|
|
975 |
|
|
|
889 |
|
|
|
10 |
% |
|
|
2,754 |
|
|
|
2,398 |
|
|
|
15 |
% |
| Gross profit |
|
|
282 |
|
|
|
251 |
|
|
|
12 |
% |
|
|
697 |
|
|
|
638 |
|
|
|
9 |
% |
| Net earnings (loss) attributable to equity holders |
|
|
(10 |
) |
|
|
73 |
|
|
|
(114 |
)% |
|
|
65 |
|
|
|
185 |
|
|
|
(65 |
)% |
| $ per common share (diluted) |
|
|
(0.03 |
) |
|
|
0.18 |
|
|
|
(114 |
)% |
|
|
0.16 |
|
|
|
0.47 |
|
|
|
(65 |
)% |
| Adjusted net earnings (non-IFRS, see page 8) |
|
|
151 |
|
|
|
205 |
|
|
|
(26 |
)% |
|
|
344 |
|
|
|
412 |
|
|
|
(17 |
)% |
| $ per common share (adjusted and diluted) |
|
|
0.38 |
|
|
|
0.52 |
|
|
|
(27 |
)% |
|
|
0.87 |
|
|
|
1.04 |
|
|
|
(16 |
)% |
| Cash provided by operations (after working capital changes) |
|
|
503 |
|
|
|
236 |
|
|
|
113 |
% |
|
|
450 |
|
|
|
480 |
|
|
|
(6 |
)% |
| Average realized prices |
|
Uranium |
|
($US/lb) |
|
|
46.36 |
|
|
|
50.57 |
|
|
|
(8 |
)% |
|
|
45.19 |
|
|
|
47.53 |
|
|
|
(5 |
)% |
|
|
|
|
($Cdn/lb) |
|
|
61.24 |
|
|
|
56.78 |
|
|
|
8 |
% |
|
|
57.58 |
|
|
|
52.37 |
|
|
|
10 |
% |
|
|
Fuel Services |
|
($Cdn/kgU) |
|
|
21.88 |
|
|
|
16.92 |
|
|
|
29 |
% |
|
|
23.37 |
|
|
|
19.70 |
|
|
|
19 |
% |
|
|
NUKEM |
|
($Cdn/lb) |
|
|
52.22 |
|
|
|
52.12 |
|
|
|
— |
|
|
|
48.82 |
|
|
|
44.90 |
|
|
|
9 |
% |
The 2015 annual financial statements have been audited; however, the 2014 and 2015 fourth quarter financial information
presented is unaudited. You can find a copy of our 2015 annual management’s discussion and analysis (MD&A), and our 2015 audited financial statements, on our website at cameco.com.
- 1 -
FULL YEAR
Our net earnings attributable to equity holders (net earnings) in 2015 were $65 million ($0.16 per share diluted) compared to $185 million ($0.47 per share
diluted) in 2014, mainly due to:
| • |
|
greater losses on foreign exchange derivatives due to the weakening of the Canadian dollar |
| • |
|
lower tax recoveries, primarily due to the write-off of our deferred tax asset in the US |
partially offset by:
| • |
|
lower impairment charges ($215 million in 2015; $327 million in 2014) |
| • |
|
higher earnings in our uranium and fuel services segments due to higher average realized prices |
| • |
|
higher earnings in our NUKEM segment as a result of higher volumes and average realized price |
| • |
|
reduction of the provision related to our Canada Revenue Agency (CRA) litigation |
In addition, in 2014 there
were a number of one-time items that contributed to the higher net earnings in 2014 compared to 2015, including:
| • |
|
the sale of our interest in Bruce Power Limited Partnership (BPLP) resulting in a $127 million gain in 2014 |
| • |
|
a favourable settlement of $66 million in 2014 with respect to a dispute regarding a long-term supply contract with a utility customer |
partially offset by:
| • |
|
payment of an early agreement termination fee of $18 million as a result of the cancellation of our toll conversion agreement with Springfields Fuels Limited (SFL), and $12 million for settlement costs with respect to
early redemption of our Series C debentures in 2014 |
| • |
|
the write-off of $41 million of assets under construction in 2014 as a result of changes made to the scope of a number of projects |
On an adjusted basis, our earnings were $344 million ($0.87 per share diluted) (non-IFRS measure, see page 8) in 2015 compared to $412 million ($1.04 per
share diluted) in 2014.
The 17% decrease from 2014 to 2015 resulted from:
| • |
|
greater losses on foreign exchange derivatives due to the weakening of the Canadian dollar |
| • |
|
lower tax recoveries, primarily due to the write-off of our deferred tax asset in the US |
partially offset by:
| • |
|
higher earnings in our uranium and fuel services segments mainly due to a higher average realized price |
| • |
|
higher earnings from our NUKEM segment mainly due to higher sales volumes and a higher average realized price |
| • |
|
a reduction of the provision related to our CRA litigation |
In addition, in 2014 there was a favourable
settlement of $66 million with respect to a dispute regarding a long-term supply contract with a utility customer that contributed to the higher adjusted net earnings in 2014 compared to 2015. The impact of the settlement was partially offset by an
early termination fee of $18 million incurred as a result of the cancellation of our toll conversion agreement with SFL and settlement costs of $12 million with respect to the early redemption of our Series C debentures in 2014.
FOURTH QUARTER
In the fourth quarter of 2015, our net
loss was $10 million ($(0.03) per share diluted), a decrease of $83 million compared to net earnings of $73 million ($0.18 per share diluted) in 2014, mainly due to:
| • |
|
greater losses on foreign exchange derivatives resulting from the weakening of the Canadian dollar |
| • |
|
lower income tax recovery due to the reduction of our deferred tax asset in the US |
| • |
|
higher impairment charges in 2015 ($210 million in 2015, $131 million in 2014) |
partially offset by:
| • |
|
higher uranium gross profits resulting mainly from a higher average realized price and higher sales volumes |
| • |
|
higher gross profits from our fuel services segment due to a higher average realized price |
| • |
|
lower exploration expenditures |
- 2 -
| • |
|
the reduction of our provision related to the CRA litigation |
In addition, in the fourth quarter of 2014 there
was a favourable settlement of $37 million with respect to a dispute regarding a long-term supply contract with a utility customer that contributed to the higher net earnings in the fourth quarter of 2014 compared to the same period in 2015. The
impact of the settlement was partially offset by the write-off of $41 million of assets under construction as a result of changes made to the scope of a number of projects in the fourth quarter of 2014.
On an adjusted basis, our earnings this quarter were $151 million ($0.38 per share diluted) compared to $205 million ($0.52 per share diluted) (non-IFRS
measure, see page 8) in 2014, mainly due to:
| • |
|
a lower income tax recovery primarily due to the reduction of our deferred tax asset in the US |
partially
offset by:
| • |
|
higher uranium gross profits resulting mainly from a higher average realized price and higher sales volumes |
| • |
|
higher gross profits from our fuel services segment mainly due to a higher average realized price |
| • |
|
lower exploration expenditures |
| • |
|
the reduction of our provision related to the CRA litigation |
In addition, in the fourth quarter of 2014 there
was a favourable settlement of $37 million with respect to a dispute regarding a long-term supply contract with a utility customer that contributed to the higher adjusted net earnings in the fourth quarter of 2014 compared to the same period in
2015.
Impairment charge on producing assets
During
the fourth quarter of 2015, we recognized a $210 million impairment charge related to our Rabbit Lake operation. The impairment was due to increased uncertainty around future production sources for the Rabbit Lake mill as a result of the ongoing
economic conditions. The amount of the charge was determined as the excess of carrying value over the recoverable amount. The recoverable amount of the mill was determined to be $69 million. See note 9 to the financial statements.
2015 market developments
As has been the case in recent
years, a lot happened over the course of 2015, although the general state of the market did not see much change.
Making positive news for nuclear, as
usual, was China. Not only did the country continue with its rapid reactor new build program and bring eight reactors online, but Chinese companies also signed agreements with Argentina, Romania and the UK for new reactors, illustrating the
country’s commitment to nuclear and its intent to become a major international player in the nuclear industry.
Undoubtedly, the biggest headline of
2015 was the long-awaited first reactor restarts in Japan. Sendai units 1 and 2 were the first reactors in Japan to restart since 2013, and it is hoped they are the first of many to come.
New builds in the UK and US continued to be bright spots for the industry, in addition to a number of reactor life extensions approved in Japan, and the US,
with utilities now considering additional extensions that could see reactor lives reaching 80 years.
However, these positive developments could not
outweigh the more powerful influence of a continued sluggish global economy, geopolitical issues, concerns around growth in China, and flat electricity demand. These more general drivers had help from industry specific factors as well, such as
slower new reactor construction, eight reactor shutdowns, the continued high level of inventories held by market participants, and France’s policy to reduce nuclear in their energy mix to 50% by 2025 becoming law.
In addition, supply performed relatively well, with only minor disruptions and one curtailment, unlike 2014, which saw six projects tempered or curtailed.
The end result was a market seemingly indifferent to the commotion of events that occurred throughout the year.
- 3 -
CONTRACTING
Market contracting activity was modest. Spot volumes were normal, but long-term contracting was well below historical averages and current consumption
levels—about half of current annual reactor consumption estimates, similar to 2014. Long-term contracting is a key factor in the timing of market recovery, and its pace will depend on the respective coverage levels, market views and risk
appetite of both buyers and sellers.
JAPAN
The big
news in Japan was the restart of Sendai units 1 and 2, which occurred in August and October. In addition, the court injunction against the two Takahama units was overturned in December, 2015, clearing the way for Takahama unit 3 to restart on
January 29, 2016, with unit 4 expected to restart later in the first quarter. Ikata unit 3 has also cleared a safety inspection by the Nuclear Regulatory Authority, and four more units are in the final stages of approval. In all, three reactors
are now in operation, while 23 remain under evaluation for restart.
Over the long term, Japan’s energy policy states that nuclear will make up 20 to
22% of the energy mix in the country. The billions of dollars in investment being made by Japan’s utilities suggest a high degree of confidence in reactors coming back online and meeting this target; however, public sentiment towards nuclear in
Japan remains somewhat uncertain.
OTHER REGIONS
China’s remarkable nuclear growth program remains on track and the UK’s plans for new reactor construction continue to move forward. India and South
Korea are also among several key regions growing their nuclear generation fleet.
In 2015, growth was tangible as 10 reactors came online—double that
of 2014. These included the eight noted in China, one in Russia and one in South Korea. And seven more reactors began construction—six in China and one in the UAE, a formerly non-nuclear country with four reactors now under construction.
But, to round out the picture, eight units shut down. Five of these were in Japan, plus one in Sweden, one in Germany as part of its phase-out plans, and one
in the UK—the last Magnox reactor operating in the world. In addition, there were announcements for future shutdowns in the US, where nuclear struggles to remain competitive in deregulated electricity markets and in the context of low natural
gas prices.
One event that could have an effect on the future of nuclear in the US and other western countries is the UN Climate Conference COP-21
agreement, finalized in 2015. As a non-GHG emitter, nuclear could play a significant role in achieving climate change prevention goals.
Outlook for
2016
Our strategy is to focus on our tier-one assets and profitably produce at a pace aligned with market signals, while maintaining the ability to
respond to conditions as they evolve.
Our outlook for 2016 reflects the expenditures necessary to help us achieve our strategy. We do not provide an
outlook for the items in the table that are marked with a dash.
See 2015 Financial results by segment on page 12 for details.
- 4 -
2016 FINANCIAL OUTLOOK
|
|
|
|
|
|
|
|
|
| |
|
CONSOLIDATED |
|
URANIUM |
|
FUEL SERVICES |
|
NUKEM |
| Production |
|
— |
|
30.0 million lbs |
|
8 to 9 million kgU |
|
— |
|
|
|
|
|
| Delivery volume1 |
|
— |
|
30 to 32 million lbs2 |
|
Decrease up to 5% |
|
9 to 10 million lbs U3O8 |
|
|
|
|
|
| Revenue compared to 20153 |
|
Decrease up to 5% |
|
Decrease up to 5%4 |
|
Increase up to 5% |
|
Increase 5% to 10% |
|
|
|
|
|
| Average unit cost of sales (including D&A) |
|
— |
|
Increase up to 5%5 |
|
Increase 10% to 15% |
|
— |
|
|
|
|
|
| Direct administration costs compared to 20156 |
|
Increase 5% to
10% |
|
— |
|
— |
|
— |
|
|
|
|
|
| Gross profit |
|
— |
|
— |
|
— |
|
Gross profit 4% to 5% |
|
|
|
|
|
| Exploration costs compared to 2015 |
|
— |
|
Increase 15% to 20% |
|
— |
|
— |
|
|
|
|
|
| Tax rate7 |
|
Recovery of 25% to 30% |
|
— |
|
— |
|
— |
|
|
|
|
|
| Capital expenditures |
|
$320 million |
|
— |
|
— |
|
— |
| 1 |
Our 2016 outlook for delivery volume in our uranium and NUKEM segments does not include sales between our uranium, fuel services and NUKEM segments. |
| 2 |
Our uranium delivery volume is based on the volumes we currently have commitments to deliver under contract in 2016. |
| 3 |
For comparison of our 2016 outlook and 2015 results for revenue in our uranium and NUKEM segments, we do not include sales between our uranium, fuel services and NUKEM segments. |
| 4 |
Based on a uranium spot price of $34.65 (US) per pound (the Ux spot price as of February 1, 2016), a long-term price indicator of $44.00 (US) per pound (the Ux long-term indicator on January 25, 2016) and an
exchange rate of $1.00 (US) for $1.25 (Cdn). |
| 5 |
This increase is based on the unit cost of sales for produced material and committed long-term purchases. If we make discretionary purchases in 2016, then we expect the overall unit cost of sales may be affected.
|
| 6 |
Direct administration costs do not include stock-based compensation expenses. |
| 7 |
Our outlook for the tax rate is based on adjusted net earnings. |
We expect consolidated revenue to decrease up
to 5% in 2016, based on currently committed sales volumes, due to a planned decrease in uranium and fuel services sales volumes. If we make additional sales with deliveries in 2016, we would expect our revenue outlook to increase.
We expect administration costs (not including stock-based compensation) to be 5% to 10% higher compared to 2015 due to increased costs related to the northern
collaboration agreements and increased project work. In 2016, we are continuing to negotiate new collaboration agreements with northern communities, which could result in additional one-time payments. Due to the uncertainty of the timing for the
potential signing of agreements, the cost is not included in our outlook. If agreements are signed and there is an impact on our administrative costs, we will update our outlook.
We expect exploration expenses to be about 15% to 20% higher than they were in 2015 due to increased exploration activity at Cigar Lake.
On an adjusted net earnings basis, we expect a tax recovery of 25% to 30% in 2016 from our uranium, fuel services and NUKEM segments.
Our consolidated tax rate is a blend of the statutory rates applicable to taxable income earned or tax losses incurred in Canada and in our foreign
subsidiaries. We have a global customer base and we have established a marketing and trading structure involving foreign subsidiaries, which entered into various intercompany purchase and sale arrangements, as well as uranium purchase and sale
agreements with third parties. Cameco and its subsidiaries made reasonable efforts to put arm’s-length transfer pricing arrangements in place, and these arrangements expose the parties to the risks and rewards accruing to them under these
contracts. The intercompany contract prices are generally comparable to those established in comparable contracts between arm’s-length parties entered into at that time.
This year, many of the existing intercompany purchase and sale arrangements in our portfolio expire. We have started to replace these contracts and will
continue to put new intercompany arrangements in place, which, as the existing arrangements did, will reflect the market at the time they are signed.
- 5 -
As a result, in 2017, we expect our consolidated tax rate will transition to a modest expense, and trend toward a
tax expense of approximately 20% over the next five years. The actual effective tax rate will vary from year-to-year, primarily due to the actual distribution of earnings among jurisdictions and the market conditions at the time transactions occur
under both our intercompany and third-party purchase and sale arrangements.
ROYALTIES
We pay royalties on the sale of all uranium extracted at our mines in the province of Saskatchewan. Two types of royalties are paid:
| • |
|
Basic royalty: calculated as 5% of gross sales of uranium, less the Saskatchewan resource credit of 0.75%. |
| • |
|
Profit royalty: a 10% royalty is charged on profit up to and including $22.70/kg U3O8 ($10.30/lb)
and a 15% royalty is charged on profit in excess of $22.70/kg U3O8. Profit is determined as revenue less certain operating, exploration,
reclamation and capital costs. Both exploration and capital costs are deductible at the discretion of the producer. |
As a resource
corporation in Saskatchewan, we also pay a corporate resource surcharge of 3% of the value of resource sales.
During the period from 2013 to 2015,
transitional rules for the new profit royalty regime were applied whereby only 50% of capital costs were deductible. The remaining 50% was accumulated and will now be deductible beginning in 2016. In addition, the capital allowance related to Cigar
Lake under the previous system was grandfathered and is also now deductible beginning in 2016. Based on the expected application of transitional and grandfathered capital allowance deductions, we anticipate that only the first tier of the profit
royalty (10%) will apply in 2016 and 2017. As capital pools are depleted, we expect to also be subject to the top tier of the profit royalty (15%) in 2018.
CAPITAL SPENDING
We classify capital spending as
sustaining, capacity replacement or growth. As a mining company, sustaining capital is the money we spend to keep our facilities running in their present state, which would follow a gradually decreasing production curve, while capacity replacement
capital is spent to maintain current production levels at those operations. Growth capital is money we invest to generate incremental production, and for business development.
|
|
|
|
|
|
|
|
|
|
|
|
|
| CAMECO’S SHARE ($ MILLIONS) |
|
2015 PLAN1 |
|
|
2015 ACTUAL |
|
|
2016 PLAN |
|
| Sustaining capital |
|
|
|
|
|
|
|
|
|
|
|
|
| McArthur River/Key Lake |
|
|
20 |
|
|
|
16 |
|
|
|
30 |
|
| Cigar Lake |
|
|
10 |
|
|
|
9 |
|
|
|
25 |
|
| Rabbit Lake |
|
|
35 |
|
|
|
33 |
|
|
|
25 |
|
| US ISR |
|
|
5 |
|
|
|
7 |
|
|
|
5 |
|
| Inkai |
|
|
5 |
|
|
|
1 |
|
|
|
5 |
|
| Fuel services |
|
|
15 |
|
|
|
13 |
|
|
|
20 |
|
| Other |
|
|
5 |
|
|
|
5 |
|
|
|
5 |
|
|
|
|
|
|
|
|
|
|
|
|
|
|
| Total sustaining capital |
|
|
95 |
|
|
|
84 |
|
|
|
115 |
|
|
|
|
|
|
|
|
|
|
|
|
|
|
| Capacity replacement capital |
|
|
|
|
|
|
|
|
|
|
|
|
| McArthur River/Key Lake |
|
|
95 |
|
|
|
96 |
|
|
|
55 |
|
| Cigar Lake |
|
|
25 |
|
|
|
26 |
|
|
|
20 |
|
| Rabbit Lake |
|
|
— |
|
|
|
— |
|
|
|
10 |
|
| US ISR |
|
|
30 |
|
|
|
27 |
|
|
|
20 |
|
| Inkai |
|
|
15 |
|
|
|
19 |
|
|
|
15 |
|
|
|
|
|
|
|
|
|
|
|
|
|
|
| Total capacity replacement capital |
|
|
165 |
|
|
|
168 |
|
|
|
120 |
|
|
|
|
|
|
|
|
|
|
|
|
|
|
| Growth capital |
|
|
|
|
|
|
|
|
|
|
|
|
| McArthur River/Key Lake |
|
|
15 |
|
|
|
13 |
|
|
|
40 |
|
| Cigar Lake |
|
|
90 |
|
|
|
81 |
|
|
|
30 |
|
| Inkai |
|
|
15 |
|
|
|
11 |
|
|
|
10 |
|
| Fuel services |
|
|
5 |
|
|
|
1 |
|
|
|
5 |
|
| Other |
|
|
— |
|
|
|
1 |
|
|
|
— |
|
|
|
|
|
|
|
|
|
|
|
|
|
|
| Total growth capital |
|
|
125 |
|
|
|
107 |
|
|
|
85 |
|
|
|
|
|
|
|
|
|
|
|
|
|
|
| Total uranium & fuel services |
|
|
385 |
1 |
|
|
359 |
|
|
|
320 |
|
|
|
|
|
|
|
|
|
|
|
|
|
|
| 1 |
Capital spending outlook was updated to $385 million in our third quarter MD&A. |
- 6 -
Outlook for investing activities
|
|
|
|
|
| CAMECO’S SHARE ($ MILLIONS) |
|
2017 PLAN |
|
2018 PLAN |
|
|
|
|
|
| Total uranium & fuel services |
|
300-350 |
|
250-300 |
|
|
|
|
|
| Sustaining capital |
|
135-155 |
|
95-110 |
| Capacity replacement capital |
|
135-150 |
|
145-160 |
| Growth capital |
|
30-45 |
|
10-25 |
We expect total capital expenditures for uranium and fuel services to decrease by about 11% in 2016.
Major sustaining, capacity replacement and growth expenditures in 2016 include:
| • |
|
McArthur River/Key Lake – At McArthur River, the largest projects are the expansion of freeze capacity and mine development. Other projects include site facility and equipment purchases. At Key Lake, work will be
done to expand capacity in the solvent extraction and crystallization circuits of the mill. |
| • |
|
US in situ recovery (ISR) – wellfield construction represents the largest portion of our expenditures in the US. |
| • |
|
Rabbit Lake – At Eagle Point, the largest component is mine development, along with mine equipment upgrades and purchases. At the mill, we plan to optimize tailings capacity and work on various mill facility and
equipment replacements. |
| • |
|
Cigar Lake – Work to expand freezing capacity makes up the largest portion of capital at the Cigar Lake site. We are also paying our share of the costs to modify and expand the McClean Lake mill. |
We previously expected to spend between $350 million and $400 million in 2017. We now expect to spend between $300 million and $350 million in 2017. Due to
the continued market uncertainty, we have reduced growth capital to focus on our tier-one properties.
This information regarding currently expected
capital expenditures for future periods is forward-looking information, and is based upon the assumptions and subject to the material risks discussed on pages 21 and 22. Our actual capital expenditures for future periods may be significantly
different.
REVENUE, CASH FLOW AND EARNINGS SENSITIVITY ANALYSIS
For 2016:
| • |
|
An increase of $5 (US) per pound in each of the Ux spot price ($34.65 (US) per pound on February 1, 2016) and the Ux long-term price indicator ($44.00 (US) per pound on
January 25, 2016) would change revenue by $72 million and net earnings by $56 million. Conversely, a decrease of $5 (US) per pound would decrease revenue by $69 million and net earnings by $54 million. |
| • |
|
A one cent change in the value of the Canadian dollar versus the US dollar would change adjusted net earnings by $8 million and cash flow by $1 million, with a decrease in the value of the Canadian dollar versus the US
dollar having a positive impact. |
URANIUM SEGMENT OUTLOOK
We expect to produce 30.0 million pounds in 2016 and have commitments under long-term contracts to purchase approximately 9 million pounds.
Based on the contracts we have in place, and not including sales between our segments, we expect to deliver between 30 million and 32 million pounds
of U3O8 in 2016. We expect the unit cost of sales to be up to 5% higher than in 2015, primarily due to the planned purchases during the
year. If we make additional discretionary purchases in 2016 at a cost different than our other sources of supply, then we expect the overall unit cost of sales to be affected.
We expect revenue to be up to 5% lower than in 2015 as a result of an expected decrease in deliveries, not including sales between our segments, partially
offset by a higher average realized price.
In our uranium and fuel services segments, our customers choose when in the year to receive deliveries. As a
result, our quarterly delivery patterns and, therefore, our sales volumes and revenue can vary significantly as shown below. We expect the quarterly distribution of uranium deliveries in 2016 to be weighted to the second half of the year. However,
not all delivery notices have been received to date and the expected delivery pattern could change. Typically, we receive notices six months in advance of the requested delivery date.
- 7 -
PRICE SENSITIVITY ANALYSIS: URANIUM SEGMENT
The following table is not a forecast of prices we expect to receive. The prices we actually realize will be different from the prices shown in the table. It
is designed to indicate how the portfolio of long-term contracts we had in place on December 31, 2015 would respond to different spot prices. In other words, we would realize these prices only if the contract portfolio remained the same as it
was on December 31, 2015, and none of the assumptions we list below change.
We intend to update this table each quarter in our MD&A to reflect
deliveries made and changes to our contract portfolio. As a result, we expect the table to change from quarter to quarter.
Expected realized uranium
price sensitivity under various spot price assumptions
|
|
|
|
|
|
|
|
|
|
|
|
|
|
|
|
|
|
|
|
|
|
|
|
|
|
|
|
|
| (rounded to the nearest $1.00) |
|
|
|
|
|
|
|
|
|
|
|
|
|
|
|
|
|
|
|
|
|
| SPOT PRICES
($US/lb U3O8) |
|
$20 |
|
|
$40 |
|
|
$60 |
|
|
$80 |
|
|
$100 |
|
|
$120 |
|
|
$140 |
|
| 2016 |
|
|
41 |
|
|
|
46 |
|
|
|
56 |
|
|
|
65 |
|
|
|
75 |
|
|
|
84 |
|
|
|
93 |
|
| 2017 |
|
|
39 |
|
|
|
46 |
|
|
|
56 |
|
|
|
67 |
|
|
|
78 |
|
|
|
87 |
|
|
|
94 |
|
| 2018 |
|
|
39 |
|
|
|
47 |
|
|
|
58 |
|
|
|
69 |
|
|
|
80 |
|
|
|
90 |
|
|
|
97 |
|
| 2019 |
|
|
39 |
|
|
|
47 |
|
|
|
59 |
|
|
|
70 |
|
|
|
79 |
|
|
|
88 |
|
|
|
94 |
|
| 2020 |
|
|
42 |
|
|
|
49 |
|
|
|
59 |
|
|
|
70 |
|
|
|
79 |
|
|
|
86 |
|
|
|
93 |
|
The table illustrates the mix of long-term contracts in our December 31, 2015 portfolio, and is consistent with our
marketing strategy. It has been updated to reflect deliveries made and contracts entered into up to December 31, 2015.
Our portfolio includes a mix
of fixed-price and market-related contracts, which we target at a 40:60 ratio. Those that are fixed at lower prices or have low ceiling prices will yield prices that are lower than current market prices.
Our portfolio is affected by more than just the spot price. We made the following assumptions (which are not forecasts) to create the table:
Sales
| • |
|
sales volumes on average of 27 million pounds per year, with commitment levels in 2016 through 2018 higher than in 2019 and 2020 |
| • |
|
excludes sales between our uranium, fuel services and NUKEM segments |
Deliveries
| • |
|
deliveries include best estimates of requirements contracts and contracts with volume flex provisions |
Annual inflation
Prices
| • |
|
the average long-term price indicator is the same as the average spot price for the entire year (a simplified approach for this purpose only). Since 1996, the long-term price indicator has averaged 19% higher than the
spot price. This differential has varied significantly. Assuming the long-term price is at a premium to spot, the prices in the table and graph will be higher. |
FUEL SERVICES OUTLOOK
In 2016, we plan to produce 8 million to 9 million kgU, and we expect sales volumes, not including intersegment sales, to be up to 5% lower than in
2015. Overall revenue is expected to increase by up to 5% as lower sales volumes will be more than offset by an increase in the average realized price. We expect the average unit cost of sales (including D&A) to increase by 10% to 15%;
therefore, overall gross profit will decrease as a result.
NUKEM OUTLOOK
For 2016, NUKEM expects to deliver between 9 million and 10 million pounds of uranium. Total revenue and unit cost of sales, not including
intersegment sales, is expected to increase by 5% to 10% compared to 2015; however, the overall gross profit percentage is expected to be slightly lower than 2015 at 4% to 5%.
Non-IFRS measures
ADJUSTED NET EARNINGS
Adjusted net earnings is a measure
that does not have a standardized meaning or a consistent basis of calculation under IFRS (non-IFRS measure). We use this measure as a more meaningful way to compare our financial performance from period to period. We believe that, in addition to
conventional measures prepared in accordance with IFRS, certain investors use this information to evaluate our performance. Adjusted net earnings is our net earnings attributable to equity holders, adjusted to
- 8 -
better reflect the underlying financial performance for the reporting period. The adjusted earnings measure reflects the matching of the net benefits of our hedging program with the inflows of
foreign currencies in the applicable reporting period, and adjusted for impairment charges, the write-off of assets, NUKEM inventory write-down, gain on interest in BPLP (after tax), and income taxes on adjustments.
Adjusted net earnings is non-standard supplemental information and should not be considered in isolation or as a substitute for financial information prepared
according to accounting standards. Other companies may calculate this measure differently, so you may not be able to make a direct comparison to similar measures presented by other companies.
To facilitate a better understanding of these measures, the table below reconciles adjusted net earnings with our net earnings for the years ended 2015 and
2014, and three months ended December 31, 2015 and December 31, 2014.
|
|
|
|
|
|
|
|
|
|
|
|
|
|
|
|
|
| |
|
THREE MONTHS ENDED
DECEMBER 31 |
|
|
YEAR ENDED
DECEMBER 31 |
|
| ($ MILLIONS) |
|
2015 |
|
|
2014 |
|
|
2015 |
|
|
2014 |
|
| Net earnings (loss) attributable to equity holders |
|
|
(10 |
) |
|
|
73 |
|
|
|
65 |
|
|
|
185 |
|
|
|
|
|
|
|
|
|
|
|
|
|
|
|
|
|
|
| Adjustments |
|
|
|
|
|
|
|
|
|
|
|
|
|
|
|
|
| Adjustments on derivatives (pre-tax) |
|
|
10 |
|
|
|
10 |
|
|
|
166 |
|
|
|
47 |
|
| NUKEM purchase price inventory recovery |
|
|
— |
|
|
|
(4 |
) |
|
|
(3 |
) |
|
|
(5 |
) |
| Impairment charges |
|
|
210 |
|
|
|
131 |
|
|
|
215 |
|
|
|
327 |
|
| Income taxes on adjustments |
|
|
(59 |
) |
|
|
(46 |
) |
|
|
(99 |
) |
|
|
(56 |
) |
| Write-off of assets |
|
|
— |
|
|
|
41 |
|
|
|
— |
|
|
|
41 |
|
| Gain on interest in BPLP (after tax) |
|
|
— |
|
|
|
— |
|
|
|
— |
|
|
|
(127 |
) |
|
|
|
|
|
|
|
|
|
|
|
|
|
|
|
|
|
| Adjusted net earnings |
|
|
151 |
|
|
|
205 |
|
|
|
344 |
|
|
|
412 |
|
|
|
|
|
|
|
|
|
|
|
|
|
|
|
|
|
|
TRANSFER PRICING DISPUTES
We have been reporting on our transfer pricing disputes with CRA since 2008, when it originated, and with the United States Internal Revenue Service (IRS)
since the first quarter of 2015. Below, we discuss the general nature of transfer pricing disputes and, more specifically, the ongoing disputes we have.
Transfer pricing is a complex area of tax law, and it is difficult to predict the outcome of cases like ours. However, tax authorities generally test two
things:
| • |
|
the governance (structure) of the corporate entities involved in the transactions |
| • |
|
the price at which goods and services are sold by one member of a corporate group to another |
We have a global
customer base and we established a marketing and trading structure involving foreign subsidiaries, including Cameco Europe Limited (CEL), which entered into various intercompany arrangements, including purchase and sale agreements, as well as
uranium purchase and sale agreements with third parties. Cameco and its subsidiaries made reasonable efforts to put arm’s-length transfer pricing arrangements in place, and these arrangements expose the parties to the risks and rewards accruing
to them under these contracts. The intercompany contract prices are generally comparable to those established in comparable contracts between arm’s-length parties entered into at that time.
For the years 2003 to 2010, CRA has shifted CEL’s income (as recalculated by CRA) back to Canada and applied statutory tax rates, interest and instalment
penalties, and, from 2007 to 2009, transfer pricing penalties. There has not yet been a decision regarding a transfer pricing penalty for 2010. The IRS also allocated a portion of CEL’s income for the years 2009 through 2012 to the US,
resulting in such income being taxed in multiple jurisdictions. Taxes of approximately $320 million for the 2003 – 2015 years have already been paid in a jurisdiction outside Canada and the US. Bilateral international tax treaties contain
provisions that generally seek to prevent taxation of the same income in both countries. As such, in connection with these disputes, we are considering our options, including remedies under international tax treaties that would limit double
taxation; however, there is a risk that we will not be successful in eliminating all potential double taxation. The expected income adjustments under our tax disputes are represented by the amounts claimed by CRA and IRS and are described below.
- 9 -
CRA dispute
Since 2008, CRA has disputed our corporate structure and the related transfer pricing methodology we used for certain intercompany uranium sale and purchase
agreements. To the end of 2014, we received notices of reassessment for our 2003 through 2009 tax returns, and, in the fourth quarter of 2015, we received a notice of reassessment for our 2010 tax year. We have recorded a cumulative tax provision of
$50 million (September 30, 2015 - $92 million), where an argument could be made that our transfer price may have fallen outside of an appropriate range of pricing in uranium contracts for the period from 2003 through 2015. We have reduced the
provision to reflect management’s revised estimate, which takes into account additional contract information. We are confident that we will be successful in our case and continue to believe the ultimate resolution of this matter will not be
material to our financial position, results of operations and cash flows in the year(s) of resolution.
For the years 2003 through 2010, CRA issued
notices of reassessment for approximately $3.4 billion of additional income for Canadian tax purposes, which would result in a related tax expense of about $1.1 billion. CRA has also issued notices of reassessment for transfer pricing penalties for
the years 2007 through 2009 in the amount of $229 million. The Canadian income tax rules include provisions that require larger companies like us to remit or otherwise secure 50% of the cash tax plus related interest and penalties at the time of
reassessment. To date, under these provisions, after applying elective deductions, we have paid a net amount of $232 million cash. In addition, we have provided $332 million in letters of credit (LC) to secure 50% of the cash taxes and related
interest amounts reassessed in 2015. The amounts paid or secured are shown in the table below.
|
|
|
|
|
|
|
|
|
|
|
|
|
|
|
|
|
|
|
|
|
|
|
|
|
| YEAR PAID ($ MILLIONS) |
|
CASH TAXES |
|
|
INTEREST
AND INSTALMENT
PENALTIES |
|
|
TRANSFER
PRICING
PENALTIES |
|
|
TOTAL |
|
|
CASH
REMITTANCE |
|
|
SECURED BY
LC |
|
| Prior to 2013 |
|
|
— |
|
|
|
13 |
|
|
|
— |
|
|
|
13 |
|
|
|
13 |
|
|
|
— |
|
| 2013 |
|
|
1 |
|
|
|
9 |
|
|
|
36 |
|
|
|
46 |
|
|
|
46 |
|
|
|
— |
|
| 2014 |
|
|
106 |
|
|
|
47 |
|
|
|
— |
|
|
|
153 |
|
|
|
153 |
|
|
|
— |
|
| 2015 |
|
|
202 |
|
|
|
71 |
|
|
|
79 |
|
|
|
352 |
|
|
|
20 |
|
|
|
332 |
|
|
|
|
|
|
|
|
|
|
|
|
|
|
|
|
|
|
|
|
|
|
|
|
|
|
| Total |
|
|
309 |
|
|
|
140 |
|
|
|
115 |
|
|
|
564 |
|
|
|
232 |
|
|
|
332 |
|
|
|
|
|
|
|
|
|
|
|
|
|
|
|
|
|
|
|
|
|
|
|
|
|
|
Using the methodology we believe CRA will continue to apply, and including the $3.4 billion already reassessed, we expect to
receive notices of reassessment for a total of approximately $7.0 billion of additional income taxable in Canada for the years 2003 through 2015, which would result in a related tax expense of approximately $2.1 billion. As well, CRA may continue to
apply transfer pricing penalties to taxation years subsequent to 2009. As a result, we estimate that cash taxes and transfer pricing penalties for these years would be between $1.65 billion and $1.70 billion. In addition, we estimate there would be
interest and instalment penalties applied that would be material to us. While in dispute, we would be responsible for remitting or otherwise providing security for 50% of the cash taxes and transfer pricing penalties (between $825 million and $850
million), plus related interest and instalment penalties assessed, which would be material to us.
Under the Canadian federal and provincial tax rules,
the amount required to be paid or secured each year will depend on the amount of income reassessed in that year and the availability of elective deductions and tax loss carryovers. Recently, the CRA decided to disallow the use of any loss
carry-backs for any transfer pricing adjustment, starting with the 2008 tax year. This does not impact the anticipated income tax expense for a particular year, but does impact the timing of any required security or payment. As noted above, for the
2010 tax year, as an alternative to paying cash, we used letters of credit to satisfy our obligations related to the reassessed income tax and related interest amounts. We expect to be able to continue to provide security in the form of letters of
credit to satisfy these requirements. The estimated amounts summarized in the table below reflect actual amounts paid or secured and estimated future amounts owing based on the actual and expected reassessments for the years 2003 through 2015, and
include the expected timing adjustment for the inability to use any loss carry-backs starting in 2008. We will update this table annually to include the estimated impact of reassessments expected for completed years subsequent to 2015.
|
|
|
|
|
|
|
|
|
|
|
|
|
|
|
|
|
| $ MILLIONS |
|
2003-2015 |
|
|
2016-2017 |
|
|
2018-2023 |
|
|
TOTAL |
|
| 50% of cash taxes and transfer pricing penalties paid, secured or owing in the period |
|
| Cash payments |
|
|
156 |
|
|
|
155 - 180 |
|
|
|
30 - 55 |
|
|
|
335 - 360 |
|
| Secured by letters of credit |
|
|
264 |
|
|
|
95 - 120 |
|
|
|
20 - 45 |
|
|
|
425 - 450 |
|
|
|
|
|
|
|
|
|
|
|
|
|
|
|
|
|
|
| Total paid1 |
|
|
420 |
|
|
|
255 - 280 |
|
|
|
65 - 90 |
|
|
|
825 - 850 |
|
|
|
|
|
|
|
|
|
|
|
|
|
|
|
|
|
|
| 1 |
These amounts do not include interest and instalment penalties, which totaled approximately $140 million to December 31, 2015. |
- 10 -
In light of our view of the likely outcome of the case as described above, we expect to recover the amounts
remitted, including the $564 million already paid or otherwise secured to date.
We are expecting the trial for the 2003, 2005 and 2006 reassessments to
commence during the week of September 26, 2016, with final arguments in April 2017. If this timing is adhered to, we expect to receive a Tax Court decision within six to 18 months after the trial is complete.
IRS dispute
In the fourth quarter of 2015, we received a
Revenue Agents Report (RAR) from the IRS for the tax years 2010 to 2012. Similar to the 2009 RAR received in the first quarter of 2015, the IRS is challenging the transfer pricing used under certain intercompany transactions pertaining to the 2010
to 2012 tax years for certain of our US subsidiaries. The 2009 and 2010 to 2012 RARs list the adjustments proposed by the IRS and calculate the tax and any penalties owing based on the proposed adjustments.
The current position of the IRS is that a portion of the non-US income reported under our corporate structure and taxed in non-US jurisdictions should be
recognized and taxed in the US on the basis that:
| • |
|
the prices received by our US mining subsidiaries for the sale of uranium to CEL are too low |
| • |
|
the compensation earned by Cameco Inc., one of our US subsidiaries, is inadequate |
The proposed adjustments
result in an increase in taxable income in the US of approximately $419 million (US) and a corresponding increased income tax expense of approximately $122 million (US) for the 2009 through 2012 taxation years, with interest being charged thereon.
In addition, the IRS proposed cumulative penalties of approximately $8 million (US) in respect of the adjustment.
We believe that the conclusions of the
IRS in the RARs are incorrect and we are contesting them in an administrative appeal, during which we are not required to make any cash payments. Until this matter progresses further, we cannot provide an estimation of the likely timeline for a
resolution of the dispute.
We believe that the ultimate resolution of this matter will not be material to our financial position, results of operations
and cash flows in the year(s) of resolution.
Overview of disputes
The table below provides an overview of some of the key points with respect to our CRA and IRS tax disputes.
|
|
|
|
|
|
|
|
|
| |
|
|
|
CRA |
|
|
|
IRS |
| Basis for dispute |
|
• |
|
Corporate structure/governance |
|
• |
|
Income earned on sales of uranium by the US mines to CEL is inadequate |
|
|
|
|
|
|
|
• |
|
Transfer pricing methodology used for certain intercompany uranium sale and purchase agreements |
|
• |
|
Compensation earned by Cameco Inc., one of our US subsidiaries, is inadequate |
|
|
|
|
|
|
|
• |
|
Allocates Cameco Europe Ltd. (CEL) income (as adjusted) for 2003 through 2010 to Canada (same income we paid tax on in foreign jurisdictions and includes income that IRS is proposing to tax) |
|
• |
|
Allocates a portion of CEL’s income for the years 2009 through 2012 to the US (a portion of the same income we paid tax on in foreign jurisdictions and which the CRA is proposing to tax) |
|
|
|
|
|
| Years under consideration |
|
• |
|
CRA reassessed 2003 to 2010 |
|
• |
|
IRS has proposed adjustments for 2009 through 2012 |
|
|
• |
|
Auditing 2011 to 2012 |
|
|
|
|
|
|
|
|
| Timing of resolution |
|
• |
|
Expect our appeal of the 2003, 2005 and 2006 reassessments to commence during the week of September 26, 2016, with final arguments expected in April 2017 |
|
• |
|
Contesting proposed adjustments in an administrative appeal |
|
|
|
|
|
|
|
• |
|
Expect Tax Court decision six to 18 months after completion of trial |
|
• |
|
We cannot yet provide an estimate as to the timeline for resolution |
|
|
|
|
|
| Required payments |
|
• |
|
Expect to provide security in form of letters of credit and/or make cash payments for 50% of cash taxes, interest and penalties as reassessed |
|
• |
|
No security or cash payments required while under administrative appeal |
|
|
|
|
|
|
|
• |
|
Paid $232 million in cash to date |
|
|
|
|
|
|
|
|
|
|
|
• |
|
Secured $332 million using letters of credit |
|
|
|
|
- 11 -
Caution about forward-looking information relating to our CRA and IRS tax dispute
This discussion of our expectations relating to our tax disputes with CRA and IRS and future tax reassessments by CRA and IRS is forward-looking information
that is based upon the assumptions and subject to the material risks discussed under the heading Caution about forward-looking information beginning on page 21 and also on the more specific assumptions and risks listed below. Actual outcomes
may vary significantly.
Assumptions
| • |
|
CRA will reassess us for the years 2011 through 2015 using a similar methodology as for the years 2003 through 2010, and the reassessments will be issued on the basis we expect |
| • |
|
we will be able to apply elective deductions and utilize letters of credit to the extent anticipated |
| • |
|
CRA will seek to impose transfer pricing penalties (in a manner consistent with penalties charged in the years 2007 through 2009) in addition to interest charges and instalment penalties |
| • |
|
we will be substantially successful in our dispute with CRA and the cumulative tax provision of $50 million to date will be adequate to satisfy any tax liability resulting from the outcome of the dispute to date
|
| • |
|
IRS may propose adjustments for later years subsequent to 2012 |
| • |
|
we will be substantially successful in our dispute with IRS
|
Material risks that could cause actual results to differ materially
| • |
|
CRA reassesses us for years 2011 through 2015 using a different methodology than for years 2003 through 2010, or we are unable to utilize elective deductions or letters of credit to the extent anticipated, resulting in
the required cash payments or security provided to CRA pending the outcome of the dispute being higher than expected |
| • |
|
the time lag for the reassessments for each year is different than we currently expect |
| • |
|
we are unsuccessful and the outcomes of our dispute with CRA and/or IRS result in significantly higher cash taxes, interest charges and penalties than the amount of our cumulative tax provision, which could have a
material adverse effect on our liquidity, financial position, results of operations and cash flows |
| • |
|
cash tax payable increases due to unanticipated adjustments by CRA or IRS not related to transfer pricing |
| • |
|
IRS proposes adjustments for years 2013 through 2015 using a different methodology than for 2009 through 2012 |
| • |
|
we are unable to effectively eliminate all double taxation |
2015 financial results by segment
Uranium results
|
|
|
|
|
|
|
|
|
|
|
|
|
|
|
|
|
|
|
|
|
|
|
|
|
|
|
|
|
| |
|
|
|
|
THREE MONTHS ENDED
DECEMBER 31 |
|
|
|
|
|
YEAR ENDED
DECEMBER 31 |
|
|
|
|
| HIGHLIGHTS |
|
|
|
|
2015 |
|
|
2014 |
|
|
CHANGE |
|
|
2015 |
|
|
2014 |
|
|
CHANGE |
|
| Production volume (million lbs) |
|
|
|
|
|
|
9.6 |
|
|
|
8.2 |
|
|
|
17 |
% |
|
|
28.4 |
|
|
|
23.3 |
|
|
|
22 |
% |
| Sales volume (million lbs)1 |
|
|
|
|
|
|
11.2 |
|
|
|
10.7 |
|
|
|
5 |
% |
|
|
32.4 |
|
|
|
33.9 |
|
|
|
(4 |
)% |
| Average spot price |
|
($ |
US/lb |
) |
|
|
35.45 |
|
|
|
37.13 |
|
|
|
(5 |
)% |
|
|
36.55 |
|
|
|
33.21 |
|
|
|
10 |
% |
| Average long-term price |
|
($ |
US/lb |
) |
|
|
44.00 |
|
|
|
48.00 |
|
|
|
(8 |
)% |
|
|
46.29 |
|
|
|
46.46 |
|
|
|
— |
|
| Average realized price |
|
($ |
US/lb |
) |
|
|
46.36 |
|
|
|
50.57 |
|
|
|
(8 |
)% |
|
|
45.19 |
|
|
|
47.53 |
|
|
|
(5 |
)% |
|
|
($ |
Cdn/lb |
) |
|
|
61.24 |
|
|
|
56.78 |
|
|
|
8 |
% |
|
|
57.58 |
|
|
|
52.37 |
|
|
|
10 |
% |
| Average unit cost of sales (including D&A) |
|
($ |
Cdn/lb |
) |
|
|
38.25 |
|
|
|
34.27 |
|
|
|
12 |
% |
|
|
38.83 |
|
|
|
34.64 |
|
|
|
12 |
% |
| Revenue ($ millions)1 |
|
|
|
|
|
|
687 |
|
|
|
606 |
|
|
|
13 |
% |
|
|
1,866 |
|
|
|
1,777 |
|
|
|
5 |
% |
| Gross profit ($ millions) |
|
|
|
|
|
|
257 |
|
|
|
240 |
|
|
|
7 |
% |
|
|
608 |
|
|
|
602 |
|
|
|
1 |
% |
| Gross profit (%) |
|
|
|
|
|
|
37 |
|
|
|
40 |
|
|
|
(8 |
)% |
|
|
33 |
|
|
|
34 |
|
|
|
(3 |
)% |
| 1 |
Includes sales and revenue between our uranium, fuel services and NUKEM segments (17,000 pounds in sales and revenue of $0.5 million in Q4 2015, 400,000 pounds in sales and revenue of $15 million in Q4 2014, and 32,000
pounds in sales and revenue of $1.0 million in 2015, 1.4 million pounds in sales and revenue of $48 million in 2014). |
FOURTH
QUARTER
Production volumes this quarter were 17% higher compared to the fourth quarter of 2014, mainly as a result of higher production from the
rampup of Cigar Lake production, offset by lower production at McArthur River/Key Lake, Rabbit Lake and our US ISR operations. See Our operations starting on page 15 for more information.
- 12 -
Uranium revenues were up 13% due to a 5% increase in sales volumes, which represents normal quarterly variance in
our delivery schedule, and an 8% increase in the average realized price.
Average spot and long-term prices decreased, as did our US dollar average
realized price due to lower prices under fixed-price contracts, and the mix of market and fixed contracts. However, the effect of foreign exchange resulted in an 8% higher Canadian dollar average realized price than the prior year. In the fourth
quarter of 2015, our realized foreign exchange rate was $1.32 compared to $1.12 in the prior year.
Total cost of sales (including D&A) increased by
17% ($429 million compared to $366 million in 2014). This was the result of a 12% increase in the average unit cost of sales and a 5% increase in sales volumes.
The unit cost of sales increased due to an increase in the volume of material purchased throughout the year at prices higher than our average cost of
inventory and an increase in the unit production costs related to the addition of higher cost production from Cigar Lake during rampup.
The net effect
was a $17 million increase in gross profit for the quarter.
FULL YEAR
Production volumes in 2015 increased by 22% compared to 2014. Lower production at our US ISR operations was more than offset by the rampup of Cigar Lake
production. See Our operations starting on page 15 for more information.
Uranium revenues this year were up 5% compared to 2014 due to an increase
of 10% in the Canadian dollar average realized price, partially offset by a decrease in sales volumes of 4%. The spot price for uranium averaged $36.55 (US) per pound in 2015, an increase of 10% compared to the 2014 average price of $33.21 (US) per
pound; however, our US dollar average realized price was lower mainly due to lower prices under fixed price contracts. The effect of foreign exchange resulted in a higher Canadian dollar average realized price than in the prior year. The realized
foreign exchange rate was $1.27 compared to $1.10 in 2014.
Total cost of sales (including D&A) increased by 7% ($1.26 billion compared to $1.18
billion in 2014) due to higher unit cost of sales offset by lower sales volumes. The higher unit cost of sales was mainly the result of an increase in the volume of material purchased at prices higher than our average cost of inventory, and an
increase in unit production costs related to the addition of higher costs from Cigar Lake during rampup.
The net effect was a $6 million increase in
gross profit for the year.
The following table shows the costs of produced and purchased uranium incurred in the reporting periods (non-IFRS measures,
see below). These costs do not include selling costs such as royalties, transportation and commissions, nor do they reflect the impact of opening inventories on our reported cost of sales.
|
|
|
|
|
|
|
|
|
|
|
|
|
|
|
|
|
|
|
|
|
|
|
|
|
| |
|
THREE MONTHS ENDED
DECEMBER 31 |
|
|
|
|
|
YEAR ENDED
DECEMBER 31 |
|
|
|
|
| ($CDN/LB) |
|
2015 |
|
|
2014 |
|
|
CHANGE |
|
|
2015 |
|
|
2014 |
|
|
CHANGE |
|
| Produced |
|
|
|
|
|
|
|
|
|
|
|
|
|
|
|
|
|
|
|
|
|
|
|
|
| Cash cost |
|
|
16.04 |
|
|
|
14.19 |
|
|
|
13 |
% |
|
|
20.62 |
|
|
|
18.66 |
|
|
|
11 |
% |
| Non-cash cost |
|
|
10.96 |
|
|
|
7.15 |
|
|
|
53 |
% |
|
|
11.51 |
|
|
|
9.30 |
|
|
|
24 |
% |
|
|
|
|
|
|
|
|
|
|
|
|
|
|
|
|
|
|
|
|
|
|
|
|
|
| Total production cost |
|
|
27.00 |
|
|
|
21.34 |
|
|
|
27 |
% |
|
|
32.13 |
|
|
|
27.96 |
|
|
|
15 |
% |
|
|
|
|
|
|
|
|
|
|
|
|
|
|
|
|
|
|
|
|
|
|
|
|
|
| Quantity produced (million lbs) |
|
|
9.6 |
|
|
|
8.2 |
|
|
|
17 |
% |
|
|
28.4 |
|
|
|
23.3 |
|
|
|
22 |
% |
|
|
|
|
|
|
|
|
|
|
|
|
|
|
|
|
|
|
|
|
|
|
|
|
|
| Purchased |
|
|
|
|
|
|
|
|
|
|
|
|
|
|
|
|
|
|
|
|
|
|
|
|
| Cash cost1 |
|
|
43.65 |
|
|
|
39.03 |
|
|
|
12 |
% |
|
|
46.02 |
|
|
|
38.17 |
|
|
|
21 |
% |
|
|
|
|
|
|
|
|
|
|
|
|
|
|
|
|
|
|
|
|
|
|
|
|
|
| Quantity purchased (million lbs) |
|
|
3.2 |
|
|
|
3.7 |
|
|
|
(14 |
)% |
|
|
12.5 |
|
|
|
7.1 |
|
|
|
76 |
% |
|
|
|
|
|
|
|
|
|
|
|
|
|
|
|
|
|
|
|
|
|
|
|
|
|
| Totals |
|
|
|
|
|
|
|
|
|
|
|
|
|
|
|
|
|
|
|
|
|
|
|
|
| Produced and purchased costs1 |
|
|
31.16 |
|
|
|
26.84 |
|
|
|
16 |
% |
|
|
36.38 |
|
|
|
30.34 |
|
|
|
20 |
% |
|
|
|
|
|
|
|
|
|
|
|
|
|
|
|
|
|
|
|
|
|
|
|
|
|
| Quantities produced and purchased (million lbs) |
|
|
12.8 |
|
|
|
11.9 |
|
|
|
8 |
% |
|
|
40.9 |
|
|
|
30.4 |
|
|
|
35 |
% |
|
|
|
|
|
|
|
|
|
|
|
|
|
|
|
|
|
|
|
|
|
|
|
|
|
| 1 |
In the fourth quarter of 2015, cash costs of purchased material were $33.79 (US) per pound compared to $35.05 (US) per pound in the same period in 2014. In the fourth quarter of 2015, the exchange rate on purchases
averaged $1.00 (US) for $1.29 (Cdn) compared to $1.00 (US) for $1.11 (Cdn) during the same period in 2014. Cash costs of purchased material in 2015 were $36.57 (US) per pound compared to $34.51 (US) per pound in 2014. In 2015, the exchange rate on
purchases averaged $1.00 (US) for $1.26 (Cdn) compared to $1.00 (US) for $1.11 (Cdn) in 2014. |
- 13 -
Cash cost per pound, non-cash cost per pound and total cost per pound for produced and purchased uranium
presented in the above table are non-IFRS measures. These measures do not have a standardized meaning or a consistent basis of calculation under IFRS. We use these measures in our assessment of the performance of our uranium business. We believe
that, in addition to conventional measures prepared in accordance with IFRS, certain investors use this information to evaluate our performance and ability to generate cash flow.
These measures are non-standard supplemental information and should not be considered in isolation or as a substitute for measures of performance prepared
according to accounting standards. These measures are not necessarily indicative of operating profit or cash flow from operations as determined under IFRS. Other companies may calculate these measures differently, so you may not be able to make a
direct comparison to similar measures presented by other companies.
To facilitate a better understanding of these measures, the following table presents
a reconciliation of these measures to our unit cost of sales for the years ended 2015 and 2014 and three months ended December 31, 2015 and December 31, 2014 as reported in our financial statements.
Cash and total cost per pound reconciliation
|
|
|
|
|
|
|
|
|
|
|
|
|
|
|
|
|
| |
|
THREE MONTHS ENDED |
|
|
YEAR ENDED |
|
| |
|
DECEMBER 31 |
|
|
DECEMBER 31 |
|
| ($ MILLIONS) |
|
2015 |
|
|
2014 |
|
|
2015 |
|
|
2014 |
|
| Cost of product sold |
|
|
328.3 |
|
|
|
269.0 |
|
|
|
989.2 |
|
|
|
902.8 |
|
| Add / (subtract) |
|
|
|
|
|
|
|
|
|
|
|
|
|
|
|
|
| Royalties |
|
|
(49.5 |
) |
|
|
(34.5 |
) |
|
|
(116.5 |
) |
|
|
(91.2 |
) |
| Standby charges |
|
|
— |
|
|
|
— |
|
|
|
— |
|
|
|
(24.8 |
) |
| Other selling costs |
|
|
(6.7 |
) |
|
|
(2.3 |
) |
|
|
(13.8 |
) |
|
|
(9.0 |
) |
| Change in inventories |
|
|
21.5 |
|
|
|
28.5 |
|
|
|
301.8 |
|
|
|
(71.9 |
) |
|
|
|
|
|
|
|
|
|
|
|
|
|
|
|
|
|
| Cash operating costs (a) |
|
|
293.6 |
|
|
|
260.7 |
|
|
|
1,160.7 |
|
|
|
705.9 |
|
| Add / (subtract) |
|
|
|
|
|
|
|
|
|
|
|
|
|
|
|
|
| Depreciation and amortization |
|
|
100.9 |
|
|
|
96.7 |
|
|
|
269.1 |
|
|
|
272.6 |
|
| Change in inventories |
|
|
4.3 |
|
|
|
(38.0 |
) |
|
|
58.1 |
|
|
|
(56.2 |
) |
|
|
|
|
|
|
|
|
|
|
|
|
|
|
|
|
|
| Total operating costs (b) |
|
|
398.8 |
|
|
|
319.4 |
|
|
|
1,487.9 |
|
|
|
922.3 |
|
|
|
|
|
|
|
|
|
|
|
|
|
|
|
|
|
|
| Uranium produced & purchased (million lbs) (c) |
|
|
12.8 |
|
|
|
11.9 |
|
|
|
40.9 |
|
|
|
30.4 |
|
|
|
|
|
|
|
|
|
|
|
|
|
|
|
|
|
|
| Cash costs per pound (a ÷ c) |
|
|
22.94 |
|
|
|
21.91 |
|
|
|
28.38 |
|
|
|
23.22 |
|
| Total costs per pound (b ÷ c) |
|
|
31.16 |
|
|
|
26.84 |
|
|
|
36.38 |
|
|
|
30.34 |
|
|
|
|
|
|
|
|
|
|
|
|
|
|
|
|
|
|
Fuel services results
|
|
|
|
|
|
|
|
|
|
|
|
|
|
|
|
|
|
|
|
|
|
|
|
|
|
|
|
|
| (includes results for UF6, UO2 and fuel fabrication) |
|
|
|
|
|
|
|
|
|
|
|
|
|
|
|
|
|
|
|
|
|
| |
|
|
|
|
THREE MONTHS ENDED |
|
|
|
|
|
YEAR ENDED |
|
|
|
|
| |
|
|
|
|
DECEMBER 31 |
|
|
|
|
|
DECEMBER 31 |
|
|
|
|
| HIGHLIGHTS |
|
|
|
|
2015 |
|
|
2014 |
|
|
CHANGE |
|
|
2015 |
|
|
2014 |
|
|
CHANGE |
|
| Production volume (million kgU) |
|
|
|
|
|
|
3.4 |
|
|
|
2.7 |
|
|
|
26 |
% |
|
|
9.7 |
|
|
|
11.6 |
|
|
|
(16 |
)% |
| Sales volume (million kgU)1 |
|
|
|
|
|
|
4.5 |
|
|
|
7.4 |
|
|
|
(39 |
)% |
|
|
13.6 |
|
|
|
15.5 |
|
|
|
(12 |
)% |
| Average realized price |
|
($ |
Cdn/kgU |
) |
|
|
21.88 |
|
|
|
16.92 |
|
|
|
29 |
% |
|
|
23.37 |
|
|
|
19.70 |
|
|
|
19 |
% |
| Average unit cost of sales (including D&A) |
|
($ |
Cdn/kgU |
) |
|
|
17.18 |
|
|
|
14.78 |
|
|
|
16 |
% |
|
|
18.87 |
|
|
|
17.24 |
|
|
|
9 |
% |
| Revenue ($ millions)1 |
|
|
|
|
|
|
99 |
|
|
|
125 |
|
|
|
(21 |
)% |
|
|
319 |
|
|
|
306 |
|
|
|
4 |
% |
| Gross profit ($ millions) |
|
|
|
|
|
|
21 |
|
|
|
16 |
|
|
|
31 |
% |
|
|
61 |
|
|
|
38 |
|
|
|
61 |
% |
| Gross profit (%) |
|
|
|
|
|
|
21 |
|
|
|
13 |
|
|
|
62 |
% |
|
|
19 |
|
|
|
12 |
|
|
|
58 |
% |
| 1 |
Includes sales and revenue between our uranium, fuel services and NUKEM segments (339,000 kgU in sales and revenue of $2.9 million in Q4 2015, 0.5 million kgU in sales and revenue of $4 million in Q4 2014, and
339,000 kgU in sales and revenue of $2.9 million in 2015, 0.5 million kgU in sales and revenue of $4 million in 2014). |
FOURTH
QUARTER
Total revenue decreased by 21% due to a 39% decrease in sales volumes, partially offset by a 29% increase in average realized price.
-14-
The total cost of sales (including D&A) decreased by 28% ($78 million compared to $109 million in the fourth
quarter of 2014) mainly due to a 39% decrease in sales volumes, partially offset by an increase of 16% in the average unit cost of sales, primarily as a result of the mix of products sold.
The net effect was a $5 million increase in gross profit.
FULL YEAR
Total revenue increased by 4% due to a 19%
increase in the realized price, partially offset by a 12% decrease in sales volumes.
The total cost of products and services sold (including D&A)
decreased by 4% compared to 2014 ($258 million compared to $268 million in 2014), as a 12% decrease in sales volumes was partially offset by a 9% increase in the average unit cost of sales (including D&A). When compared to 2014, the average unit
cost of sales was 9% higher due to the mix of fuel services products sold.
The net effect was a $23 million increase in gross profit.
NUKEM results
|
|
|
|
|
|
|
|
|
|
|
|
|
|
|
|
|
|
|
|
|
|
|
|
|
|
|
|
|
| |
|
|
|
|
THREE MONTHS ENDED |
|
|
|
|
|
YEAR ENDED |
|
|
|
|
| |
|
|
|
|
DECEMBER 31 |
|
|
|
|
|
DECEMBER 31 |
|
|
|
|
| HIGHLIGHTS |
|
|
|
|
2015 |
|
|
2014 |
|
|
CHANGE |
|
|
2015 |
|
|
2014 |
|
|
CHANGE |
|
| Sales volume U3O8
(million lbs)1 |
|
|
|
|
|
|
3.7 |
|
|
|
3.4 |
|
|
|
9 |
% |
|
|
10.7 |
|
|
|
8.1 |
|
|
|
32 |
% |
| Average realized price |
|
($ |
Cdn/lb |
) |
|
|
52.22 |
|
|
|
52.12 |
|
|
|
— |
|
|
|
48.82 |
|
|
|
44.90 |
|
|
|
9 |
% |
| Cost of product sold (including D&A) |
|
|
|
|
|
|
186 |
|
|
|
156 |
|
|
|
19 |
% |
|
|
512 |
|
|
|
327 |
|
|
|
57 |
% |
| Revenue ($ millions)1 |
|
|
|
|
|
|
192 |
|
|
|
159 |
|
|
|
21 |
% |
|
|
554 |
|
|
|
349 |
|
|
|
59 |
% |
| Gross profit ($ millions) |
|
|
|
|
|
|
6 |
|
|
|
3 |
|
|
|
100 |
% |
|
|
42 |
|
|
|
22 |
|
|
|
91 |
% |
| Gross profit (%) |
|
|
|
|
|
|
3 |
|
|
|
2 |
|
|
|
50 |
% |
|
|
8 |
|
|
|
6 |
|
|
|
33 |
% |
| 1 |
Includes sales and revenue between our uranium, fuel services and NUKEM segments (nil in Q4 2015, 1.1 million pounds in sales and revenue of $43 million in Q4 2014, and 0.9 million pounds in sales and revenue
of $19.3 million in 2015, 1.1 million pounds in sales and revenue of $43 million in 2014). |
FOURTH QUARTER
NUKEM delivered 3.7 million pounds of uranium, an increase of 0.3 million pounds compared to 2014. NUKEM revenues amounted to $192 million compared
to $159 million in 2014 due to an increase in volumes delivered.
Gross profit percentage was 3% in the fourth quarter of 2015, compared to 2% in the
fourth quarter of 2014.
The net effect was a $3 million increase in gross profit.
FULL YEAR
During 2015, NUKEM delivered 10.7 million
pounds of uranium, an increase of 2.6 million pounds compared to the previous year due to an increase in market activity. Revenues from NUKEM amounted to $554 million, 59% higher than in 2014 as a result of higher sales volumes and an increase
in the average realized price, mainly due to weakening of the Canadian dollar. Gross profit percentage was 8% for 2015, compared to 6% for 2014.
The net
effect was a $20 million increase in gross profit.
Our operations
|
|
|
|
|
|
|
|
|
|
|
|
|
|
|
|
|
|
|
|
|
|
|
|
|
| |
|
THREE MONTHS ENDED |
|
|
YEAR ENDED |
|
|
|
|
|
|
|
| CAMECO SHARE |
|
DECEMBER 31 |
|
|
DECEMBER 31 |
|
|
|
|
|
|
|
| (MILLION LBS) |
|
2015 |
|
|
2014 |
|
|
2015 |
|
|
2014 |
|
|
2015 PLAN1 |
|
|
2016 PLAN |
|
| McArthur River/Key Lake |
|
|
3.8 |
|
|
|
4.4 |
|
|
|
13.3 |
|
|
|
13.3 |
|
|
|
13.7 |
|
|
|
14.0 |
|
| Cigar Lake |
|
|
2.3 |
|
|
|
0.2 |
|
|
|
5.7 |
|
|
|
0.2 |
|
|
|
4.0 -5.0 |
|
|
|
8.0 |
2 |
| Inkai |
|
|
1.1 |
|
|
|
0.7 |
|
|
|
3.4 |
|
|
|
2.9 |
|
|
|
3.0 |
|
|
|
3.0 |
|
| Rabbit Lake |
|
|
2.0 |
|
|
|
2.1 |
|
|
|
4.2 |
|
|
|
4.2 |
|
|
|
3.9 |
|
|
|
3.6 |
|
| Smith Ranch-Highland |
|
|
0.3 |
|
|
|
0.6 |
|
|
|
1.4 |
|
|
|
2.1 |
|
|
|
1.4 |
|
|
|
1.2 |
|
| Crow Butte |
|
|
0.1 |
|
|
|
0.2 |
|
|
|
0.4 |
|
|
|
0.6 |
|
|
|
0.3 |
|
|
|
0.2 |
|
|
|
|
|
|
|
|
|
|
|
|
|
|
|
|
|
|
|
|
|
|
|
|
|
|
| Total |
|
|
9.6 |
|
|
|
8.2 |
|
|
|
28.4 |
|
|
|
23.3 |
|
|
|
26.3 - 27.3 |
|
|
|
30.0 |
2 |
|
|
|
|
|
|
|
|
|
|
|
|
|
|
|
|
|
|
|
|
|
|
|
|
|
| 1 |
We updated our initial 2015 plan for Cigar Lake (to 5 million pounds, from between 3 and 4 million pounds) in our Q3 MD&A. |
| 2 |
Our 2016 plan for packaged production from Cigar Lake is subject to regulatory approval for an annual production limit increase at the McClean Lake mill. See Cigar Lake starting on page 17 for more information.
|
- 15 -
Production Outlook
We remain focused on taking advantage of the long-term growth we see coming in our industry, while maintaining the ability to respond to market conditions as
they evolve. Our strategy is to focus on our tier-one assets and profitably produce at a pace aligned with market signals in order to increase long-term shareholder value.
We plan to:
| • |
|
ensure continued safe, reliable, low-cost production from our tier-one assets – McArthur River/Key Lake, Cigar Lake and Inkai |
| • |
|
complete rampup of production at Cigar Lake |
| • |
|
seek to expand production at McArthur River/Key Lake in conjunction with market signals |
| • |
|
manage the rest of our sources of supply in a manner that retains the flexibility to respond to market signals and take advantage of value adding opportunities within our own portfolio and the uranium market
|
| • |
|
maintain our low-cost advantage by focusing on execution and operational excellence |
MCARTHUR RIVER/KEY
LAKE
Production
Production from McArthur
River/Key Lake was 19.1 million pounds; our share was 13.3 million pounds. This was 3% lower than our forecast for the year due to unplanned maintenance outages to repair the calciner at Key Lake. Annual production was unchanged from 2014.
Licensing and production capacity
In 2015, the CNSC
approved our application to increase McArthur River’s licensed annual production to 25 million pounds (100% basis) to allow flexibility to match the approved Key Lake mill capacity. The licence conditions handbooks for these operations now
allow both operations to produce up to 25 million pounds (100% basis) per year.
Key Lake extension and McArthur River production expansion
In support of our strategy to maintain the flexibility to respond to market conditions as they evolve, we continue to advance projects that are
necessary to sustain and increase production when the market signals that additional production is needed.
The Key Lake mill began operating in 1983 and
we continue to upgrade circuits with new technology to simplify operations and improve environmental performance. The extension project involved increasing our tailings capacity and the mill’s nominal annual production rate to closely follow
production from the McArthur River mine. As part of the mill upgrades, we continue to construct and commission a new calciner circuit, and expect to begin operating with the new calciner in 2016. The existing calciner circuit will remain in place
until operational reliability of the new calciner is achieved. The calciner replacement project was planned in a way that temporarily allows us to use either calciner, which will help to mitigate risks to our production rate during the commissioning
phase. In order to increase production at Key Lake, we also need to optimize and expand the solvent extraction and crystallization circuits in the mill (projects planned for 2017).
At McArthur River, we must continue to successfully transition into new mine areas through mine development and investment in support infrastructure. We plan
to:
| • |
|
improve our dewatering system and expand our water treatment capacity as required to mitigate capacity losses, should mine development increase background water volumes |
| • |
|
expand the concrete distribution systems and batch plant capacity |
New mining areas
New mining zones and increased mine production require increased freeze capacity and ventilation. In 2015, we continued to upgrade our electrical
infrastructure on surface as part of our plan to address these future needs. We advanced groundworks to prepare for the next freeze plant, which is scheduled to begin freezing the south end of the orebody (zone 4) in 2017.
We also made changes in shaft 2 to increase air flow, resulting in a 15% to 20% improvement in ventilation capacity. The improved ventilation eliminates the
need for a new ventilation shaft to support a higher production rate.
- 16 -
Tailings capacity
We expect to have sufficient tailings capacity to mill all the known McArthur River mineral reserves and resources, should they be converted to reserves, with
additional capacity to toll mill ore from other regional deposits.
PLANNING FOR THE FUTURE AT MCARTHUR RIVER/KEY LAKE
Production
We plan to produce 20.0 million pounds in
2016; our share is 14.0 million pounds.
Expansion progress
As previously disclosed in our 2012 Technical Report, we plan to reach an annual capacity of 22 million pounds by 2018. The capital required to do so is
shown in our 2016 capital spending plan, and in our outlook for investing activities in 2017 and 2018, beginning on page 6.
As we increase to
22 million pounds per year, we will optimize the capacity of both the Key Lake mill and McArthur River mine with a view to further increasing production to 25 million pounds per year (100% basis), as market conditions improve. Using this
approach, we do not expect significant additional growth capital will be required to increase from annual production of 22 million pounds to an annual rate of 25 million pounds. We expect that this paced approach will allow us to extract
maximum value from the operation as the market transitions.
Exploration
In 2015, underground drilling further delineated the zone A mineral resources. Underground definition drilling of zone B will be conducted in 2016 and 2017 to
provide the information required for engineering work to develop more detailed mining plans.
CIGAR LAKE
Production
Total packaged production from Cigar Lake was
11.3 million pounds U3O8; our share was 5.7 million pounds. The operation exceeded our forecast of 10 million pounds (100%
basis) as a result of higher productivity and our intention to adjust annual production as necessary, based on our operating experience during rampup.
During the year, we:
| • |
|
completed commissioning of the equipment required to operate three JBS units at a production scale |
| • |
|
brought on additional slurry haul trucks to ensure a sufficient quantity of ore slurry can be transported to the McClean Lake mill |
| • |
|
completed final commissioning of underground processing circuits and updated our production rampup plan based on commissioning experience |
| • |
|
modified mine and project plans to reflect our decision to exclusively freeze from surface |
| • |
|
declared commercial production |
Commercial production
Commercial production signals a transition in the accounting treatment for costs incurred at the mine. Cigar Lake met all of the criteria for commercial
production, including cycle time and process specifications, in the second quarter of 2015. Therefore, effective May 1, 2015, we began charging all production costs, including depreciation, to inventory and subsequently recognizing them in cost
of sales as the product is sold.
Underground development
As a result of our decision to exclusively use surface freezing going forward, and the resulting change in the mine plan, the bulk of the development and
freeze drilling required for mining in 2016 is already complete. We are continuing to plan for future expansion of surface freezing infrastructure in late 2016.
- 17 -
McClean Lake mill update
Additional estimated expenditures of $50 million (100% basis, our share $25 million) are expected to be required at the McClean Lake mill in 2016, primarily to
complete upgrades in the tailings neutralization area in support of the continued rampup to full production of 18 million pounds per year.
PLANNING FOR THE FUTURE AT CIGAR LAKE
Production
In 2016, we expect to produce 16.0 million packaged pounds at Cigar Lake; our share is 8.0 million pounds.
In 2016, we also expect to:
| • |
|
extend the current surface freeze pad and advance planning for freeze plant infrastructure expansion to support future production |
| • |
|
advance underground development according to the new mine plan and backfill drifts no longer required for underground freezing operations |
| • |
|
continue ramping up towards the planned full annual production rate of 18 million pounds (100% basis) in 2017 |
Exploration
We are planning to conduct delineation
drilling from surface to confirm and upgrade resources contained in the western portion of the deposit. Approximately 65,000 metres of diamond drilling is planned over a three-year period, starting in 2016, in order to complete a detailed geological
and geotechnical interpretation, a resource estimate, and a technical study for the western portion of the deposit.
Rampup schedule
In 2017, we expect to reach full annual production of 18 million pounds (100% basis, 9 million pounds our share).
The McClean Lake mill’s operating licence currently has an annual production limit of 13 million pounds. AREVA has submitted an application to the
CNSC to increase the mill’s licensed annual production limit; our 2016 and 2017 production outlook for Cigar Lake is therefore subject to AREVA securing the regulatory approvals necessary to increase mill production.
Labour relations
The current collective agreement
between AREVA and unionized employees at the McClean Lake operation expires in May 2016. There is risk to our 2016 and 2017 production outlook for Cigar Lake if AREVA is unable to reach an agreement and there is a labour dispute.
INKAI
Production
Total production from Inkai was 5.8 million pounds; our share was 3.4 million pounds. Production was 17% higher than our production in 2014. During
2015, the subsoil use law in Kazakhstan was amended to allow producers to produce within 20% (above or below) their licensed capacity in a year. As a result, Inkai produced 5.8 million pounds in 2015, 11% higher than its licensed capacity. The
increase in production was the result of a higher head grade and an increase in wellfield development efficiency compared to 2014.
Project funding
As of December 31, 2015, Inkai had fully repaid the outstanding loan under our agreement to fund its project development costs related to blocks
1 and 2. In 2015, Inkai paid the remaining $0.8 million (US) in interest on the loan and repaid $55 million (US) of principal.
We are currently advancing
funds for Inkai’s work on block 3 and, as of December 31, 2015, the principal amounted to $148 million (US). Under the loan agreement, Inkai is to repay Cameco from the net sales proceeds from the sale of production from block 3.
- 18 -
Production expansion
In 2012, we entered into a binding memorandum of agreement (2012 MOA) with our joint venture partner, Kazatomprom, setting out a framework to:
| • |
|
increase Inkai’s annual production from blocks 1 and 2 to 10.4 million pounds (our share 5.2 million pounds) and sustain it at that level |
| • |
|
extend the term of Inkai’s resource use contract through 2045 |
Kazatomprom is pursuing a strategic
objective to develop uranium processing capacity in Kazakhstan to complement its leading uranium mining operations. Their primary focus is now on uranium refining, which is an intermediate step in the uranium conversion process. A Nuclear
Co-operation Agreement between Canada and Kazakhstan is in place, providing the international framework necessary for applying to the two governments for the required licences and permits. We expect to pursue further expansion of production at Inkai
at a pace measured to market opportunities. Discussions continue with Kazatomprom.
Block 3 exploration
In 2015, Inkai completed construction of the test leach facility and began pilot production from test wellfields, as well as advancing work on a preliminary
appraisal of the mineral potential of block 3 according to Kazakhstan standards.
Block 3 licence extension
The block 3 test leach facility is now operational and state commissioning of the test wellfields was accomplished during 2015. Our application for an
extension of the block 3 evaluation period is still pending final approval from the Ministry of Energy of the Republic of Kazakhstan. Inkai continues working on the final appraisal of the mineral potential of block 3 according to Kazakhstan
standards. Although a number of extensions of the licence term have been granted by Kazakh regulatory authorities in the past, there is no assurance that a further extension will be granted. Without such extension, there is a risk we could lose our
rights to block 3, and a risk we will not be compensated for the funds we advanced to Inkai to fund block 3 activities.
PLANNING FOR THE FUTURE AT
INKAI
Production
We expect total production from
blocks 1 and 2 to be 5.2 million pounds in 2016; our share is 3.0 million pounds. We expect to maintain production at this level until the potential growth plans are finalized with Kazatomprom.
Block 3 exploration
In 2016, Inkai expects to continue
with pilot production from the test leach facility and to continue working on a final appraisal of the mineral potential according to Kazakhstan standards.
RABBIT LAKE
Production
Production this year was unchanged from our 2014 production as a result of planned timing of production stopes, coupled with slightly improved ore grades.
Development and production continued at the Eagle Point mine. At the mill, we continued to improve the efficiency of the mill operation schedule.
Temporary mining restrictions
On December 17, 2015,
we announced that underground mining activities at Eagle Point were being restricted due to a rock fall in an inactive area of the mine. As a precautionary measure, non-essential personnel were removed from the mine while the condition of the
affected area was evaluated. Mine production was suspended, although milling of previously mined and transported ore continued through to year end.
- 19 -
The assessment determined that repairs were necessary to support the ground in the affected area of the mine. The
repairs were completed, along with some further assessment of stability in other areas of the mine. The mine was reopened and normal operations resumed on February 3, 2016.
PLANNING FOR THE FUTURE AT RABBIT LAKE
Production
We expect to produce 3.6 million pounds in 2016. The decrease compared to 2015 is the result of the restriction of mining activities at the end
of 2015, which extended into 2016.
Tailings capacity
Under our current licence, we expect to have sufficient tailings capacity to support milling of Eagle Point ore until about late 2017, based upon expected ore
tonnage, milling rates and tailings properties.
Our plan for fully utilizing the available tailings capacity of the Rabbit Lake In-Pit Tailings
Management facility requires regulatory approval in 2016 for which we have submitted the required applications. With these regulatory approvals and after we complete the necessary work on the existing pit, we expect to then have sufficient tailings
capacity to support milling of Eagle Point ore until at least 2021 based upon expected ore tonnage, milling rates, and tailings properties.
Exploration
We plan to continue our underground drilling
reserve replacement program in areas of interest north and northeast of the current mine workings in 2016. The drilling will be carried out from underground locations.
Reclamation
As part of our multi-year site-wide
reclamation plan, we spent over $0.7 million in 2015 to reclaim facilities that are no longer in use and plan to spend over $0.5 million in 2016.
FUEL
SERVICES
2015 UPDATE
Production
Fuel services produced 9.7 million kgU, 16% lower than 2014. This was a result of our decision to decrease production in response to weak market
conditions and the termination of our toll milling agreement with SFL in 2014.
Port Hope conversion facility cleanup and modernization (Vision in
Motion)
The Vision in Motion project is currently in the feasibility stage and will continue with the CNSC licensing process in 2016, which is
required to advance the project.
Labour relations
Approximately 100 unionized employees at Cameco Fuel Manufacturing Inc.’s operations in Port Hope and Cobourg, Ontario accepted a new collective
bargaining agreement in the second quarter of 2015. The employees, represented by the United Steelworkers local 14193, agreed to a three-year contract that includes a 7% wage increase over the term of the agreement. The previous contract expired on
June 1, 2015.
PLANNING FOR THE FUTURE AT FUEL SERVICES
Production
We have decreased our production target for
2016 to between 8 million and 9 million kgU in response to the continued weak market conditions.
Labour relations
The current collective bargaining agreement for our unionized employees at the Port Hope conversion facility expires on June 30, 2016. We will commence
the bargaining process in early 2016.
- 20 -
Regulatory
The current operating licence for the Port Hope conversion facility expires in February 2017. The CNSC relicensing process will take place in 2016.
Qualified persons
The technical and scientific
information discussed in this document for our material properties (McArthur River/Key Lake, Cigar Lake and Inkai) was approved by the following individuals who are qualified persons for the purposes of NI 43-101:
MCARTHUR RIVER/KEY LAKE
| • |
|
Alain G. Mainville, director, mineral resources management, Cameco |
| • |
|
David Bronkhorst, vice-president, mining and technology, Cameco |
| • |
|
Baoyao Tang, technical superintendent, McArthur River, Cameco |
CIGAR LAKE
| • |
|
Alain G. Mainville, director, mineral resources management, Cameco |
| • |
|
Leslie Yesnik, general manager, Cigar Lake, Cameco |
| • |
|
Scott Bishop, manager, technical services, Cameco
|
INKAI
| • |
|
Alain G. Mainville, director, mineral resources management, Cameco |
| • |
|
Darryl Clark, general manager, JV Inkai |
| • |
|
Lawrence Reimann, manager, technical services, Cameco Resources |
| • |
|
Bryan Soliz, principal geologist, mineral resources management, Cameco |
Caution about forward-looking
information
This document includes statements and information about our expectations for the future. When we discuss our strategy, plans, future
financial and operating performance, or other things that have not yet taken place, we are making statements considered to be forward-looking information or forward-looking statements under Canadian and United States securities laws.
We refer to them in this document as forward-looking information.
Key things to understand about the forward-looking information in this document:
| • |
|
It typically includes words and phrases about the future, such as: anticipate, believe, estimate, expect, plan, will, intend, goal, target, forecast, project, strategy and outlook (see examples below).
|
| • |
|
It represents our current views, and can change significantly. |
| • |
|
It is based on a number of material assumptions, including those we have listed on page 22, which may prove to be incorrect. |
| • |
|
Actual results and events may be significantly different from what we currently expect, due to the risks associated with our business. We list a number of these material risks on pages 21 and 22. We recommend you
also review our annual information form, which includes a discussion of other material risks that could cause actual results to differ significantly from our current expectations. |
| • |
|
Forward-looking information is designed to help you understand management’s current views of our near and longer term prospects, and it may not be appropriate for other purposes. We will not necessarily update this
information unless we are required to by securities laws. |
Examples of forward-looking information in this document
| • |
|
our consolidated outlook for the year and the outlook for our uranium, fuel services and NUKEM segments for 2016 |
| • |
|
our expectations for future tax payments and rates |
| • |
|
our expectations for future royalty payments |
| • |
|
our expectations for uranium deliveries in 2016 |
| • |
|
our price sensitivity analysis for our uranium segment |
| • |
|
our expectations for 2016, 2017 and 2018 capital expenditures |
| • |
|
the discussion of our expectations relating to our transfer pricing disputes including our estimate of the amount and timing of expected cash taxes and transfer pricing penalties |
| • |
|
our future plans and expectations for each of our uranium operating properties and fuel services operating sites
|
Material risks
| • |
|
actual sales volumes or market prices for any of our products or services are lower than we expect for any reason, including changes in market prices or loss of market share to a competitor |
| • |
|
we are adversely affected by changes in currency exchange rates, interest rates, royalty rates or tax rates |
| • |
|
our production costs are higher than planned, or necessary supplies are not available, or not available on commercially reasonable terms
|
| • |
|
our estimates of production, purchases, costs, decommissioning or reclamation expenses, or our tax expense estimates prove to be inaccurate |
| • |
|
we are unable to enforce our legal rights under our existing agreements, permits or licences |
| • |
|
we are subject to litigation or arbitration that has an adverse outcome, including lack of success in our disputes with tax authorities
|
- 21 -
| • |
|
we are unsuccessful in our dispute with CRA and this results in significantly higher cash taxes, interest charges and penalties than the amount of our cumulative tax provision |
| • |
|
we are unable to utilize letters of credit to the extent anticipated in our dispute with CRA |
| • |
|
there are defects in, or challenges to, title to our properties |
| • |
|
our mineral reserve and resource estimates are not reliable, or we face unexpected or challenging geological, hydrological or mining conditions |
| • |
|
we are affected by environmental, safety and regulatory risks, including increased regulatory burdens or delays |
| • |
|
we cannot obtain or maintain necessary permits or approvals from government authorities |
| • |
|
we are affected by political risks |
| • |
|
we are affected by terrorism, sabotage, blockades, civil unrest, social or political activism, accident or a deterioration in political support for, or demand for, nuclear energy |
| • |
|
we are impacted by changes in the regulation or public perception of the safety of nuclear power plants, which adversely affect the construction of new plants, the relicensing of existing plants and the demand for
uranium |
| • |
|
there are changes to government regulations or policies that adversely affect us, including tax and trade laws and policies
|
| • |
|
our uranium suppliers fail to fulfil delivery commitments |
| • |
|
our McArthur River development, mining or production plans are delayed or do not succeed for any reason |
| • |
|
our Cigar Lake development, mining or production plans are delayed or do not succeed, including as a result of any difficulties with freezing the deposit to meet production targets, or any difficulties with the McClean
Lake mill modifications or expansion or milling of Cigar Lake ore |
| • |
|
the production increase approval at McClean Lake is delayed or not obtained or there is a labour dispute at McClean Lake |
| • |
|
we are affected by natural phenomena, including inclement weather, fire, flood and earthquakes |
| • |
|
our operations are disrupted due to problems with our own or our customers’ facilities, the unavailability of reagents, equipment, operating parts and supplies critical to production, equipment failure, lack of
tailings capacity, labour shortages, labour relations issues (including an inability to renew the collective bargaining agreement with unionized employees at the Port Hope conversion facility), strikes or lockouts, underground floods, cave-ins,
ground movements, tailings dam failures, transportation disruptions or accidents, or other development and operating risks
|
Material assumptions
| • |
|
our expectations regarding sales and purchase volumes and prices for uranium and fuel services |
| • |
|
our expectations regarding the demand for uranium, the construction of new nuclear power plants and the relicensing of existing nuclear power plants not being more adversely affected than expected by changes in
regulation or in the public perception of the safety of nuclear power plants |
| • |
|
our expected production level and production costs |
| • |
|
the assumptions regarding market conditions upon which we have based our capital expenditures expectations |
| • |
|
our expectations regarding spot prices and realized prices for uranium, and other factors discussed under the heading Price sensitivity analysis: uranium segment |
| • |
|
our expectations regarding tax rates and payments, royalty rates, currency exchange rates and interest rates |
| • |
|
our expectations about the outcome of disputes with tax authorities |
| • |
|
we are able to utilize letters of credit to the extent anticipated in our dispute with CRA |
| • |
|
our decommissioning and reclamation expenses |
| • |
|
our mineral reserve and resource estimates, and the assumptions upon which they are based, are reliable |
| • |
|
the geological, hydrological and other conditions at our mines |
| • |
|
our McArthur River development, mining and production plans succeed
|
| • |
|
our Cigar Lake development, mining and production plans succeed, and the deposit freezes as planned |
| • |
|
modification and expansion of the McClean Lake mill are completed as planned and the mill is able to process Cigar Lake ore as expected |
| • |
|
the production increase approval at McClean Lake is approved by the regulator and there is no labour dispute at the McClean Lake mill |
| • |
|
our ability to continue to supply our products and services in the expected quantities and at the expected times |
| • |
|
our ability to comply with current and future environmental, safety and other regulatory requirements, and to obtain and maintain required regulatory approvals |
| • |
|
our operations are not significantly disrupted as a result of political instability, nationalization, terrorism, sabotage, blockades, civil unrest, breakdown, natural disasters, governmental or political actions,
litigation or arbitration proceedings, the unavailability of reagents, equipment, operating parts and supplies critical to production, labour shortages, labour relations issues (including an ability to renew the collective bargaining agreement with
unionized employees at the Port Hope conversion facility), strikes or lockouts, underground floods, cave-ins, ground movements, tailings dam failure, lack of tailings capacity, transportation disruptions or accidents or other development or
operating risks |
- 22 -
Conference call
We invite you to join our fourth quarter conference call on Monday, February 8, 2016 at 11:00 a.m. Eastern.
The call will be open to all investors and the media. To join the call, please dial (800) 769-8320 (Canada and US) or (416) 340-8530. An operator
will put your call through. A live audio feed of the conference call will be available from a link at cameco.com. See the link on our home page on the day of the call.
A recorded version of the proceedings will be available:
| • |
|
on our website, cameco.com, shortly after the call |
| • |
|
on post view until midnight, Eastern, March 13, 2016, by calling (800) 408-3053 (Canada and US) or (905) 694-9451 (Passcode 5846753) |
2016 quarterly report release dates
We plan to announce
our 2016 quarter results as follows:
| • |
|
first quarter consolidated financial and operating results: before markets open on April 29, 2016 |
| • |
|
second quarter consolidated financial and operating results: before markets open on July 28, 2016 |
| • |
|
third quarter consolidated financial and operating results: before markets open on November 2, 2016 |
The
2017 date for the announcement of our fourth quarter and 2016 consolidated financial and operating results will be provided in our 2016 third quarter MD&A. Announcement dates are subject to change.
Additional information
Our 2015 annual management’s
discussion and analysis, and annual audited financial statements, will be available shortly on our website at cameco.com, on SEDAR at sedar.com and on EDGAR at sec.gov/edgar.shtml. Our 2015 annual information form is expected to be available later
in March.
Profile
We are one of the world’s
largest uranium producers, a significant supplier of conversion services and one of two CANDU fuel manufacturers in Canada. Our competitive position is based on our controlling ownership of the world’s largest high-grade reserves and low-cost
operations. Our uranium products are used to generate clean electricity in nuclear power plants around the world. We also explore for uranium in the Americas, Australia and Asia. Our shares trade on the Toronto and New York stock exchanges. Our head
office is in Saskatoon, Saskatchewan.
As used in this news release, the terms we, us, our, the Company and Cameco mean Cameco Corporation and its
subsidiaries; including NUKEM Energy GmbH, unless otherwise indicated.
- End -
|
|
|
|
|
| Investor inquiries: |
|
Rachelle Girard |
|
(306) 956-6403 |
|
|
|
| Media inquiries: |
|
Gord Struthers |
|
(306) 956-6593 |
- 23 -

Cameco Corporation
2015 consolidated financial statements
February 4,
2016
Report of management’s accountability
The accompanying consolidated financial statements have been prepared by management in accordance with International Financial Reporting Standards as issued by
the International Accounting Standards Board. Management is responsible for ensuring that these statements, which include amounts based upon estimates and judgments, are consistent with other information and operating data contained in the annual
financial review and reflect the corporation’s business transactions and financial position.
Management is also responsible for the information
disclosed in the management’s discussion and analysis including responsibility for the existence of appropriate information systems, procedures and controls to ensure that the information used internally by management and disclosed externally
is complete and reliable in all material respects.
In addition, management is responsible for establishing and maintaining an adequate system of internal
control over financial reporting. The internal control system includes an internal audit function and a code of conduct and ethics, which is communicated to all levels in the organization and requires all employees to maintain high standards in
their conduct of the corporation’s affairs. Such systems are designed to provide reasonable assurance that the financial information is relevant, reliable and accurate and that the Company’s assets are appropriately accounted for and
adequately safeguarded. Management conducted an evaluation of the effectiveness of the system of internal control over financial reporting based on the criteria established in “Internal Control – Integrated Framework (2013)” issued by
the Committee of Sponsoring Organizations of the Treadway Commission. Based on this evaluation, management concluded that the Company’s system of internal control over financial reporting was effective as at December 31, 2015.
KPMG LLP has audited the consolidated financial statements in accordance with Canadian generally accepted auditing standards and the standards of the Public
Company Accounting Oversight Board (United States).
The board of directors annually appoints an audit and finance committee comprised of directors who
are not employees of the corporation. This committee meets regularly with management, the internal auditor and the shareholders’ auditors to review significant accounting, reporting and internal control matters. Both the internal and
shareholders’ auditors have unrestricted access to the audit and finance committee. The audit and finance committee reviews the consolidated financial statements, the report of the shareholders’ auditors, and management’s discussion
and analysis and submits its report to the board of directors for formal approval.
|
|
|
| Original signed by Tim S. Gitzel |
|
Original signed by Grant E. Isaac |
| President and Chief Executive Officer |
|
Senior Vice-President and Chief Financial Officer |
| February 4, 2016 |
|
February 4, 2016 |
2
Independent auditors’ report
To the Shareholders and Board of Directors of Cameco Corporation:
We have audited the accompanying consolidated financial statements of Cameco Corporation, which comprise the consolidated statements of financial position as
at December 31, 2015 and December 31, 2014, the consolidated statements of earnings, comprehensive income, changes in equity and cash flows for the years then ended, and notes, comprising a summary of significant accounting policies and
other explanatory information.
Management’s responsibility for the consolidated financial statements
Management is responsible for the preparation and fair presentation of these consolidated financial statements in accordance with International Financial
Reporting Standards as issued by the International Accounting Standards Board, and for such internal control as management determines is necessary to enable the preparation of consolidated financial statements that are free from material
misstatement, whether due to fraud or error.
Auditors’ responsibility
Our responsibility is to express an opinion on these consolidated financial statements based on our audits. We conducted our audits in accordance with Canadian
generally accepted auditing standards. Those standards require that we comply with ethical requirements and plan and perform the audit to obtain reasonable assurance about whether the consolidated financial statements are free from material
misstatement.
An audit involves performing procedures to obtain audit evidence about the amounts and disclosures in the consolidated financial
statements. The procedures selected depend on our judgment, including the assessment of the risks of material misstatement of the consolidated financial statements, whether due to fraud or error. In making those risk assessments, we consider
internal control relevant to the entity’s preparation and fair presentation of the consolidated financial statements in order to design audit procedures that are appropriate in the circumstances. An audit also includes evaluating the
appropriateness of accounting policies used and the reasonableness of accounting estimates made by management, as well as evaluating the overall presentation of the consolidated financial statements.
We believe that the audit evidence we have obtained in our audits is sufficient and appropriate to provide a basis for our audit opinion.
Opinion
In our opinion, the consolidated financial
statements present fairly, in all material respects, the consolidated financial position of Cameco Corporation as at December 31, 2015 and December 31, 2014 and its consolidated financial performance and its consolidated cash flows for the
years then ended in accordance with International Financial Reporting Standards as issued by the International Accounting Standards Board.
Original
signed by KPMG LLP
Chartered Professional Accountants
February 4, 2016
Saskatoon, Canada
3
Consolidated statements of earnings
|
|
|
|
|
|
|
|
|
|
|
| For the years ended December 31 |
|
Note |
|
2015 |
|
|
2014 |
|
| ($Cdn thousands, except per share amounts) |
|
|
|
| Revenue from products and services |
|
|
|
$ |
2,754,378 |
|
|
$ |
2,397,532 |
|
|
|
|
|
| Cost of products and services sold |
|
|
|
|
1,744,815 |
|
|
|
1,420,768 |
|
| Depreciation and amortization |
|
|
|
|
312,518 |
|
|
|
338,983 |
|
|
|
|
|
|
|
|
|
|
|
|
| Cost of sales |
|
|
|
|
2,057,333 |
|
|
|
1,759,751 |
|
|
|
|
|
|
|
|
|
|
|
|
| Gross profit |
|
|
|
|
697,045 |
|
|
|
637,781 |
|
| Administration |
|
|
|
|
186,810 |
|
|
|
176,385 |
|
| Impairment charges |
|
9, 12 |
|
|
215,488 |
|
|
|
326,693 |
|
| Exploration |
|
|
|
|
40,259 |
|
|
|
46,565 |
|
| Research and development |
|
|
|
|
6,587 |
|
|
|
5,044 |
|
| Loss on disposal of assets |
|
9 |
|
|
2,326 |
|
|
|
44,762 |
|
|
|
|
|
|
|
|
|
|
|
|
| Earnings from operations |
|
|
|
|
245,575 |
|
|
|
38,332 |
|
| Finance costs |
|
20 |
|
|
(103,615 |
) |
|
|
(111,853 |
) |
| Loss on derivatives |
|
27 |
|
|
(280,610 |
) |
|
|
(121,160 |
) |
| Finance income |
|
|
|
|
5,417 |
|
|
|
7,402 |
|
| Share of loss from equity-accounted investees |
|
12 |
|
|
(758 |
) |
|
|
(17,141 |
) |
| Other income |
|
21 |
|
|
54,723 |
|
|
|
85,322 |
|
|
|
|
|
|
|
|
|
|
|
|
| Loss before income taxes |
|
|
|
|
(79,268 |
) |
|
|
(119,098 |
) |
| Income tax recovery |
|
22 |
|
|
(142,630 |
) |
|
|
(175,268 |
) |
|
|
|
|
|
|
|
|
|
|
|
| Net earnings from continuing operations |
|
|
|
|
63,362 |
|
|
|
56,170 |
|
| Net earnings from discontinued operation |
|
6 |
|
|
— |
|
|
|
127,243 |
|
|
|
|
|
|
|
|
|
|
|
|
| Net earnings |
|
|
|
$ |
63,362 |
|
|
$ |
183,413 |
|
|
|
|
|
|
|
|
|
|
|
|
| Equity holders |
|
|
|
|
65,286 |
|
|
|
185,234 |
|
| Non-controlling interest |
|
|
|
|
(1,924 |
) |
|
|
(1,821 |
) |
|
|
|
|
|
|
|
|
|
|
|
| Net earnings |
|
|
|
$ |
63,362 |
|
|
$ |
183,413 |
|
|
|
|
|
|
|
|
|
|
|
|
| Continuing operations |
|
|
|
|
0.16 |
|
|
|
0.15 |
|
| Discontinued operation |
|
|
|
|
— |
|
|
|
0.32 |
|
|
|
|
|
|
|
|
|
|
|
|
| Total basic earnings per share |
|
23 |
|
$ |
0.16 |
|
|
$ |
0.47 |
|
|
|
|
|
|
|
|
|
|
|
|
| Continuing operations |
|
|
|
|
0.16 |
|
|
|
0.15 |
|
| Discontinued operation |
|
|
|
|
— |
|
|
|
0.32 |
|
|
|
|
|
|
|
|
|
|
|
|
| Total diluted earnings per share |
|
23 |
|
$ |
0.16 |
|
|
$ |
0.47 |
|
|
|
|
|
|
|
|
|
|
|
|
See accompanying notes to consolidated financial statements.
4
Consolidated statements of comprehensive income
|
|
|
|
|
|
|
|
|
|
|
| For the years ended December 31 |
|
Note |
|
2015 |
|
|
2014 |
|
| ($Cdn thousands) |
|
|
|
| Net earnings |
|
|
|
$ |
63,362 |
|
|
$ |
183,413 |
|
|
|
|
|
| Other comprehensive income (loss), net of taxes: |
|
22 |
|
|
|
|
|
|
|
|
| Items that will not be reclassified to net earnings: |
|
|
|
|
|
|
|
|
|
|
| Remeasurements of defined benefit liability |
|
|
|
|
2,015 |
|
|
|
(7,952 |
) |
| Items that are or may be reclassified to net earnings: |
|
|
|
|
|
|
|
|
|
|
| Exchange differences on translation of foreign operations |
|
|
|
|
182,089 |
|
|
|
58,890 |
|
| Gains on derivatives designated as cash flow hedges transferred to net earnings - discontinued operation |
|
|
|
|
— |
|
|
|
(300 |
) |
| Unrealized gains on available-for-sale assets |
|
|
|
|
22 |
|
|
|
(613 |
) |
| Losses on available-for-sale assets transferred to earnings |
|
|
|
|
— |
|
|
|
2 |
|
|
|
|
|
|
|
|
|
|
|
|
| Other comprehensive income, net of taxes |
|
|
|
|
184,126 |
|
|
|
50,027 |
|
|
|
|
|
|
|
|
|
|
|
|
| Total comprehensive income |
|
|
|
$ |
247,488 |
|
|
$ |
233,440 |
|
|
|
|
|
|
|
|
|
|
|
|
| Comprehensive income from continuing operations |
|
|
|
|
247,488 |
|
|
|
106,497 |
|
| Comprehensive income from discontinued operation |
|
6 |
|
|
— |
|
|
|
126,943 |
|
|
|
|
|
|
|
|
|
|
|
|
| Total comprehensive income |
|
|
|
$ |
247,488 |
|
|
$ |
233,440 |
|
|
|
|
|
|
|
|
|
|
|
|
| Other comprehensive income (loss) attributable to: |
|
|
|
|
|
|
|
|
|
|
|
|
|
|
| Equity holders |
|
|
|
$ |
184,288 |
|
|
$ |
49,969 |
|
| Non-controlling interest |
|
|
|
|
(162 |
) |
|
|
58 |
|
|
|
|
|
|
|
|
|
|
|
|
| Other comprehensive income for the year |
|
|
|
$ |
184,126 |
|
|
$ |
50,027 |
|
|
|
|
|
|
|
|
|
|
|
|
| Total comprehensive income (loss) attributable to: |
|
|
|
|
|
|
|
|
|
|
|
|
|
|
| Equity holders |
|
|
|
$ |
249,574 |
|
|
$ |
235,203 |
|
| Non-controlling interest |
|
|
|
|
(2,086 |
) |
|
|
(1,763 |
) |
|
|
|
|
|
|
|
|
|
|
|
| Total comprehensive income for the year |
|
|
|
$ |
247,488 |
|
|
$ |
233,440 |
|
|
|
|
|
|
|
|
|
|
|
|
See accompanying notes to consolidated financial statements.
5
Consolidated statements of financial position
|
|
|
|
|
|
|
|
|
|
|
| As at December 31 |
|
Note |
|
2015 |
|
|
2014 |
|
| ($Cdn thousands) |
|
|
|
| Assets |
|
|
|
|
|
|
|
|
|
|
| Current assets |
|
|
|
|
|
|
|
|
|
|
| Cash and cash equivalents |
|
|
|
$ |
458,604 |
|
|
$ |
566,583 |
|
| Accounts receivable |
|
7 |
|
|
246,865 |
|
|
|
455,002 |
|
| Current tax assets |
|
|
|
|
493 |
|
|
|
3,096 |
|
| Inventories |
|
8 |
|
|
1,285,266 |
|
|
|
902,278 |
|
| Supplies and prepaid expenses |
|
|
|
|
180,544 |
|
|
|
130,406 |
|
| Current portion of long-term receivables, investments and other |
|
11 |
|
|
12,193 |
|
|
|
10,341 |
|
|
|
|
|
|
|
|
|
|
|
|
| Total current assets |
|
|
|
|
2,183,965 |
|
|
|
2,067,706 |
|
|
|
|
|
|
|
|
|
|
|
|
| Property, plant and equipment |
|
9 |
|
|
5,228,160 |
|
|
|
5,291,021 |
|
| Goodwill and intangible assets |
|
10 |
|
|
217,130 |
|
|
|
201,102 |
|
| Long-term receivables, investments and other |
|
11 |
|
|
449,236 |
|
|
|
423,280 |
|
| Investments in equity-accounted investees |
|
12 |
|
|
2,472 |
|
|
|
3,230 |
|
| Deferred tax assets |
|
22 |
|
|
713,674 |
|
|
|
486,328 |
|
|
|
|
|
|
|
|
|
|
|
|
| Total non-current assets |
|
|
|
|
6,610,672 |
|
|
|
6,404,961 |
|
|
|
|
|
|
|
|
|
|
|
|
| Total assets |
|
|
|
$ |
8,794,637 |
|
|
$ |
8,472,667 |
|
|
|
|
|
|
|
|
|
|
|
|
| Liabilities and shareholders’ equity |
|
|
|
|
|
|
|
|
|
|
| Current liabilities |
|
|
|
|
|
|
|
|
|
|
| Accounts payable and accrued liabilities |
|
13 |
|
$ |
317,856 |
|
|
$ |
316,258 |
|
| Current tax liabilities |
|
|
|
|
56,494 |
|
|
|
51,719 |
|
| Dividends payable |
|
|
|
|
39,579 |
|
|
|
39,579 |
|
| Current portion of other liabilities |
|
16 |
|
|
241,113 |
|
|
|
87,883 |
|
| Current portion of provisions |
|
17 |
|
|
16,595 |
|
|
|
20,375 |
|
|
|
|
|
|
|
|
|
|
|
|
| Total current liabilities |
|
|
|
|
671,637 |
|
|
|
515,814 |
|
|
|
|
|
|
|
|
|
|
|
|
| Long-term debt |
|
15 |
|
|
1,492,237 |
|
|
|
1,491,198 |
|
| Other liabilities |
|
16 |
|
|
132,142 |
|
|
|
172,034 |
|
| Provisions |
|
17 |
|
|
918,163 |
|
|
|
825,935 |
|
| Deferred tax liabilities |
|
22 |
|
|
35,179 |
|
|
|
23,882 |
|
|
|
|
|
|
|
|
|
|
|
|
| Total non-current liabilities |
|
|
|
|
2,577,721 |
|
|
|
2,513,049 |
|
|
|
|
|
|
|
|
|
|
|
|
| Shareholders’ equity |
|
|
|
|
|
|
|
|
|
|
| Share capital |
|
|
|
|
1,862,646 |
|
|
|
1,862,646 |
|
| Contributed surplus |
|
|
|
|
209,115 |
|
|
|
196,815 |
|
| Retained earnings |
|
|
|
|
3,241,902 |
|
|
|
3,333,099 |
|
| Other components of equity |
|
|
|
|
233,357 |
|
|
|
51,084 |
|
|
|
|
|
|
|
|
|
|
|
|
| Total shareholders’ equity attributable to equity holders |
|
|
|
|
5,547,020 |
|
|
|
5,443,644 |
|
|
|
|
|
| Non-controlling interest |
|
|
|
|
(1,741 |
) |
|
|
160 |
|
|
|
|
|
|
|
|
|
|
|
|
| Total shareholders’ equity |
|
|
|
|
5,545,279 |
|
|
|
5,443,804 |
|
|
|
|
|
|
|
|
|
|
|
|
| Total liabilities and shareholders’ equity |
|
|
|
$ |
8,794,637 |
|
|
$ |
8,472,667 |
|
|
|
|
|
|
|
|
|
|
|
|
Commitments and contingencies [notes 9, 17, 22]
See accompanying notes to consolidated financial statements.
6
Consolidated statements of changes in equity
|
|
|
|
|
|
|
|
|
|
|
|
|
|
|
|
|
|
|
|
|
|
|
|
|
|
|
|
|
|
|
|
|
|
|
|
|
| |
|
Attributable to equity holders |
|
|
|
|
|
|
|
| ($Cdn thousands) |
|
Share
capital |
|
|
Contributed
surplus |
|
|
Retained
earnings |
|
|
Foreign
currency
translation |
|
|
Cash flow
hedges |
|
|
Available-
for-sale
assets |
|
|
Total |
|
|
Non-
controlling
interest |
|
|
Total
equity |
|
| Balance at January 1, 2015 |
|
$ |
1,862,646 |
|
|
$ |
196,815 |
|
|
$ |
3,333,099 |
|
|
$ |
51,667 |
|
|
$ |
— |
|
|
$ |
(583 |
) |
|
$ |
5,443,644 |
|
|
$ |
160 |
|
|
$ |
5,443,804 |
|
|
|
|
|
|
|
|
|
|
|
| Net earnings (loss) |
|
|
— |
|
|
|
— |
|
|
|
65,286 |
|
|
|
— |
|
|
|
— |
|
|
|
— |
|
|
|
65,286 |
|
|
|
(1,924 |
) |
|
|
63,362 |
|
| Other comprehensive income (loss) |
|
|
— |
|
|
|
— |
|
|
|
2,015 |
|
|
|
182,251 |
|
|
|
— |
|
|
|
22 |
|
|
|
184,288 |
|
|
|
(162 |
) |
|
|
184,126 |
|
|
|
|
|
|
|
|
|
|
|
|
|
|
|
|
|
|
|
|
|
|
|
|
|
|
|
|
|
|
|
|
|
|
|
|
|
|
| Total comprehensive income (loss) |
|
|
— |
|
|
|
— |
|
|
|
67,301 |
|
|
|
182,251 |
|
|
|
— |
|
|
|
22 |
|
|
|
249,574 |
|
|
|
(2,086 |
) |
|
|
247,488 |
|
|
|
|
|
|
|
|
|
|
|
|
|
|
|
|
|
|
|
|
|
|
|
|
|
|
|
|
|
|
|
|
|
|
|
|
|
|
| Share-based compensation |
|
|
— |
|
|
|
16,853 |
|
|
|
— |
|
|
|
— |
|
|
|
— |
|
|
|
— |
|
|
|
16,853 |
|
|
|
— |
|
|
|
16,853 |
|
| Share options exercised |
|
|
— |
|
|
|
(4,553 |
) |
|
|
— |
|
|
|
— |
|
|
|
— |
|
|
|
— |
|
|
|
(4,553 |
) |
|
|
— |
|
|
|
(4,553 |
) |
| Change in ownership interest in subsidiary |
|
|
— |
|
|
|
— |
|
|
|
(185 |
) |
|
|
— |
|
|
|
— |
|
|
|
— |
|
|
|
(185 |
) |
|
|
185 |
|
|
|
— |
|
| Dividends |
|
|
— |
|
|
|
— |
|
|
|
(158,313 |
) |
|
|
— |
|
|
|
— |
|
|
|
— |
|
|
|
(158,313 |
) |
|
|
— |
|
|
|
(158,313 |
) |
|
|
|
|
|
|
|
|
|
|
|
|
|
|
|
|
|
|
|
|
|
|
|
|
|
|
|
|
|
|
|
|
|
|
|
|
|
| Balance at December 31, 2015 |
|
$ |
1,862,646 |
|
|
$ |
209,115 |
|
|
$ |
3,241,902 |
|
|
$ |
233,918 |
|
|
$ |
— |
|
|
$ |
(561 |
) |
|
$ |
5,547,020 |
|
|
$ |
(1,741 |
) |
|
$ |
5,545,279 |
|
|
|
|
|
|
|
|
|
|
|
|
|
|
|
|
|
|
|
|
|
|
|
|
|
|
|
|
|
|
|
|
|
|
|
|
|
|
| Balance at January 1, 2014 |
|
$ |
1,854,671 |
|
|
$ |
186,382 |
|
|
$ |
3,314,049 |
|
|
$ |
(7,165 |
) |
|
$ |
300 |
|
|
$ |
28 |
|
|
$ |
5,348,265 |
|
|
$ |
1,129 |
|
|
$ |
5,349,394 |
|
|
|
|
|
|
|
|
|
|
|
| Net earnings (loss) |
|
|
— |
|
|
|
— |
|
|
|
185,234 |
|
|
|
— |
|
|
|
— |
|
|
|
— |
|
|
|
185,234 |
|
|
|
(1,821 |
) |
|
|
183,413 |
|
| Other comprehensive income (loss) |
|
|
— |
|
|
|
— |
|
|
|
(7,952 |
) |
|
|
58,832 |
|
|
|
(300 |
) |
|
|
(611 |
) |
|
|
49,969 |
|
|
|
58 |
|
|
|
50,027 |
|
|
|
|
|
|
|
|
|
|
|
|
|
|
|
|
|
|
|
|
|
|
|
|
|
|
|
|
|
|
|
|
|
|
|
|
|
|
| Total comprehensive income (loss) |
|
|
— |
|
|
|
— |
|
|
|
177,282 |
|
|
|
58,832 |
|
|
|
(300 |
) |
|
|
(611 |
) |
|
|
235,203 |
|
|
|
(1,763 |
) |
|
|
233,440 |
|
|
|
|
|
|
|
|
|
|
|
|
|
|
|
|
|
|
|
|
|
|
|
|
|
|
|
|
|
|
|
|
|
|
|
|
|
|
| Share-based compensation |
|
|
— |
|
|
|
15,808 |
|
|
|
— |
|
|
|
— |
|
|
|
— |
|
|
|
— |
|
|
|
15,808 |
|
|
|
— |
|
|
|
15,808 |
|
| Share options exercised |
|
|
7,975 |
|
|
|
(5,375 |
) |
|
|
— |
|
|
|
— |
|
|
|
— |
|
|
|
— |
|
|
|
2,600 |
|
|
|
— |
|
|
|
2,600 |
|
| Dividends |
|
|
— |
|
|
|
— |
|
|
|
(158,232 |
) |
|
|
— |
|
|
|
— |
|
|
|
— |
|
|
|
(158,232 |
) |
|
|
— |
|
|
|
(158,232 |
) |
| Transactions with owners - contributed equity |
|
|
— |
|
|
|
— |
|
|
|
— |
|
|
|
— |
|
|
|
— |
|
|
|
— |
|
|
|
— |
|
|
|
794 |
|
|
|
794 |
|
|
|
|
|
|
|
|
|
|
|
|
|
|
|
|
|
|
|
|
|
|
|
|
|
|
|
|
|
|
|
|
|
|
|
|
|
|
| Balance at December 31, 2014 |
|
$ |
1,862,646 |
|
|
$ |
196,815 |
|
|
$ |
3,333,099 |
|
|
$ |
51,667 |
|
|
$ |
— |
|
|
$ |
(583 |
) |
|
$ |
5,443,644 |
|
|
$ |
160 |
|
|
$ |
5,443,804 |
|
|
|
|
|
|
|
|
|
|
|
|
|
|
|
|
|
|
|
|
|
|
|
|
|
|
|
|
|
|
|
|
|
|
|
|
|
|
See accompanying notes to consolidated financial statements.
7
Consolidated statements of cash flows
|
|
|
|
|
|
|
|
|
|
|
| For the years ended December 31
($Cdn thousands) |
|
Note |
|
2015 |
|
|
2014 |
|
| Operating activities |
|
|
|
|
|
|
|
|
|
|
| Net earnings |
|
|
|
$ |
63,362 |
|
|
$ |
183,413 |
|
| Adjustments for: |
|
|
|
|
|
|
|
|
|
|
| Depreciation and amortization |
|
|
|
|
312,518 |
|
|
|
338,983 |
|
| Deferred charges |
|
|
|
|
5,834 |
|
|
|
61,869 |
|
| Unrealized loss on derivatives |
|
|
|
|
92,166 |
|
|
|
40,569 |
|
| Share-based compensation |
|
25 |
|
|
16,853 |
|
|
|
15,808 |
|
| Loss on sale of assets |
|
|
|
|
2,326 |
|
|
|
44,762 |
|
| Finance costs |
|
20 |
|
|
103,615 |
|
|
|
111,853 |
|
| Finance income |
|
|
|
|
(5,417 |
) |
|
|
(7,402 |
) |
| Share of loss in equity-accounted investees |
|
|
|
|
758 |
|
|
|
17,141 |
|
| Impairment charge |
|
9, 12 |
|
|
215,488 |
|
|
|
326,693 |
|
| Other income |
|
21 |
|
|
(54,409 |
) |
|
|
(35,353 |
) |
| Discontinued operation |
|
6 |
|
|
— |
|
|
|
(127,243 |
) |
| Income tax recovery |
|
22 |
|
|
(142,630 |
) |
|
|
(175,268 |
) |
| Interest received |
|
|
|
|
3,922 |
|
|
|
5,935 |
|
| Income taxes paid |
|
|
|
|
(92,758 |
) |
|
|
(233,716 |
) |
| Other operating items |
|
24 |
|
|
(71,618 |
) |
|
|
(87,862 |
) |
|
|
|
|
|
|
|
|
|
|
|
| Net cash provided by operations |
|
|
|
|
450,010 |
|
|
|
480,182 |
|
|
|
|
|
|
|
|
|
|
|
|
| Investing activities |
|
|
|
|
|
|
|
|
|
|
| Additions to property, plant and equipment |
|
|
|
|
(358,562 |
) |
|
|
(480,108 |
) |
| Increase in long-term receivables, investments and other |
|
|
|
|
17,557 |
|
|
|
11,569 |
|
| Proceeds from sale of property, plant and equipment |
|
|
|
|
198 |
|
|
|
701 |
|
|
|
|
|
|
|
|
|
|
|
|
| Net cash used in investing (continuing operations) |
|
|
|
|
(340,807 |
) |
|
|
(467,838 |
) |
| Net cash provided by investing (discontinued operation) |
|
6 |
|
|
— |
|
|
|
447,096 |
|
|
|
|
|
|
|
|
|
|
|
|
| Net cash used in investing |
|
|
|
|
(340,807 |
) |
|
|
(20,742 |
) |
|
|
|
|
|
|
|
|
|
|
|
| Financing activities |
|
|
|
|
|
|
|
|
|
|
| Increase in debt |
|
|
|
|
— |
|
|
|
496,476 |
|
| Decrease in debt |
|
|
|
|
(10 |
) |
|
|
(351,046 |
) |
| Interest paid |
|
|
|
|
(69,507 |
) |
|
|
(78,144 |
) |
| Proceeds from issuance of shares, stock option plan |
|
|
|
|
— |
|
|
|
6,228 |
|
| Contributions from non-controlling interest |
|
|
|
|
— |
|
|
|
794 |
|
| Dividends paid |
|
|
|
|
(158,313 |
) |
|
|
(158,200 |
) |
|
|
|
|
|
|
|
|
|
|
|
| Net cash used in financing |
|
|
|
|
(227,830 |
) |
|
|
(83,892 |
) |
|
|
|
|
|
|
|
|
|
|
|
| Increase (decrease) in cash and cash equivalents, during the year |
|
|
|
|
(118,627 |
) |
|
|
375,548 |
|
| Exchange rate changes on foreign currency cash balances |
|
|
|
|
10,648 |
|
|
|
3,126 |
|
| Cash and cash equivalents, beginning of year |
|
|
|
|
566,583 |
|
|
|
187,909 |
|
|
|
|
|
|
|
|
|
|
|
|
| Cash and cash equivalents, end of year |
|
|
|
$ |
458,604 |
|
|
$ |
566,583 |
|
|
|
|
|
|
|
|
|
|
|
|
| Cash and cash equivalents is comprised of: |
|
|
|
|
|
|
|
|
|
|
| Cash |
|
|
|
$ |
240,603 |
|
|
$ |
86,664 |
|
| Cash equivalents |
|
|
|
|
218,001 |
|
|
|
479,919 |
|
|
|
|
|
|
|
|
|
|
|
|
| Cash and cash equivalents |
|
|
|
$ |
458,604 |
|
|
$ |
566,583 |
|
|
|
|
|
|
|
|
|
|
|
|
See accompanying notes to consolidated financial statements.
8
Notes to consolidated financial statements
For the years ended December 31, 2015 and 2014
Cameco Corporation is incorporated under the Canada Business Corporations Act. The
address of its registered office is 2121 11th Street West, Saskatoon, Saskatchewan, S7M 1J3. The consolidated financial statements as at and for the year ended December 31, 2015 comprise Cameco Corporation and its subsidiaries (collectively,
the Company or Cameco) and the Company’s interests in associates and joint arrangements. The Company is primarily engaged in the exploration for and the development, mining, refining, conversion, fabrication and trading of uranium for sale as
fuel for generating electricity in nuclear power reactors in Canada and other countries.
| 2. |
Significant accounting policies |
| A. |
Statement of compliance |
These consolidated financial statements have been prepared in accordance with
International Financial Reporting Standards (IFRS) as issued by the International Accounting Standards Board (IASB).
These consolidated financial
statements were authorized for issuance by the Company’s board of directors on February 4, 2016.
These consolidated financial statements are presented in Canadian dollars, which
is the Company’s functional currency. All financial information is presented in Canadian dollars, unless otherwise noted. Amounts presented in tabular format have been rounded to the nearest thousand except per share amounts and where otherwise
noted.
The consolidated financial statements have been prepared on the historical cost basis except for the following material items which are measured
on an alternative basis at each reporting date:
|
|
|
|
|
| Derivative financial instruments |
|
|
|
Fair value |
| Non-derivative financial instruments at fair value through profit and loss |
|
|
|
Fair value |
| Available-for-sale financial assets |
|
|
|
Fair value |
| Liabilities for cash-settled share-based payment arrangements |
|
|
|
Fair value |
| Net defined benefit liability |
|
|
|
Fair value of plan assets less the present value of the defined benefit obligation |
The preparation of the consolidated financial statements in conformity with IFRS requires management to make judgments,
estimates and assumptions that affect the application of accounting policies and the reported amounts of assets, liabilities, revenue and expenses. Actual results may vary from these estimates.
Estimates and underlying assumptions are reviewed on an ongoing basis. Revisions to accounting estimates are recognized in the period in which the estimates
are revised and in any future periods affected. The areas involving a higher degree of judgment or complexity, or areas where assumptions and estimates are significant to the consolidated financial statements are disclosed in note 5.
This summary of significant accounting policies is a description of the accounting methods and practices that have been used in the preparation of these
consolidated financial statements and is presented to assist the reader in interpreting the statements contained herein. These accounting policies have been applied consistently to all entities within the consolidated group.
9
| C. |
Consolidation principles |
The acquisition method of accounting is used to account for the acquisition of
subsidiaries by the Company. The Company measures goodwill at the acquisition date as the fair value of the consideration transferred, including the recognized amount of any non-controlling interests in the acquiree, less the net recognized amount
(generally fair value) of the identifiable assets acquired and liabilities assumed, all measured as of the acquisition date. When the excess is negative, a bargain purchase gain is recognized immediately in earnings. In a business combination
achieved in stages, the acquisition date fair value of the Company’s previously held equity interest in the acquiree is also considered in computing goodwill.
Consideration transferred includes the fair values of the assets transferred, liabilities incurred and equity interests issued by the Company. Consideration
also includes the fair value of any contingent consideration and share-based compensation awards that are replaced mandatorily in a business combination.
The Company elects on a transaction-by-transaction basis whether to measure any non-controlling interest at fair value, or at their proportionate share of the
recognized amount of the identifiable net assets of the acquiree, at the acquisition date.
Acquisition-related costs are expensed as incurred, except for
those costs related to the issue of debt or equity instruments.
The consolidated financial statements include the accounts of Cameco and its subsidiaries.
Subsidiaries are entities over which the Company has control. Subsidiaries are fully consolidated from the date on which control is transferred to the Company and are deconsolidated from the date that control ceases.
| iii. |
Investments in equity-accounted investees |
Cameco’s investments in equity-accounted investees
include investments in associates and joint ventures.
Associates are those entities over which the Company has significant influence, but not control or
joint control, over the financial and operating policies. Significant influence is presumed to exist when the Company holds between 20% and 50% of the voting power of another entity, but can also arise where the Company holds less than 20% if it has
the power to be actively involved and influential in policy decisions affecting the entity.
Investments in associates are accounted for using the equity
method. The equity method involves the recording of the initial investment at cost and the subsequent adjusting of the carrying value of the investment for Cameco’s proportionate share of the earnings or loss and any other changes in the
associates’ net assets, such as dividends. The cost of the investment includes transaction costs.
Adjustments are made to align the accounting
policies of the associate with those of the Company before applying the equity method. When the Company’s share of losses exceeds its interest in an equity-accounted investee, the carrying amount of that interest is reduced to zero, and the
recognition of further losses is discontinued except to the extent that the Company has incurred legal or constructive obligations or made payments on behalf of the associate. If the associate subsequently reports profits, Cameco resumes recognizing
its share of those profits only after its share of the profits equals the share of losses not recognized.
A joint arrangement can take the form of a joint operation or joint venture. All
joint arrangements involve a contractual arrangement that establishes joint control.
10
A joint operation is a joint arrangement whereby the parties that have joint control of the arrangement have
rights to the assets, and obligations for the liabilities, relating to the arrangement. A joint operation may or may not be structured through a separate vehicle. These arrangements involve joint control of one or more of the assets acquired or
contributed for the purpose of the joint operation. The consolidated financial statements of the Company include its share of the assets in such joint operations, together with its share of the liabilities, revenues and expenses arising jointly or
otherwise from those operations. All such amounts are measured in accordance with the terms of each arrangement.
A joint venture is a joint arrangement
whereby the parties that have joint control of the arrangement have rights to the net assets of the arrangement. A joint venture is always structured through a separate vehicle. It operates in the same way as other entities, controlling the assets
of the joint venture, earning its own revenue and incurring its own liabilities and expenses. Interests in joint ventures are accounted for using the equity method of accounting, whereby the Company’s proportionate interest in the assets,
liabilities, revenues and expenses of jointly controlled entities are recognized on a single line in the consolidated statements of financial position and consolidated statements of earnings. The share of joint ventures results is recognized in the
Company’s consolidated financial statements from the date that joint control commences until the date at which it ceases.
| v. |
Transactions eliminated on consolidation |
Intra-group balances and transactions, and any unrealized
income and expenses arising from intra-group transactions, are eliminated in preparing the consolidated financial statements. Unrealized gains arising from transactions with equity-accounted investees are eliminated against the investment to the
extent of the Company’s interest in the investee. Unrealized losses are eliminated in the same manner as unrealized gains, but only to the extent that there is no evidence of impairment.
| D. |
Foreign currency translation |
Items included in the financial statements of each of Cameco’s
subsidiaries, associates and joint arrangements are measured using their functional currency, which is the currency of the primary economic environment in which the entity operates. The consolidated financial statements are presented in Canadian
dollars, which is Cameco’s functional and presentation currency.
| i. |
Foreign currency transactions |
Foreign currency transactions are translated into the respective
functional currency of the Company and its entities using the exchange rates prevailing at the dates of the transactions. At the reporting date, monetary assets and liabilities denominated in foreign currencies are translated to the functional
currency at the exchange rate at that date. Non-monetary items that are measured in terms of historical cost in a foreign currency are translated using the exchange rate at the date of the transaction. The applicable exchange gains and losses
arising on these transactions are reflected in earnings with the exception of foreign exchange gains or losses on provisions for decommissioning and reclamation activities that are in a foreign currency, which are capitalized in property, plant and
equipment.
The assets and liabilities of foreign operations, including goodwill and fair value
adjustments arising on acquisition, are translated to Canadian dollars at exchange rates at the reporting dates. The revenues and expenses of foreign operations are translated to Canadian dollars at exchange rates at the dates of the transactions.
Foreign currency differences are recognized in other comprehensive income. When a foreign operation is disposed of, in whole, the relevant amount in the
foreign currency translation account is transferred to earnings as part of the gain or loss on disposal.
When the settlement of a monetary item
receivable from or payable to a foreign operation is neither planned nor likely in the foreseeable future, foreign exchange gains and losses arising from such a monetary item are considered to form part of the net investment in a foreign operation,
and are recognized in other comprehensive income and presented within equity in the foreign currency translation account.
11
| E. |
Cash and cash equivalents |
Cash and cash equivalents consists of balances with financial institutions
and investments in money market instruments, which have a term to maturity of three months or less at the time of purchase.
| F. |
Short-term investments |
Short-term investments are comprised of money market instruments with terms to
maturity between three and 12 months.
Inventories of broken ore, uranium concentrates, and refined and converted products are
measured at the lower of cost and net realizable value.
Cost includes direct materials, direct labour, operational overhead expenses and depreciation.
Net realizable value is the estimated selling price in the ordinary course of business, less the estimated costs of completion and selling expenses.
Consumable supplies and spares are valued at the lower of cost or replacement value.
| H. |
Property, plant and equipment |
| i. |
Buildings, plant and equipment and other |
Items of property, plant and equipment are measured at cost
less accumulated depreciation and impairment charges. The cost of self-constructed assets includes the cost of materials and direct labour, borrowing costs and any other costs directly attributable to bringing the assets to the location and
condition necessary for them to be capable of operating in the manner intended by management, including the initial estimate of the cost of dismantling and removing the items and restoring the site on which they are located.
When components of an item of property, plant and equipment have different useful lives, they are accounted for as separate items of property, plant and
equipment and depreciated separately.
Gains and losses on disposal of an item of property, plant and equipment are determined by comparing the proceeds
from disposal with the carrying amount of property, plant and equipment, and are recognized in earnings.
| ii. |
Mineral properties and mine development costs |
The decision to develop a mine property within a project
area is based on an assessment of the commercial viability of the property, the availability of financing and the existence of markets for the product. Once the decision to proceed to development is made, development and other expenditures relating
to the project area are deferred as part of assets under construction and disclosed as a component of property, plant and equipment with the intention that these will be depreciated by charges against earnings from future mining operations. No
depreciation is charged against the property until the production stage commences. After a mine property has been brought into the production stage, costs of any additional work on that property are expensed as incurred, except for large development
programs, which will be deferred and depreciated over the remaining life of the related assets.
The production stage is reached when a mine property is
in the condition necessary for it to be capable of operating in the manner intended by management. The criteria used to assess the start date of the production stage are determined based on the nature of each mine construction project, including the
complexity of a mine site. A range of factors is considered when determining whether the production stage has been reached, which includes, but is not limited to, the demonstration of sustainable production at or near the level intended (such as the
demonstration of continuous throughput levels at or above a target percentage of the design capacity).
12
Depreciation is calculated over the depreciable amount, which is the cost of the asset
less its residual value. Assets which are unrelated to production are depreciated according to the straight-line method based on estimated useful lives as follows:
|
|
|
| Land |
|
Not depreciated |
| Buildings |
|
15 - 25 years |
| Plant and equipment |
|
3 - 15 years |
| Furniture and fixtures |
|
3 - 10 years |
| Other |
|
3 - 5 years |
Mining properties and certain mining and conversion assets for which the economic benefits from the asset are consumed in a
pattern which is linked to the production level are depreciated according to the unit-of-production method. For conversion assets, the amount of depreciation is measured by the portion of the facilities’ total estimated lifetime production that
is produced in that period. For mining assets and properties, the amount of depreciation or depletion is measured by the portion of the mines’ proven and probable mineral reserves recovered during the period.
Depreciation methods, useful lives and residual values are reviewed at each reporting period and are adjusted if appropriate.
Borrowing costs on funds directly attributable to finance the acquisition, production
or construction of a qualifying asset are capitalized until such time as substantially all the activities necessary to prepare the qualifying asset for its intended use are complete. A qualifying asset is one that takes a substantial period of time
to prepare for its intended use. Capitalization is discontinued when the asset enters the production stage or development ceases. Where the funds used to finance a project form part of general borrowings, interest is capitalized based on the
weighted average interest rate applicable to the general borrowings outstanding during the period of construction.
| v. |
Repairs and maintenance |
The cost of replacing a component of property, plant and equipment is
capitalized if it is probable that future economic benefits embodied within the component will flow to the Company. The carrying amount of the replaced component is derecognized. Costs of routine maintenance and repair are charged to products and
services sold.
| I. |
Goodwill and intangible assets |
Goodwill arising from the acquisition of subsidiaries is initially
recognized at cost, measured as the excess of the fair value of the consideration paid over the fair value of the identifiable net assets acquired. At the date of acquisition, goodwill is allocated to the cash generating unit (CGU), or group of CGUs
that is expected to receive the economic benefits of the business combination. Goodwill is subsequently measured at cost, less accumulated impairment losses.
Intangible assets acquired individually or as part of a group of assets are initially recognized at cost and measured subsequently at cost less accumulated
amortization and impairment losses. Subsequent expenditure is capitalized only when it increases the future economic benefits embodied in the specific asset to which it relates. The cost of a group of intangible assets acquired in a transaction,
including those acquired in a business combination that meet the specified criteria for recognition apart from goodwill, is allocated to the individual assets acquired based on their relative fair values.
Intangible assets that have finite useful lives are amortized over their estimated remaining useful lives. Amortization methods and useful lives are reviewed
at each reporting period and are adjusted if appropriate.
Leases which result in the Company receiving substantially all the risks and rewards of
ownership are classified as finance leases. Upon initial recognition, the leased asset is measured at an amount equal to the lower of its fair value and the present value of the minimum lease payments. Subsequent to initial recognition, the asset is
accounted for in accordance with the accounting policy applicable to that asset. Minimum lease payments made under finance leases are apportioned between finance cost and the reduction of the outstanding liability. The finance cost is allocated to
each period of the lease term to produce a constant periodic rate of interest on the remaining balance of the liability.
13
Lease agreements that do not meet the recognition criteria of a finance lease are classified and recognized as
operating leases and are not recognized in the Company’s consolidated statements of financial position. Payments made under operating leases are charged to income on a straight-line basis over the lease term.
| K. |
Finance income and finance costs |
Finance income comprises interest income on funds invested, gains on
the disposal of available-for-sale financial assets, and changes in the fair value of non-derivative financial instruments. Interest income and interest expense are recognized in earnings as they accrue, using the effective interest method. Finance
costs comprise interest and fees on borrowings, unwinding of the discount on provisions, changes in the fair value of non-derivative financial instruments and costs incurred on redemption of debentures.
Borrowing costs that are not directly attributable to the acquisition, construction or production of a qualifying asset are expensed in the period incurred.
| L. |
Research and development costs |
Expenditures on research are charged against earnings when incurred.
Development costs are recognized as assets when the Company can demonstrate technical feasibility and that the asset will generate probable future economic benefits.
| i. |
Non-derivative financial assets |
Financial assets not classified as fair value through profit and loss
are assessed at each reporting date to determine whether there is objective evidence of impairment. Objective evidence that financial assets (including equity securities) are impaired can include default or delinquency by a debtor, restructuring of
an amount due to the Company on terms that the Company would not consider otherwise, indications that a debtor or issuer will enter bankruptcy, or the disappearance of an active market for a security. In addition, for an investment in an equity
security, a significant or prolonged decline in its fair value below its cost is objective evidence of impairment.
Impairment losses on
available-for-sale financial assets are recognized by transferring the cumulative loss that has been recognized in other comprehensive income, and presented in equity, to earnings. The cumulative loss that is removed from other comprehensive income
and recognized in earnings is the difference between the acquisition cost, net of any principal payment and amortization, and the current fair value, less any impairment loss previously recognized in earnings.
If, in a subsequent period, the fair value of an impaired available-for-sale debt security increases and the increase can be related objectively to an event
occurring after the impairment loss was recognized in earnings, then the impairment loss is reversed through earnings, otherwise, it is reversed through other comprehensive income. Impairment losses on available-for-sale equity securities that are
recognized in earnings are never reversed through earnings.
The carrying amounts of Cameco’s non-financial assets are reviewed at each
reporting date to determine whether there is any indication of impairment. If any such indication exists, then the asset’s recoverable amount is estimated. Goodwill is tested annually for impairment.
For impairment testing, assets are grouped together into CGUs which are the smallest group of assets that generate cash inflows from continuing use that are
largely independent of the cash inflows of other assets or CGUs. Goodwill arising from a business combination is allocated to CGUs or groups of CGUs that are expected to benefit from the synergies of the combination.
14
The recoverable amount of an asset or CGU is the greater of its value in use and its fair value less costs to
sell. Value in use is based on the estimated future cash flows, discounted to their present value using a pre-tax discount rate that reflects current market assessments of the time value of money and the risks specific to the asset or CGU. Fair
value is determined as the amount that would be obtained from the sale of the asset or CGU in an arm’s-length transaction between knowledgeable and willing parties. For exploration properties, fair value is based on the implied fair value of
the resources in place using comparable market transaction metrics.
An impairment loss is recognized if the carrying amount of an asset or its CGU
exceeds its recoverable amount. Impairment losses are recognized in earnings. Impairment losses recognized in respect of CGUs are allocated first to reduce the carrying amount of any goodwill allocated to the CGU, and then to reduce the carrying
amounts of the other assets in the CGU on a pro rata basis.
Impairment losses recognized in prior periods are assessed at each reporting date whenever
events or changes in circumstances indicate that the impairment may have reversed. If the impairment has reversed, the carrying amount of the asset is increased to its recoverable amount. An impairment loss is reversed only to the extent that the
asset’s carrying amount does not exceed the carrying amount that would have been determined, net of depreciation or amortization, if no impairment loss had been recognized. A reversal of an impairment loss is recognized immediately in earnings.
An impairment loss in respect of goodwill is not reversed.
| N. |
Exploration and evaluation expenditures |
Exploration and evaluation expenditures are those expenditures
incurred by the Company in connection with the exploration for and evaluation of mineral resources before the technical feasibility and commercial viability of extracting a mineral resource are demonstrable. These expenditures include researching
and analyzing existing exploration data, conducting geological studies, exploratory drilling and sampling, and compiling prefeasibility and feasibility studies. Exploration and evaluation expenditures are charged against earnings as incurred, except
when there is a high degree of confidence in the viability of the project and it is probable that these costs will be recovered through future development and exploitation.
The technical feasibility and commercial viability of extracting a resource is considered to be determinable based on several factors, including the existence
of proven and probable reserves and the demonstration that future economic benefits are probable. When an area is determined to be technically feasible and commercially viable, the exploration and evaluation assets attributable to that area are
first tested for impairment and then transferred to property, plant and equipment.
Exploration and evaluation costs that have been acquired in a business
combination or asset acquisition are capitalized under the scope of IFRS 6, Exploration for and Evaluation of Mineral Resources, and are reported as part of property, plant and equipment.
A provision is recognized if, as a result of a past event, the Company has a present legal
or constructive obligation that can be estimated reliably, and it is probable that an outflow of economic benefits will be required to settle the obligation. Provisions are determined by discounting the risk-adjusted expected future cash flows at a
pre-tax risk-free rate that reflects current market assessments of the time value of money. The unwinding of the discount is recognized as a finance cost.
15
| i. |
Environmental restoration |
The mining, extraction and processing activities of the Company normally give
rise to obligations for site closure and environmental restoration. Closure and restoration can include facility decommissioning and dismantling, removal or treatment of waste materials, as well as site and land restoration. The Company provides for
the closure, reclamation and decommissioning of its operating sites in the financial period when the related environmental disturbance occurs, based on the estimated future costs using information available at the reporting date. Costs included in
the provision comprise all closure and restoration activity expected to occur gradually over the life of the operation and at the time of closure. Routine operating costs that may impact the ultimate closure and restoration activities, such as waste
material handling conducted as a normal part of a mining or production process, are not included in the provision.
The timing of the actual closure and
restoration expenditure is dependent upon a number of factors such as the life and nature of the asset, the operating licence conditions and the environment in which the mine operates. Closure and restoration provisions are measured at the expected
value of future cash flows, discounted to their present value using a current pre-tax risk-free rate. Significant judgments and estimates are involved in deriving the expectations of future activities and the amount and timing of the associated cash
flows.
At the time a provision is initially recognized, to the extent that it is probable that future economic benefits associated with the reclamation,
decommissioning and restoration expenditure will flow to the Company, the corresponding cost is capitalized as an asset. The capitalized cost of closure and restoration activities is recognized in property, plant and equipment and depreciated on a
unit-of-production basis. The value of the provision is gradually increased over time as the effect of discounting unwinds. The unwinding of the discount is an expense recognized in finance costs.
Closure and rehabilitation provisions are also adjusted for changes in estimates. The provision is reviewed at each reporting date for changes to obligations,
legislation or discount rates that effect change in cost estimates or life of operations. The cost of the related asset is adjusted for changes in the provision resulting from changes in estimated cash flows or discount rates, and the adjusted cost
of the asset is depreciated prospectively.
The refining, conversion and manufacturing processes generate certain
uranium-contaminated waste. The Company has established strict procedures to ensure this waste is disposed of safely. A provision for waste disposal costs in respect of these materials is recognized when they are generated. Costs associated with the
disposal, the timing of cash flows and discount rates are estimated both at initial recognition and subsequent measurement.
| P. |
Employee future benefits |
The Company accrues its obligations under employee benefit plans. The Company has
both defined benefit and defined contribution plans. A defined contribution plan is a pension plan under which the Company pays fixed contributions into a separate entity. The Company has no legal or constructive obligations to pay further
contributions if the fund does not hold sufficient assets to pay all employees the benefits relating to employee service in the current and prior periods. A defined benefit plan is a pension plan other than a defined contribution plan. Typically,
defined benefit plans define an amount of pension benefit that an employee will receive on retirement, usually dependent on one or more factors such as age, years of service and compensation.
16
The liability recognized in the consolidated statements of financial position in respect of defined benefit
pension plans is the present value of the defined benefit obligation at the reporting date less the fair value of plan assets. The defined benefit obligation is calculated annually, by qualified independent actuaries using the projected unit credit
method prorated on service and management’s best estimate of expected plan investment performance, salary escalation, retirement ages of employees and expected health care costs. The present value of the defined benefit obligation is determined
by discounting the estimated future cash outflows using interest rates of high-quality corporate bonds that are denominated in the currency in which the benefits will be paid, and that have terms to maturity approximating the terms of the related
pension liability.
The Company recognizes all actuarial gains and losses arising from defined benefit plans in other comprehensive income, and reports
them in retained earnings. When the benefits of a plan are improved, the portion of the increased benefit relating to past service by employees is recognized immediately in earnings.
For defined contribution plans, the contributions are recognized as employee benefit expense in earnings in the periods during which services are rendered by
employees. Prepaid contributions are recognized as an asset to the extent that a cash refund or a reduction in future payments is available.
| ii. |
Other post-retirement benefit plans |
The Company provides certain post-retirement health care benefits
to its retirees. The entitlement to these benefits is usually conditional on the employee remaining in service up to retirement age and the completion of a minimum service period. The expected costs of these benefits are accrued over the period of
employment using the same accounting methodology as used for defined benefit pension plans. Actuarial gains and losses are recognized in other comprehensive income in the period in which they arise. These obligations are valued annually by
independent qualified actuaries.
| iii. |
Short-term employee benefits |
Short-term employee benefit obligations are measured on an undiscounted
basis and are expensed as the related service is provided. A liability is recognized for the amount expected to be paid under short-term cash bonus plans if the Company has a present legal or constructive obligation to pay this amount as a result of
past service provided by the employee, and the obligation can be measured reliably.
Termination benefits are payable when employment is terminated by the Company
before the normal retirement date, or whenever an employee accepts an entity’s offer of benefits in exchange for termination of employment. Cameco recognizes termination benefits as an expense at the earlier of when the Company can no longer
withdraw the offer of those benefits and when the Company recognizes costs for a restructuring. If benefits are payable more than 12 months after the reporting period, they are discounted to their present value.
| v. |
Share-based compensation |
For equity-settled plans, the grant date fair value of share-based
compensation awards granted to employees is recognized as an employee benefit expense, with a corresponding increase in equity, over the period that the employees unconditionally become entitled to the awards. The amount recognized as an expense is
adjusted to reflect the number of awards for which the related service and vesting conditions are expected to be met, such that the amount ultimately recognized as an expense is based on the number of awards that meet the related service and
non-market performance conditions at the vesting date.
For cash-settled plans, the fair value of the amount payable to employees is recognized as an
expense, with a corresponding increase in liabilities, over the period that the employees unconditionally become entitled to payment. The liability is re-measured at each reporting date and at settlement date. Any changes in the fair value of the
liability are recognized as employee benefit expense in earnings.
17
Cameco’s contributions under the employee share ownership plan are expensed during the year of contribution.
Shares purchased with Company contributions and with dividends paid on such shares become unrestricted on January 1 of the second plan year following the date on which such shares were purchased.
Cameco supplies uranium concentrates and uranium conversion services to utility
customers.
Cameco recognizes revenue on the sale of its nuclear products when the risks and rewards of ownership pass to the customer and collection is
reasonably assured. Cameco’s sales are pursuant to an enforceable contract that indicates the type of sales arrangement, pricing and delivery terms, as well as details related to the transfer of title.
Cameco has three types of sales arrangements with its customers in its uranium and fuel services businesses. These arrangements include uranium supply, toll
conversion services and conversion supply (converted uranium), which is a combination of uranium supply and toll conversion services.
Uranium supply
In a uranium supply arrangement, Cameco is contractually obligated to provide uranium concentrates to its customers. Cameco-owned uranium is
physically delivered to conversion facilities (Converters) where the Converter will credit Cameco’s account for the volume of accepted uranium. Based on delivery terms in a sales contract with its customer, Cameco instructs the Converter to
transfer title of a contractually specified quantity of uranium to the customer’s account at the Converter’s facility. At this point, the risks and rewards of ownership have been transferred and Cameco invoices the customer and recognizes
revenue for the uranium supply.
Toll conversion services
In a toll conversion arrangement, Cameco is contractually obligated to convert customer-owned uranium to a chemical state suitable for enrichment. Based on
delivery terms in a sales contract with its customer, Cameco either (i) physically delivers converted uranium to enrichment facilities (Enrichers) where it instructs the Enricher to transfer title of a contractually specified quantity of
converted uranium to the customer’s account at the Enricher’s facility, or (ii) transfers title of a contractually specified quantity of converted uranium to either an Enricher’s account or the customer’s account. At this
point, the risks and rewards of ownership have been transferred and Cameco invoices the customer and recognizes revenue for the toll conversion services.
Conversion supply
In a conversion supply arrangement,
Cameco is contractually obligated to provide converted uranium of acceptable origins to its customers. Based on delivery terms in a sales contract with its customer, Cameco either (i) physically delivers converted uranium to the Enricher where
it instructs the Enricher to transfer title of a contractually specified quantity of converted uranium to the customer’s account at the Enricher’s facility, or (ii) transfers title of a contractually specified quantity of converted
uranium to either an Enricher’s account or a customer’s account at Cameco’s Port Hope conversion facility. At this point, the risks and rewards of ownership have been transferred and Cameco invoices the customer and recognizes revenue
for both the uranium supplied and the conversion service provided.
A financial instrument is any contract that gives rise to a financial asset of
one entity and a financial liability or equity instrument of another.
18
| i. |
Non-derivative financial assets and financial liabilities |
At initial recognition, Cameco classifies
each of its financial assets and financial liabilities into one of the following categories:
Fair value through profit or loss
A financial asset or liability is classified as at fair value through profit or loss if it is classified as held-for-trading or is designated as such on
initial recognition. Cameco classifies a financial instrument as held-for-trading if it was acquired principally for the purpose of selling or repurchasing in the near term, or if it is part of a portfolio with evidence of a recent pattern of
short-term profit taking. Directly attributable transaction costs are recognized in earnings as incurred. These financial assets and financial liabilities are measured at fair value, with any gains or losses on revaluation being recognized in
earnings.
Held-to-maturity
Held-to-maturity
investments are financial assets that an entity has the intention and ability to hold until maturity, provide fixed or determinable payments and contain a fixed maturity date. Assets in this category are initially measured at fair value and
subsequently measured at amortized cost using the effective interest method.
Loans and receivables
Loans and receivables are financial assets that provide fixed or determinable payments and are not quoted in an active market. Assets in this category are
initially measured at fair value and subsequently measured at amortized cost using the effective interest method.
Available-for-sale assets
Available-for-sale financial assets are non-derivative financial assets that are either designated in this category or not classified into any of the other
categories. These assets are measured at fair value plus any directly attributable transaction costs with any gains or losses on re-measurement recognized in other comprehensive income. Accumulated changes in fair value are recorded as a separate
component of equity until the asset is derecognized or impaired, then the cumulative gain or loss in other comprehensive income is transferred to earnings.
Other financial liabilities
This category consists of
all non-derivative financial liabilities that do not meet the definition of held-for-trading liabilities, and that have not been designated as liabilities at fair value through profit or loss. These liabilities are initially recognized at fair value
less any directly attributable transaction costs and are subsequently measured at amortized cost using the effective interest method. Transaction costs arising on the issue of equity instruments are recognized directly in equity. Transaction costs
that are directly related to the probable issuance of a security that is classified as a financial liability is deducted from the amount of the financial liability when it is initially recognized, or recognized in earnings when the issuance is no
longer probable.
Cameco derecognizes a financial asset when the contractual rights to the cash flows from the asset expire, or it transfers the rights to
receive the contractual cash flows in a transaction in which substantially all of the risks and rewards of ownership of the financial asset are transferred.
A financial liability is derecognized when its contractual obligations are discharged or cancelled, or expire.
| ii. |
Derivative financial instruments |
The Company holds derivative financial instruments to reduce exposure
to fluctuations in foreign currency exchange rates and interest rates. Except for those designated as hedging instruments, all derivative financial instruments are recorded at fair value in the consolidated statements of financial position, with any
directly attributable transaction costs recognized in earnings as incurred. Subsequent to initial recognition, changes in fair value are recognized in earnings.
The purpose of hedging transactions is to modify the Company’s exposure to one or more risks by creating an offset between changes in the fair value of,
or the cash flows attributable to, the hedged item and the hedging item. When hedge accounting is appropriate, the hedging relationship is designated as a fair value hedge, a cash flow hedge, or a foreign currency risk hedge related to a net
investment in a foreign operation. The Company does not have any instruments that have been designated as hedge transactions at December 31, 2015.
19
Separable embedded derivatives
Derivatives may be embedded in other financial instruments or executory contracts (the “host instrument”). Embedded derivatives are treated as
separate derivatives when their economic characteristics and risks are not clearly and closely related to those of the host instrument, the terms of the embedded derivative are the same as those of a stand-alone derivative, and the combined contract
is not designated at fair value. These embedded derivatives are measured at fair value with subsequent changes recognized in earnings through gains or losses on derivatives.
Income tax expense is comprised of current and deferred taxes. Current tax and deferred tax
are recognized in earnings except to the extent that it relates to a business combination, or items recognized directly in equity or in other comprehensive income.
Current tax is the expected tax payable or receivable on the taxable income or loss for the year, using tax rates enacted or substantially enacted at the
reporting date, and any adjustments to tax payable in respect of previous years. Current tax assets and liabilities are measured at the amount expected to be paid or recovered from the taxation authorities.
Deferred tax is recognized in respect of temporary differences between the carrying amounts of assets and liabilities for financial reporting purposes and the
amounts used for taxation purposes. In addition, deferred tax is not recognized for taxable temporary differences arising on the initial recognition of goodwill. Deferred tax is measured at the tax rates that are expected to be applied to temporary
differences when they reverse, based on the laws that have been enacted or substantively enacted by the reporting date. Deferred tax assets and liabilities are offset if there is a legally enforceable right to offset current tax liabilities and
assets, and they relate to income taxes levied by the same tax authority on the same taxable entity, or on different tax entities, but they intend to settle current tax liabilities and assets on a net basis or their tax assets and liabilities will
be realized simultaneously.
A deferred tax asset is recognized for unused tax losses, tax credits and deductible temporary differences, to the extent
that it is probable that future taxable profits will be available against which they can be utilized. Deferred tax assets are reviewed at each reporting date and are reduced to the extent that it is no longer probable that the related tax benefit
will be realized.
The Company’s exposure to uncertain tax positions is evaluated and a provision is made where it is probable that this exposure
will materialize.
Common shares are classified as equity. Incremental costs directly attributable to the
issue of common shares are recognized as a reduction of equity, net of any tax effects.
The Company presents basic and diluted earnings per share data for its common
shares. Earnings per share is calculated by dividing the net earnings attributable to equity holders of the Company by the weighted average number of common shares outstanding.
Diluted earnings per share is determined by adjusting the net earnings attributable to equity holders of the Company and the weighted average number of common
shares outstanding, for the effects of all dilutive potential common shares. The calculation of diluted earnings per share assumes that outstanding options which are dilutive to earnings per share are exercised and the proceeds are used to
repurchase shares of the Company at the average market price of the shares for the period. The effect is to increase the number of shares used to calculate diluted earnings per share.
20
An operating segment is a component of the Company that engages in business
activities from which it may earn revenues and incur expenses, including revenues and expenses that relate to transactions with any of the Company’s other segments. To be classified as a segment, discrete financial information must be available
and operating results must be regularly reviewed by the Company’s Chief Executive Officer.
Segment capital expenditure is the total cost incurred
during the period to acquire property, plant and equipment, and intangible assets other than goodwill.
| W. |
Discontinued operations |
A discontinued operation is a component of the Company that has either been
disposed of or that is classified as held for sale. A component of the Company is comprised of operations and cash flows that can be clearly distinguished, operationally and for financial reporting purposes, from the rest of the Company. Net
earnings of a discontinued operation and any gain or loss on disposal are combined and presented as net earnings from discontinued operations in the consolidated statements of earnings.
| A. |
New standards and interpretations not yet adopted |
A number of new standards and amendments to existing
standards are not yet effective for the year ended December 31, 2015, and have not been applied in preparing these consolidated financial statements. Cameco does not intend to early adopt any of the following amendments to existing standards
and does not expect the amendments to have a material impact on the financial statements, unless otherwise noted.
In May 2014, the IASB issued IFRS 15, Revenue from Contracts with Customers (IFRS 15).
IFRS 15 is effective for periods beginning on or after January 1, 2018 and is to be applied retrospectively. IFRS 15 clarifies the principles for recognizing revenue from contracts with customers. The extent of the impact of adoption of IFRS 15
has not yet been determined.
| ii. |
Financial instruments |
In July 2014, the IASB issued IFRS 9, Financial Instruments (IFRS 9). IFRS
9 replaces the existing guidance in IAS 39, Financial Instruments: Recognition and Measurement (IAS 39). IFRS 9 includes revised guidance on the classification and measurement of financial assets, a new expected credit loss model for
calculating impairment on financial assets and new hedge accounting requirements. It also carries forward, from IAS 39, guidance on recognition and derecognition of financial instruments.
IFRS 9 is effective for annual periods beginning on or after January 1, 2018, with early adoption of the new standard permitted. Cameco does not intend
to early adopt IFRS 9. The extent of the impact of adoption of IFRS 9 has not yet been determined.
In January 2016, the IASB issued IFRS 16, Leases (IFRS 16). IFRS 16 is effective for
periods beginning on or after January 1, 2019, with early adoption permitted. IFRS 16 eliminates the current dual model for lessees, which distinguishes between on-balance sheet finance leases and off-balance sheet operating leases. Instead,
there is a single, on-balance sheet accounting model that is similar to current finance lease accounting. The extent of the impact of adoption of IFRS 16 has not yet been determined.
| 4. |
Determination of fair values |
A number of the Company’s accounting policies and disclosures require
the measurement of fair value, for both financial and non-financial assets and liabilities.
21
The fair value of an asset or liability is generally estimated as the amount that would be received on sale of an
asset, or paid to transfer a liability in an orderly transaction between market participants at the reporting date. Fair values of assets and liabilities traded in an active market are determined by reference to last quoted prices, in the principal
market for the asset or liability. In the absence of an active market for an asset or liability, fair values are determined based on market quotes for assets or liabilities with similar characteristics and risk profiles, or through other valuation
techniques. Fair values determined using valuation techniques require the use of inputs, which are obtained from external, readily observable market data when available. In some circumstances, inputs that are not based on observable data must be
used. In these cases, the estimated fair values may be adjusted in order to account for valuation uncertainty, or to reflect the assumptions that market participants would use in pricing the asset or liability.
All fair value measurements are categorized into one of three hierarchy levels, described below, for disclosure purposes. Each level is based on the
transparency of the inputs used to measure the fair values of assets and liabilities:
Level 1 – Values based on unadjusted quoted prices in active
markets that are accessible at the reporting date for identical assets or liabilities.
Level 2 – Values based on quoted prices in markets that are
not active or model inputs that are observable either directly or indirectly for substantially the full term of the asset or liability.
Level 3 –
Values based on prices or valuation techniques that require inputs that are both unobservable and significant to the overall fair value measurement.
When
the inputs used to measure fair value fall within more than one level of the hierarchy, the level within which the fair value measurement is categorized is based on the lowest level input that is significant to the fair value measurement in its
entirety.
Transfers between levels of the fair value hierarchy are recognized at the end of the reporting period during which the transfer occurred.
There were no transfers between level 1, level 2, or level 3 during the period. Cameco does not have any recurring fair value measurements that are categorized as level 3 as of the reporting date.
Further information about the techniques and assumptions used to measure fair values is included in the following notes:
Note 9 - Property, plant and equipment
Note 10 - Goodwill and
intangible assets
Note 12 - Equity-accounted investees
Note 25 - Share-based compensation plans
Note 27 - Financial
instruments and risk management
| 5. |
Use of estimates and judgments |
The preparation of the consolidated financial statements in conformity
with IFRS requires management to make judgments, estimates and assumptions that affect the application of accounting policies and the reported amounts of assets, liabilities, revenues and expenses. Actual results may differ from these estimates.
Estimates and underlying assumptions are reviewed on an ongoing basis. Revisions to accounting estimates are recognized in the period in which the
estimates are revised and in any future period affected.
Information about critical judgments in applying the accounting policies that have the most
significant effect on the amounts recognized in the consolidated financial statements is discussed below. Further details of the nature of these judgments, estimates and assumptions may be found in the relevant notes to the consolidated financial
statements.
22
| A. |
Recoverability of long-lived and intangible assets |
Cameco assesses the carrying values of property,
plant and equipment, and intangible assets when there is an indication of possible impairment. Goodwill and intangible assets not yet available for use or with indefinite useful lives are tested for impairment annually. If it is determined that
carrying values of assets or goodwill cannot be recovered, the unrecoverable amounts are charged against current earnings. Recoverability is dependent upon assumptions and judgments regarding market conditions, costs of production, sustaining
capital requirements and mineral reserves. Other assumptions used in the calculation of recoverable amounts are discount rates, future cash flows and profit margins. A material change in assumptions may significantly impact the potential impairment
of these assets.
In performing impairment assessments of long-lived assets, assets that cannot be
assessed individually are grouped together into the smallest group of assets that generates cash inflows that are largely independent of the cash inflows from other assets or groups of assets. Management is required to exercise judgment in
identifying these CGUs.
| C. |
Provisions for decommissioning and reclamation of assets |
Significant decommissioning and reclamation
activities are often not undertaken until near the end of the useful lives of the productive assets. Regulatory requirements and alternatives with respect to these activities are subject to change over time. A significant change to either the
estimated costs or mineral reserves may result in a material change in the amount charged to earnings.
Cameco operates in a number of tax jurisdictions and is, therefore, required to estimate
its income taxes in each of these tax jurisdictions in preparing its consolidated financial statements. In calculating income taxes, consideration is given to factors such as tax rates in the different jurisdictions, non-deductible expenses, changes
in tax law and management’s expectations of future operating results. Cameco estimates deferred income taxes based on temporary differences between the income and losses reported in its consolidated financial statements and its taxable income
and losses as determined under the applicable tax laws. The tax effect of these temporary differences is recorded as deferred tax assets or liabilities in the consolidated financial statements. The calculation of income taxes requires the use of
judgment and estimates. If these judgments and estimates prove to be inaccurate, future earnings may be materially impacted.
| E. |
Commencement of production stage |
Until a mining property is declared as being in the production stage,
all costs related to its development are capitalized. The determination of the date on which a mine enters the production stage is a matter of judgment that impacts when capitalization of development costs ceases and depreciation of the mining
property commences and is charged to earnings. Refer to note 2 (h)(ii) for further information on the criteria used to make this assessment.
Depreciation on property, plant and equipment is primarily calculated using the
unit-of-production method. This method allocates the cost of an asset to each period based on current period production as a portion of total lifetime production or a portion of estimated mineral reserves. Estimates of life-of-mine and amounts of
mineral reserves are updated annually and are subject to judgment and significant change over time. If actual mineral reserves prove to be significantly different than the estimates, there could be a material impact on the amounts of depreciation
charged to earnings.
23
| G. |
Purchase price allocations |
The purchase price related to a business combination or asset acquisition is
allocated to the underlying acquired assets and liabilities based on their estimated fair values at the time of acquisition. The determination of fair value requires Cameco to make assumptions, estimates and judgments regarding future events. The
allocation process is inherently subjective and impacts the amounts assigned to individually identifiable assets and liabilities. As a result, the purchase price allocation impacts Cameco’s reported assets and liabilities and future net
earnings due to the impact on future depreciation and amortization expense and impairment tests.
| H. |
Determination of joint control |
Cameco conducts certain operations through joint ownership interests.
Judgment is required in assessing whether Cameco has joint control over the investee, which involves determining the relevant activities of the arrangement and whether decisions around relevant activities require unanimous consent. Judgment is also
required to determine whether a joint arrangement should be classified as a joint venture or joint operation. Classifying the arrangement requires us to assess our rights and obligations arising from the arrangement. Specifically, management
considers the structure of the joint arrangement and whether it is structured through a separate vehicle and when the arrangement is structured through a separate vehicle, we also consider the rights and obligations arising from the legal form of
the separate vehicle, the terms of the contractual arrangements and other facts and circumstances, when relevant. This judgment influences whether we equity account or proportionately consolidate our interest in the arrangement.
| 6. |
Discontinued operation |
On March 27, 2014, Cameco completed the sale of its 31.6% limited
partnership interest in Bruce Power L.P. (BPLP) which operates the four Bruce B nuclear reactors in Ontario. The aggregate sale price for Cameco’s interest in BPLP and certain related entities was $450,000,000. The sale has been accounted for
effective January 1, 2014. Cameco received net proceeds of approximately $447,096,000 and realized an after tax gain of $127,243,000 on this divestiture.
As a result of the transaction, Cameco presented the results of BPLP as a discontinued operation and revised its statement of earnings, statement of
comprehensive income and statement of cash flows to reflect this change in presentation. Net earnings from this discontinued operation are as follows:
|
|
|
|
|
|
|
|
|
| |
|
2015 |
|
|
2014 |
|
| Share of earnings from BPLP and related entities |
|
$ |
— |
|
|
$ |
— |
|
| Tax expense |
|
|
— |
|
|
|
— |
|
|
|
|
|
|
|
|
|
|
|
|
|
— |
|
|
|
— |
|
| Gain on disposal of BPLP and related entities |
|
|
— |
|
|
|
144,912 |
|
| Tax expense on disposal |
|
|
— |
|
|
|
17,669 |
|
|
|
|
|
|
|
|
|
|
|
|
|
— |
|
|
|
127,243 |
|
|
|
|
|
|
|
|
|
|
| Net earnings from discontinued operation |
|
$ |
— |
|
|
$ |
127,243 |
|
|
|
|
|
|
|
|
|
|
24
|
|
|
|
|
|
|
|
|
| |
|
2015 |
|
|
2014 |
|
| Trade receivables |
|
$ |
236,859 |
|
|
$ |
428,850 |
|
| HST/VAT receivables |
|
|
6,239 |
|
|
|
19,523 |
|
| Other receivables |
|
|
3,767 |
|
|
|
6,629 |
|
|
|
|
|
|
|
|
|
|
| Total |
|
$ |
246,865 |
|
|
$ |
455,002 |
|
|
|
|
|
|
|
|
|
|
The Company’s exposure to credit and currency risks as well as impairment loss related to trade and other receivables,
excluding harmonized sales tax (HST)/value added tax (VAT) receivables is disclosed in note 27.
|
|
|
|
|
|
|
|
|
| |
|
2015 |
|
|
2014 |
|
| Uranium |
|
|
|
|
|
|
|
|
| Concentrate |
|
$ |
887,083 |
|
|
$ |
500,342 |
|
| Broken ore |
|
|
41,722 |
|
|
|
21,289 |
|
|
|
|
|
|
|
|
|
|
|
|
|
928,805 |
|
|
|
521,631 |
|
|
|
|
| NUKEM |
|
|
216,361 |
|
|
|
251,942 |
|
|
|
|
| Fuel services |
|
|
140,100 |
|
|
|
128,705 |
|
|
|
|
|
|
|
|
|
|
| Total |
|
$ |
1,285,266 |
|
|
$ |
902,278 |
|
|
|
|
|
|
|
|
|
|
In the second quarter of 2015, the production stage was reached at Cameco’s Cigar Lake operation. Effective May 1,
2015, we commenced charging all production costs, including depreciation, to inventory and subsequently recognizing in cost of sales as the product is sold.
Cameco expensed $1,935,000,000 of inventory as cost of sales during 2015 (2014 - $1,698,000,000). Included in cost of sales is a $3,400,000 net recovery,
resulting from the reversal of previous NUKEM inventory write-downs to reflect net realizable value (2014 - $4,300,000).
NUKEM enters into financing
arrangements where future receivables arising from certain sales contracts are sold to financial institutions in exchange for cash. These arrangements require NUKEM to satisfy its delivery obligations under the sales contracts, which are recognized
as deferred sales (note 16). In addition, NUKEM is required to pledge the underlying inventory as security against these performance obligations. As of December 31, 2015, NUKEM had $97,945,000 ($70,770,000 (US)) of inventory pledged as security
under financing arrangements ((2014 - $94,378,000 ($81,353,000 (US)).
25
| 9. |
Property, plant and equipment |
At December 31, 2015
|
|
|
|
|
|
|
|
|
|
|
|
|
|
|
|
|
|
|
|
|
|
|
|
|
| |
|
Land
and
buildings |
|
|
Plant
and
equipment |
|
|
Furniture
and
fixtures |
|
|
Under
construction |
|
|
Exploration
and
evaluation |
|
|
Total |
|
| Cost |
|
|
|
|
|
|
|
|
|
|
|
|
|
|
|
|
|
|
|
|
|
|
|
|
| Beginning of year |
|
$ |
3,423,736 |
|
|
$ |
1,984,721 |
|
|
$ |
120,072 |
|
|
$ |
1,962,500 |
|
|
$ |
1,084,715 |
|
|
$ |
8,575,744 |
|
| Additions |
|
|
35,579 |
|
|
|
23,919 |
|
|
|
1,329 |
|
|
|
292,443 |
|
|
|
2,450 |
|
|
|
355,720 |
|
| Transfers |
|
|
1,245,941 |
|
|
|
508,007 |
|
|
|
5,950 |
|
|
|
(1,747,248 |
) |
|
|
(12,650 |
) |
|
|
— |
|
| Change in reclamation provision |
|
|
26,348 |
|
|
|
— |
|
|
|
— |
|
|
|
— |
|
|
|
— |
|
|
|
26,348 |
|
| Disposals |
|
|
(7,491 |
) |
|
|
(38,077 |
) |
|
|
(9,198 |
) |
|
|
(2,476 |
) |
|
|
(229 |
) |
|
|
(57,471 |
) |
| Effect of movements in exchange rates |
|
|
138,047 |
|
|
|
49,918 |
|
|
|
3,146 |
|
|
|
7,082 |
|
|
|
72,814 |
|
|
|
271,007 |
|
|
|
|
|
|
|
|
|
|
|
|
|
|
|
|
|
|
|
|
|
|
|
|
|
|
| End of year |
|
|
4,862,160 |
|
|
|
2,528,488 |
|
|
|
121,299 |
|
|
|
512,301 |
|
|
|
1,147,100 |
|
|
|
9,171,348 |
|
|
|
|
|
|
|
|
|
|
|
|
|
|
|
|
|
|
|
|
|
|
|
|
|
|
| Accumulated depreciation and impairment |
|
|
|
|
|
|
|
|
|
|
|
|
|
|
|
|
|
|
|
|
|
|
|
|
| Beginning of year |
|
|
1,769,526 |
|
|
|
1,164,969 |
|
|
|
104,101 |
|
|
|
91,621 |
|
|
|
154,506 |
|
|
|
3,284,723 |
|
| Depreciation charge |
|
|
232,179 |
|
|
|
133,655 |
|
|
|
12,925 |
|
|
|
— |
|
|
|
192 |
|
|
|
378,951 |
|
| Transfers |
|
|
21,368 |
|
|
|
94 |
|
|
|
— |
|
|
|
(21,462 |
) |
|
|
— |
|
|
|
— |
|
| Disposals |
|
|
(2,296 |
) |
|
|
(37,530 |
) |
|
|
(9,168 |
) |
|
|
— |
|
|
|
— |
|
|
|
(48,994 |
) |
| Impairment charge(a) |
|
|
120,343 |
|
|
|
70,827 |
|
|
|
108 |
|
|
|
18,522 |
|
|
|
— |
|
|
|
209,800 |
|
| Effect of movements in exchange rates |
|
|
85,082 |
|
|
|
21,293 |
|
|
|
2,478 |
|
|
|
— |
|
|
|
9,855 |
|
|
|
118,708 |
|
|
|
|
|
|
|
|
|
|
|
|
|
|
|
|
|
|
|
|
|
|
|
|
|
|
| End of year |
|
|
2,226,202 |
|
|
|
1,353,308 |
|
|
|
110,444 |
|
|
|
88,681 |
|
|
|
164,553 |
|
|
|
3,943,188 |
|
|
|
|
|
|
|
|
|
|
|
|
|
|
|
|
|
|
|
|
|
|
|
|
|
|
| Net book value at December 31, 2015 |
|
$ |
2,635,958 |
|
|
$ |
1,175,180 |
|
|
$ |
10,855 |
|
|
$ |
423,620 |
|
|
$ |
982,547 |
|
|
$ |
5,228,160 |
|
|
|
|
|
|
|
|
|
|
|
|
|
|
|
|
|
|
|
|
|
|
|
|
|
|
At December 31, 2014
|
|
|
|
|
|
|
|
|
|
|
|
|
|
|
|
|
|
|
|
|
|
|
|
|
| |
|
Land
and
buildings |
|
|
Plant
and
equipment |
|
|
Furniture
and
fixtures |
|
|
Under
construction |
|
|
Exploration
and
evaluation |
|
|
Total |
|
| Cost |
|
|
|
|
|
|
|
|
|
|
|
|
|
|
|
|
|
|
|
|
|
|
|
|
| Beginning of year |
|
$ |
2,971,894 |
|
|
$ |
1,819,611 |
|
|
$ |
97,220 |
|
|
$ |
1,904,400 |
|
|
$ |
1,072,242 |
|
|
$ |
7,865,367 |
|
| Additions |
|
|
26,688 |
|
|
|
18,288 |
|
|
|
5,716 |
|
|
|
407,492 |
|
|
|
14,640 |
|
|
|
472,824 |
|
| Transfers |
|
|
143,639 |
|
|
|
152,564 |
|
|
|
17,171 |
|
|
|
(313,374 |
) |
|
|
— |
|
|
|
— |
|
| Change in reclamation provision |
|
|
228,223 |
|
|
|
— |
|
|
|
— |
|
|
|
— |
|
|
|
— |
|
|
|
228,223 |
|
| Disposals(c) |
|
|
(902 |
) |
|
|
(24,463 |
) |
|
|
(1,111 |
) |
|
|
(40,664 |
) |
|
|
(10,984 |
) |
|
|
(78,124 |
) |
| Effect of movements in exchange rates |
|
|
54,194 |
|
|
|
18,721 |
|
|
|
1,076 |
|
|
|
4,646 |
|
|
|
8,817 |
|
|
|
87,454 |
|
|
|
|
|
|
|
|
|
|
|
|
|
|
|
|
|
|
|
|
|
|
|
|
|
|
| End of year |
|
|
3,423,736 |
|
|
|
1,984,721 |
|
|
|
120,072 |
|
|
|
1,962,500 |
|
|
|
1,084,715 |
|
|
|
8,575,744 |
|
|
|
|
|
|
|
|
|
|
|
|
|
|
|
|
|
|
|
|
|
|
|
|
|
|
| Accumulated depreciation and impairment |
|
|
|
|
|
|
|
|
|
|
|
|
|
|
|
|
|
|
|
|
|
|
|
|
| Beginning of year |
|
|
1,491,681 |
|
|
|
1,019,529 |
|
|
|
81,216 |
|
|
|
70,159 |
|
|
|
161,789 |
|
|
|
2,824,374 |
|
| Depreciation charge |
|
|
185,238 |
|
|
|
111,980 |
|
|
|
23,574 |
|
|
|
94 |
|
|
|
161 |
|
|
|
321,047 |
|
| Transfers |
|
|
(4,190 |
) |
|
|
4,190 |
|
|
|
— |
|
|
|
— |
|
|
|
— |
|
|
|
— |
|
| Disposals |
|
|
(678 |
) |
|
|
(16,736 |
) |
|
|
(336 |
) |
|
|
— |
|
|
|
(7,160 |
) |
|
|
(24,910 |
) |
| Impairment charge(b) |
|
|
66,084 |
|
|
|
38,968 |
|
|
|
— |
|
|
|
21,368 |
|
|
|
— |
|
|
|
126,420 |
|
| Effect of movements in exchange rates |
|
|
31,391 |
|
|
|
7,038 |
|
|
|
(353 |
) |
|
|
— |
|
|
|
(284 |
) |
|
|
37,792 |
|
|
|
|
|
|
|
|
|
|
|
|
|
|
|
|
|
|
|
|
|
|
|
|
|
|
| End of year |
|
|
1,769,526 |
|
|
|
1,164,969 |
|
|
|
104,101 |
|
|
|
91,621 |
|
|
|
154,506 |
|
|
|
3,284,723 |
|
|
|
|
|
|
|
|
|
|
|
|
|
|
|
|
|
|
|
|
|
|
|
|
|
|
| Net book value at December 31, 2014 |
|
$ |
1,654,210 |
|
|
$ |
819,752 |
|
|
$ |
15,971 |
|
|
$ |
1,870,879 |
|
|
$ |
930,209 |
|
|
$ |
5,291,021 |
|
|
|
|
|
|
|
|
|
|
|
|
|
|
|
|
|
|
|
|
|
|
|
|
|
|
26
Cameco has contractual capital commitments of approximately $55,000,000 at December 31, 2015. Certain of the
contractual commitments may contain cancellation clauses, however the Company discloses the commitments based on management’s intent to fulfill the contract. The majority of this amount is expected to be incurred in 2016.
(a) During 2015, Cameco recognized a $209,800,000 impairment charge relating to its Rabbit Lake mill in northern Saskatchewan, which is part of its uranium
segment. Due to increased uncertainty around future production sources for the Rabbit Lake mill as a result of ongoing economic conditions, the Company concluded it was appropriate to recognize an impairment charge. The amount of the charge was
determined as the excess of the carrying value over the recoverable amount. The recoverable amount of the mill was determined to be $68,971,000 based on a fair value less costs to sell model, which incorporated the future cash flows expected to be
derived from the mill. It is categorized as a non-recurring level 3 fair value measurement.
The discount rate used in the fair value less costs to sell
calculation was 8% and was determined based on a market participant’s incremental borrowing cost, adjusted for the marginal return that the participant would expect to use on an investment in the mill. The recoverable amount is not sensitive to
changes in the discount rate. Other key assumptions include operating and capital cost forecasts and the margin applied. Operating and capital cost forecasts have been determined based on management’s internal cost estimates. A 10% increase in
these cost assumptions decreases the recoverable amount by $7,900,000.
(b) During 2014, Cameco recognized a $126,420,000 impairment charge relating to
its Rabbit Lake mine in northern Saskatchewan, which is part of its uranium segment. Due to the deferral of various projects that were related to planned production over the remaining life of the Eagle Point mine, the Company concluded it was
appropriate to recognize an impairment charge. The amount of the charge was determined as the excess of the carrying value over the recoverable amount. The recoverable amount of the mine was determined to be $28,570,000 based on a fair value less
costs to sell model, which incorporated the future cash flows expected to be derived from the mine. It is categorized as a non-recurring level 3 fair value measurement.
The discount rate used in the fair value less costs to sell calculation was 8% and was determined based on a market participant’s incremental borrowing
cost, adjusted for the marginal return that the participant would expect to use on an investment in the mine. The recoverable amount is not sensitive to changes in the discount rate. Other key assumptions include uranium price forecasts and
operating and capital cost forecasts. Uranium prices applied in the calculation were based on approved internal price forecasts, which reflect management’s expectation of prices that a market participant would use. Operating and capital cost
forecasts have been determined based on management’s internal cost estimates. A $1/lb decrease in the uranium price assumption decreases the recoverable amount by $17,600,000.
(c) Due to extended low market conditions and continued efforts to reduce costs, certain projects were re-evaluated. As a result, the Company wrote off
$40,664,000 of assets under construction on these projects in 2014.
27
| 10. |
Goodwill and intangible assets |
| A. |
Reconciliation of carrying amount |
At December 31, 2015
|
|
|
|
|
|
|
|
|
|
|
|
|
|
|
|
|
|
|
|
|
| |
|
Goodwill |
|
|
Contracts |
|
|
Intellectual
property |
|
|
Patents |
|
|
Total |
|
| Cost |
|
|
|
|
|
|
|
|
|
|
|
|
|
|
|
|
|
|
|
|
| Beginning of year |
|
$ |
102,526 |
|
|
$ |
101,549 |
|
|
$ |
118,819 |
|
|
$ |
10,141 |
|
|
$ |
333,035 |
|
| Effect of movements in exchange rates |
|
|
19,788 |
|
|
|
19,599 |
|
|
|
— |
|
|
|
1,957 |
|
|
|
41,344 |
|
|
|
|
|
|
|
|
|
|
|
|
|
|
|
|
|
|
|
|
|
|
| End of year |
|
|
122,314 |
|
|
|
121,148 |
|
|
|
118,819 |
|
|
|
12,098 |
|
|
|
374,379 |
|
|
|
|
|
|
|
|
|
|
|
|
|
|
|
|
|
|
|
|
|
|
| Accumulated amortization |
|
|
|
|
|
|
|
|
|
|
|
|
|
|
|
|
|
|
|
|
| Beginning of year |
|
|
— |
|
|
|
88,978 |
|
|
|
40,992 |
|
|
|
1,963 |
|
|
|
131,933 |
|
| Amortization charge |
|
|
— |
|
|
|
2,458 |
|
|
|
4,438 |
|
|
|
609 |
|
|
|
7,505 |
|
| Effect of movements in exchange rates |
|
|
— |
|
|
|
17,373 |
|
|
|
— |
|
|
|
438 |
|
|
|
17,811 |
|
|
|
|
|
|
|
|
|
|
|
|
|
|
|
|
|
|
|
|
|
|
| End of year |
|
|
— |
|
|
|
108,809 |
|
|
|
45,430 |
|
|
|
3,010 |
|
|
|
157,249 |
|
|
|
|
|
|
|
|
|
|
|
|
|
|
|
|
|
|
|
|
|
|
| Net book value at December 31, 2015 |
|
$ |
122,314 |
|
|
$ |
12,339 |
|
|
$ |
73,389 |
|
|
$ |
9,088 |
|
|
$ |
217,130 |
|
|
|
|
|
|
|
|
|
|
|
|
|
|
|
|
|
|
|
|
|
|
At December 31, 2014
|
|
|
|
|
|
|
|
|
|
|
|
|
|
|
|
|
|
|
|
|
| |
|
Goodwill |
|
|
Contracts |
|
|
Intellectual
property |
|
|
Patents |
|
|
Total |
|
| Cost |
|
|
|
|
|
|
|
|
|
|
|
|
|
|
|
|
|
|
|
|
| Beginning of year |
|
$ |
93,998 |
|
|
$ |
93,102 |
|
|
$ |
118,819 |
|
|
$ |
9,298 |
|
|
$ |
315,217 |
|
| Effect of movements in exchange rates |
|
|
8,528 |
|
|
|
8,447 |
|
|
|
— |
|
|
|
843 |
|
|
|
17,818 |
|
|
|
|
|
|
|
|
|
|
|
|
|
|
|
|
|
|
|
|
|
|
| End of year |
|
|
102,526 |
|
|
|
101,549 |
|
|
|
118,819 |
|
|
|
10,141 |
|
|
|
333,035 |
|
|
|
|
|
|
|
|
|
|
|
|
|
|
|
|
|
|
|
|
|
|
| Accumulated amortization |
|
|
|
|
|
|
|
|
|
|
|
|
|
|
|
|
|
|
|
|
| Beginning of year |
|
|
— |
|
|
|
82,960 |
|
|
|
36,940 |
|
|
|
1,286 |
|
|
|
121,186 |
|
| Amortization charge |
|
|
— |
|
|
|
(1,438 |
) |
|
|
4,052 |
|
|
|
531 |
|
|
|
3,145 |
|
| Effect of movements in exchange rates |
|
|
— |
|
|
|
7,456 |
|
|
|
— |
|
|
|
146 |
|
|
|
7,602 |
|
|
|
|
|
|
|
|
|
|
|
|
|
|
|
|
|
|
|
|
|
|
| End of year |
|
|
— |
|
|
|
88,978 |
|
|
|
40,992 |
|
|
|
1,963 |
|
|
|
131,933 |
|
|
|
|
|
|
|
|
|
|
|
|
|
|
|
|
|
|
|
|
|
|
| Net book value at December 31, 2014 |
|
$ |
102,526 |
|
|
$ |
12,571 |
|
|
$ |
77,827 |
|
|
$ |
8,178 |
|
|
$ |
201,102 |
|
|
|
|
|
|
|
|
|
|
|
|
|
|
|
|
|
|
|
|
|
|
The intangible asset values relate to intellectual property acquired with Cameco Fuel
Manufacturing Inc. (CFM), patents acquired with UFP Investments LLC (UFP) and purchase and sales contracts acquired with NUKEM. The CFM intellectual property is being amortized on a unit-of-production basis over its remaining life. Amortization is
allocated to the cost of inventory and is recognized in cost of products and services sold as inventory is sold. The patents acquired with UFP are being amortized to cost of products and services sold on a straight-line basis over their remaining
life which expires in July 2029. The NUKEM purchase and sales contracts will be amortized to earnings over the remaining terms of the underlying contracts, which extend to 2022. Amortization of the purchase contracts is allocated to the cost of
inventory and is included in cost of products and services sold as inventory is sold. Sales contracts are amortized to revenue. Approximately $3,517,000 of pre-tax earnings (in USD) relating to the amortization of the fair value allocated to the
NUKEM contracts will be amortized in 2016 with the remaining balance being recognized fairly evenly each year through 2022.
28
For the purpose of impairment testing, goodwill is attributable to NUKEM, which is
considered a CGU.
The recoverable amount of NUKEM was estimated based on a value in use calculation, which involved discounting the future cash flows
expected to be generated from the continuing use of the CGU. The estimated recoverable amount of NUKEM exceeded its carrying amount by approximately $55,524,000 (US) and therefore no impairment loss was recognized.
Five years of cash flows were included in the discounted cash flow model. Any cash flows expected to be generated beyond the initial five-year period were
extrapolated using a terminal value growth rate. The projected cash flows included in the calculation were based upon NUKEM’s approved financial forecasts and strategic plan, which incorporate NUKEM’s current contract portfolio as well as
management’s expectations regarding future business activity. The key assumptions used in the estimation of the value in use were as follows:
|
|
|
|
|
| |
|
2015 |
|
| Discount rate (pre-tax) |
|
|
11.8 |
% |
| Discount rate (post-tax) |
|
|
8.8 |
% |
| Terminal value growth rate |
|
|
2.5 |
% |
The discount rate was determined based on NUKEM’s internal weighted average cost of capital, adjusted for the marginal
return a market participant would expect to earn on an investment in the entity. It represents a nominal, post-tax figure. The terminal value growth rate was determined based on management’s expected average annual long-term growth in the
uranium industry. The rate represents a nominal figure and is consistent with forecast economic growth rates observed in the market.
Other key
assumptions include uranium price forecasts and perpetual cash flows. Uranium prices applied in the calculation were based on approved internal price forecasts, which reflect management’s experience and industry expertise. These prices are
consistent with expected long-term prices observed in the market. Perpetual cash flows have been determined based on management’s expectation of future business activity.
Cameco has validated the results of the value in use calculation by performing sensitivity tests on its key assumptions. Holding all other variables constant,
the decreases in recoverable amount created by marginal changes in each of the key assumptions are as follows:
|
|
|
|
|
|
|
| |
|
Change in assumption |
|
Amount of decrease |
|
| Discount rate |
|
1% increase |
|
$ |
37,222 |
|
| Terminal value growth rate |
|
1% decrease |
|
|
30,805 |
|
| Uranium prices |
|
$1/lb decrease |
|
|
6,001 |
|
| Perpetual annual cash flow |
|
$1 million (US) decrease |
|
|
11,131 |
|
As a result of these tests, the Company believes that any reasonably possible changes in the key assumptions would not result
in NUKEM’s carrying amount exceeding its recoverable amount.
29
| 11. |
Long-term receivables, investments and other |
|
|
|
|
|
|
|
|
|
| |
|
2015 |
|
|
2014 |
|
| Investments in equity securities [note 27] |
|
$ |
938 |
|
|
$ |
6,601 |
|
| Derivatives [note 27] |
|
|
11,143 |
|
|
|
3,889 |
|
| Advances receivable from JV Inkai LLP [note 32] |
|
|
87,188 |
|
|
|
91,672 |
|
| Investment tax credits |
|
|
93,972 |
|
|
|
90,658 |
|
| Amounts receivable related to tax dispute [note 22] |
|
|
232,614 |
|
|
|
211,604 |
|
| Other |
|
|
35,574 |
|
|
|
29,197 |
|
|
|
|
|
|
|
|
|
|
|
|
|
461,429 |
|
|
|
433,621 |
|
| Less current portion |
|
|
(12,193 |
) |
|
|
(10,341 |
) |
|
|
|
|
|
|
|
|
|
| Net |
|
$ |
449,236 |
|
|
$ |
423,280 |
|
|
|
|
|
|
|
|
|
|
| 12. |
Equity-accounted investees |
Associates
| i. |
GE-Hitachi Global Laser Enrichment LLC (GLE) |
GLE primarily operates in North Carolina and is testing a
third-generation technology that, if successful, will use lasers to commercially enrich uranium. Cameco owns a 24% interest in GLE and accounts for it under the equity method of accounting.
During 2014, a decision was made by the majority partner of GLE to significantly reduce funding of the project. Because the technology is unique to the
industry and inherently risky, the significant reduction of funding introduced a further level of risk and jeopardized the viability of the project. As a result, Cameco determined the fair value less costs to sell to be nil and as such recognized an
impairment charge of $183,615,000, which represented the full amount of Cameco’s investment. Future contributions to the project are being reflected in net earnings.
The following table summarizes the share of GLE’s earnings that Cameco has recognized:
|
|
|
|
|
|
|
|
|
| |
|
2015 |
|
|
2014 |
|
| Loss from operations and comprehensive loss |
|
$ |
— |
|
|
$ |
(55,279 |
) |
| Cameco’s share of loss from operations and comprehensive loss (24%) |
|
$ |
— |
|
|
$ |
(13,267 |
) |
Following the impairment of the investment in 2014, Cameco discontinued recognizing its share of losses in GLE. Cameco’s
contributions to GLE are recorded in earnings as research and development.
Cameco has one other associate. The following table summarizes the carrying amount and
share of loss and other comprehensive income of this associate:
|
|
|
|
|
|
|
|
|
| |
|
2015 |
|
|
2014 |
|
| Carrying amount of associate |
|
$ |
2,472 |
|
|
$ |
3,230 |
|
| Share of loss from operations and comprehensive loss |
|
$ |
(758 |
) |
|
$ |
(3,874 |
) |
At December 31, 2015, the quoted value of the Company’s share in this associate that has shares listed on a
recognized stock exchange was $7,503,000 (2014 - $14,256,000).
30
| 13. |
Accounts payable and accrued liabilities |
|
|
|
|
|
|
|
|
|
| |
|
2015 |
|
|
2014 |
|
| Trade payables |
|
$ |
199,084 |
|
|
$ |
183,120 |
|
| Non-trade payables |
|
|
107,731 |
|
|
|
114,174 |
|
| Payables due to related parties |
|
|
11,041 |
|
|
|
18,964 |
|
|
|
|
|
|
|
|
|
|
| Total |
|
$ |
317,856 |
|
|
$ |
316,258 |
|
|
|
|
|
|
|
|
|
|
The Company’s exposure to currency and liquidity risk related to trade and other payables is disclosed in note 27.
Cameco borrows directly in the commercial paper market. At December 31, 2015 and
2014, there was no commercial paper outstanding.
NUKEM has a multicurrency revolving loan facility that is available until October 1, 2020. Total
funds of €75,000,000 are available under the facility, with the option to increase the facility by an additional €25,000,000. Amounts can be drawn in either Euros or US dollars in the form of bank overdrafts, letters of credit, short-term
loans or foreign exchange facilities. Any amounts drawn in Euros bear interest at a rate equal to the comparable EURIBOR on the draw date plus 0.6%, while amounts drawn in US dollars bear interest at a rate equal to the comparable LIBOR on the draw
date plus 0.6%.
At December 31, 2015 and 2014, there were no amounts withdrawn against the facility. As of December 31, 2015, NUKEM has
$406,000 (US) in letters of credit outstanding against the facility in support of performance obligations under outstanding delivery contracts (2014 - $356,000 (US)).
The terms of the facility contain a financial covenant that requires NUKEM to maintain a minimum working capital to debt ratio of 1.35. The facility also
stipulates Cameco as a guarantor for NUKEM’s withdrawals and requires the Company to maintain a credit rating of at least BBB-. Failure to comply with these covenants could result in cancellation of the facility and accelerated payment of any
outstanding amounts. As of December 31, 2015, NUKEM and Cameco were in compliance with the covenants and the Company does not expect its operating and investing activities in 2016 to be constrained by them.
|
|
|
|
|
|
|
|
|
| |
|
2015 |
|
|
2014 |
|
| Unsecured debentures |
|
|
|
|
|
|
|
|
| Series D - 5.67% debentures due September 2, 2019 |
|
$ |
497,954 |
|
|
$ |
497,465 |
|
| Series E - 3.75% debentures due November 14, 2022 |
|
|
398,097 |
|
|
|
397,857 |
|
| Series F - 5.09% debentures due November 14, 2042 |
|
|
99,243 |
|
|
|
99,230 |
|
| Series G - 4.19% debentures due June 24, 2024 |
|
|
496,943 |
|
|
|
496,646 |
|
|
|
|
|
|
|
|
|
|
| Total |
|
$ |
1,492,237 |
|
|
$ |
1,491,198 |
|
|
|
|
|
|
|
|
|
|
On June 24, 2014, Cameco issued $500,000,000 of Series G debentures and announced the early redemption of the outstanding
Series C debentures. The Series G debentures bear interest at a rate of 4.19% per annum. The net proceeds of the issue after deducting expenses were approximately $496,400,000. The debentures mature on June 24, 2024 and are being amortized
at an effective interest rate of 4.28%. The $300,000,000 principal amount of the Series C debentures was redeemed on July 16, 2014. The company incurred total charges of $12,135,000 in relation to the early redemption of these debentures (note
20).
31
Cameco has a $1,250,000,000 unsecured revolving credit facility that is available until November 1, 2019.
Upon mutual agreement, the facility can be extended for an additional year on the anniversary date. In addition to direct borrowings under the facility, up to $100,000,000 can be used for the issuance of letters of credit and, to the extent
necessary, it may be used to provide liquidity support for the Company’s commercial paper program. The agreement also provides the ability to increase the revolving credit facility above $1,250,000,000 by increments no less than $50,000,000, to
a total of $1,750,000,000. The facility ranks equally with all of Cameco’s other senior debt. As of December 31, 2015 and 2014, there were no amounts outstanding under this facility.
Cameco has $1,490,809,000 (2014 - $1,068,420,000) in letter of credit facilities. Outstanding and committed letters of credit at December 31, 2015
amounted to $1,384,061,000 (2014 - $950,716,000), the majority of which relate to future decommissioning and reclamation liabilities (note 17).
Cameco is
bound by a covenant in its revolving credit facility. The covenant requires a funded debt to tangible net worth ratio equal to or less than 1:1. Non-compliance with this covenant could result in accelerated payment and termination of the revolving
credit facility. At December 31, 2015, Cameco was in compliance with the covenant and does not expect its operating and investing activities in 2016 to be constrained by it.
The table below represents currently scheduled maturities of long-term debt:
|
|
|
|
|
|
|
|
|
|
|
|
|
|
|
|
|
|
|
|
|
|
|
|
|
| 2016 |
|
2017 |
|
|
2018 |
|
|
2019 |
|
|
2020 |
|
|
Thereafter |
|
|
Total |
|
| $— |
|
|
— |
|
|
|
— |
|
|
|
497,954 |
|
|
|
— |
|
|
|
994,283 |
|
|
$ |
1,492,237 |
|
|
|
|
|
|
|
|
|
|
| |
|
2015 |
|
|
2014 |
|
| Deferred sales |
|
$ |
132,904 |
|
|
$ |
123,298 |
|
| Derivatives [note 27] |
|
|
168,236 |
|
|
|
67,916 |
|
| Accrued pension and post-retirement benefit liability [note 26] |
|
|
64,135 |
|
|
|
61,670 |
|
| Other |
|
|
7,980 |
|
|
|
7,033 |
|
|
|
|
|
|
|
|
|
|
|
|
|
373,255 |
|
|
|
259,917 |
|
| Less current portion |
|
|
(241,113 |
) |
|
|
(87,883 |
) |
|
|
|
|
|
|
|
|
|
| Net |
|
$ |
132,142 |
|
|
$ |
172,034 |
|
|
|
|
|
|
|
|
|
|
Deferred sales includes $110,749,000 ($80,021,000 (US)) of performance obligations relating to financing arrangements entered
into by NUKEM (2014 - $107,076,000 ($92,299,000 (US))) (note 8).
32
|
|
|
|
|
|
|
|
|
|
|
|
|
| |
|
Reclamation |
|
|
Waste disposal |
|
|
Total |
|
| Beginning of year |
|
$ |
828,015 |
|
|
$ |
18,295 |
|
|
$ |
846,310 |
|
| Changes in estimates and discount rates |
|
|
26,348 |
|
|
|
58 |
|
|
|
26,406 |
|
| Provisions used during the period |
|
|
(10,848 |
) |
|
|
(959 |
) |
|
|
(11,807 |
) |
| Unwinding of discount |
|
|
21,098 |
|
|
|
330 |
|
|
|
21,428 |
|
| Effect of movements in exchange rates |
|
|
52,421 |
|
|
|
— |
|
|
|
52,421 |
|
|
|
|
|
|
|
|
|
|
|
|
|
|
| End of period |
|
$ |
917,034 |
|
|
$ |
17,724 |
|
|
$ |
934,758 |
|
|
|
|
|
|
|
|
|
|
|
|
|
|
| Current |
|
$ |
12,994 |
|
|
$ |
3,601 |
|
|
$ |
16,595 |
|
| Non-current |
|
|
904,040 |
|
|
|
14,123 |
|
|
|
918,163 |
|
|
|
|
|
|
|
|
|
|
|
|
|
|
|
|
$ |
917,034 |
|
|
$ |
17,724 |
|
|
$ |
934,758 |
|
|
|
|
|
|
|
|
|
|
|
|
|
|
Cameco’s estimates of future decommissioning obligations are based on
reclamation standards that satisfy regulatory requirements. Elements of uncertainty in estimating these amounts include potential changes in regulatory requirements, decommissioning and reclamation alternatives and amounts to be recovered from other
parties.
Cameco estimates total future decommissioning and reclamation costs for its existing operating assets to be $974,785,000 (2014 - $874,314,000). The expected timing of these outflows is based on life-of-mine plans with the majority of expenditures expected to occur after 2021. These estimates are reviewed by Cameco technical
personnel as required by regulatory agencies or more frequently as circumstances warrant. In connection with future decommissioning and reclamation costs, Cameco has provided financial assurances of $1,010,784,000 (2014 - $910,902,000) in the form
of letters of credit to satisfy current regulatory requirements.
The reclamation provision relates to the following segments:
|
|
|
|
|
|
|
|
|
| |
|
2015 |
|
|
2014 |
|
| Uranium |
|
$ |
741,561 |
|
|
$ |
682,769 |
|
| Fuel services |
|
|
175,473 |
|
|
|
145,246 |
|
|
|
|
|
|
|
|
|
|
| Total |
|
$ |
917,034 |
|
|
$ |
828,015 |
|
|
|
|
|
|
|
|
|
|
The Fuel Services division consists of the Blind River refinery, Port Hope conversion
facility and Cameco Fuel Manufacturing Inc. The refining, conversion and manufacturing processes generate certain uranium contaminated waste. These include contaminated combustible material (paper, rags, gloves, etc.) and contaminated
non-combustible material (metal parts, soil from excavations, building and roofing materials, spent uranium concentrate drums, etc.). These materials can in some instances be recycled or reprocessed. A provision for waste disposal costs in respect
of these materials is recognized when they are generated.
Cameco estimates total future costs related to existing waste disposal to be $17,158,000 (2014
- $18,100,000). These outflows are expected to occur within the next three years.
33
Authorized share capital:
| |
• |
|
Unlimited number of first preferred shares |
| |
• |
|
Unlimited number of second preferred shares |
| |
• |
|
Unlimited number of voting common shares, no stated par value, and |
|
|
|
|
|
|
|
|
|
| Number issued (number of shares) |
|
2015 |
|
|
2014 |
|
| Beginning of year |
|
|
395,792,522 |
|
|
|
395,477,230 |
|
|
|
|
| Issued: |
|
|
|
|
|
|
|
|
| Stock option plan [note 25] |
|
|
— |
|
|
|
315,292 |
|
|
|
|
|
|
|
|
|
|
| Total |
|
|
395,792,522 |
|
|
|
395,792,522 |
|
|
|
|
|
|
|
|
|
|
All issued shares are fully paid.
One Class B share issued during 1988 and assigned $1 of share capital entitles the
shareholder to vote separately as a class in respect of any proposal to locate the head office of Cameco to a place not in the province of Saskatchewan.
Dividends on Cameco Corporation common shares are declared in Canadian dollars. For the year
ended December 31, 2015, the dividend declared per share was $0.40 (December 31, 2014 - $0.40).
| 19. |
Employee benefit expense |
The following employee benefit expenses are included in cost of products and
services sold, administration, exploration, research and development and property, plant and equipment:
|
|
|
|
|
|
|
|
|
| |
|
2015 |
|
|
2014 |
|
| Wages and salaries |
|
$ |
397,730 |
|
|
$ |
353,254 |
|
| Statutory and company benefits |
|
|
65,936 |
|
|
|
66,456 |
|
| Equity-settled share-based compensation [note 25] |
|
|
22,148 |
|
|
|
21,048 |
|
| Expenses related to defined benefit plans [note 26] |
|
|
5,003 |
|
|
|
7,605 |
|
| Contributions to defined contribution plans [note 26] |
|
|
17,961 |
|
|
|
17,274 |
|
| Cash-settled share-based compensation [note 25] |
|
|
(1,011 |
) |
|
|
(1,616 |
) |
|
|
|
|
|
|
|
|
|
| Total |
|
$ |
507,767 |
|
|
$ |
464,021 |
|
|
|
|
|
|
|
|
|
|
|
|
|
|
|
|
|
|
|
| |
|
2015 |
|
|
2014 |
|
| Interest on long-term debt |
|
$ |
74,969 |
|
|
$ |
67,614 |
|
| Unwinding of discount on provisions |
|
|
21,428 |
|
|
|
20,671 |
|
| Other charges |
|
|
7,101 |
|
|
|
6,531 |
|
| Loss on redemption of Series C debentures [note 15] |
|
|
— |
|
|
|
12,135 |
|
| Interest on short-term debt |
|
|
117 |
|
|
|
4,902 |
|
|
|
|
|
|
|
|
|
|
| Total |
|
$ |
103,615 |
|
|
$ |
111,853 |
|
|
|
|
|
|
|
|
|
|
No borrowing costs were determined to be eligible for capitalization during the year.
34
| 21. |
Other income (expense) |
|
|
|
|
|
|
|
|
|
| |
|
2015 |
|
|
2014 |
|
| Foreign exchange gains |
|
$ |
59,323 |
|
|
$ |
34,731 |
|
| Contract settlement |
|
|
— |
|
|
|
65,557 |
|
| Contract termination fee |
|
|
— |
|
|
|
(18,304 |
) |
| Other |
|
|
(4,600 |
) |
|
|
3,338 |
|
|
|
|
|
|
|
|
|
|
| Total |
|
$ |
54,723 |
|
|
$ |
85,322 |
|
|
|
|
|
|
|
|
|
|
In 2014, Cameco recorded an early termination fee of $18,304,000, incurred as a result of the cancellation of our toll
conversion agreement with Springfields Fuels Ltd., which was to expire in 2016.
In addition, Cameco recorded a gain with respect to a long-term supply
contract with one of its utility customers. The $65,557,000 reflected as income from contract settlement related to deliveries that the customer refused to take in the years 2012 through 2017. This represented the full amount to be received in
relation to this contract dispute.
| A. |
Significant components of deferred tax assets and liabilities |
|
|
|
|
|
|
|
|
|
|
|
|
|
|
|
|
|
| |
|
Recognized in earnings |
|
|
As at December 31 |
|
| |
|
2015 |
|
|
2014 |
|
|
2015 |
|
|
2014 |
|
| Assets |
|
|
|
|
|
|
|
|
|
|
|
|
|
|
|
|
| Provision for reclamation |
|
$ |
1,572 |
|
|
$ |
75,732 |
|
|
$ |
253,821 |
|
|
$ |
251,045 |
|
| Foreign exploration and development |
|
|
(782 |
) |
|
|
(807 |
) |
|
|
5,322 |
|
|
|
6,103 |
|
| Income tax losses |
|
|
88,186 |
|
|
|
136,294 |
|
|
|
424,344 |
|
|
|
335,856 |
|
| Defined benefit plan actuarial losses |
|
|
— |
|
|
|
— |
|
|
|
5,184 |
|
|
|
5,813 |
|
| Long-term investments and other |
|
|
15,316 |
|
|
|
1,424 |
|
|
|
82,273 |
|
|
|
67,060 |
|
|
|
|
|
|
|
|
|
|
|
|
|
|
|
|
|
|
| Deferred tax assets |
|
|
104,292 |
|
|
|
212,643 |
|
|
|
770,944 |
|
|
|
665,877 |
|
|
|
|
|
|
|
|
|
|
|
|
|
|
|
|
|
|
| Liabilities |
|
|
|
|
|
|
|
|
|
|
|
|
|
|
|
|
| Property, plant and equipment |
|
|
(111,080 |
) |
|
|
(1,334 |
) |
|
|
69,875 |
|
|
|
182,841 |
|
| Inventories |
|
|
1,984 |
|
|
|
(15,719 |
) |
|
|
22,574 |
|
|
|
20,590 |
|
| Other |
|
|
— |
|
|
|
(3,102 |
) |
|
|
— |
|
|
|
— |
|
|
|
|
|
|
|
|
|
|
|
|
|
|
|
|
|
|
| Deferred tax liabilities |
|
|
(109,096 |
) |
|
|
(20,155 |
) |
|
|
92,449 |
|
|
|
203,431 |
|
|
|
|
|
|
|
|
|
|
|
|
|
|
|
|
|
|
| Net deferred tax asset |
|
$ |
213,388 |
|
|
$ |
232,798 |
|
|
$ |
678,495 |
|
|
$ |
462,446 |
|
|
|
|
|
|
|
|
|
|
|
|
|
|
|
|
|
|
|
|
|
|
|
|
|
|
|
| |
|
2015 |
|
|
2014 |
|
| Deferred tax allocated as |
|
|
|
|
|
|
|
|
| Deferred tax assets |
|
$ |
713,674 |
|
|
$ |
486,328 |
|
| Deferred tax liabilities |
|
|
(35,179 |
) |
|
|
(23,882 |
) |
|
|
|
|
|
|
|
|
|
| Net deferred tax asset |
|
$ |
678,495 |
|
|
$ |
462,446 |
|
|
|
|
|
|
|
|
|
|
Based on projections of future income, realization of these deferred tax assets is probable and consequently a deferred tax
asset has been recorded.
35
| B. |
Movement in net deferred tax assets and liabilities |
|
|
|
|
|
|
|
|
|
| |
|
2015 |
|
|
2014 |
|
| Net deferred tax asset at beginning of year |
|
$ |
462,446 |
|
|
$ |
224,294 |
|
| Recovery for the year in net earnings(a) |
|
|
213,388 |
|
|
|
246,558 |
|
| Expense on discontinued operations |
|
|
— |
|
|
|
(13,761 |
) |
| Recovery (expense) for the year in comprehensive income |
|
|
(669 |
) |
|
|
3,171 |
|
| Effect of movements in exchange rates |
|
|
3,330 |
|
|
|
2,184 |
|
|
|
|
|
|
|
|
|
|
| End of year |
|
$ |
678,495 |
|
|
$ |
462,446 |
|
|
|
|
|
|
|
|
|
|
| (a) |
During the fourth quarter, we reversed amounts related to our deferred tax asset in the US totalling $72,600,000. We determined that it was no longer probable that there would be sufficient taxable profit in the future
against which the operating losses and other tax deductions could be used. |
| C. |
Significant components of unrecognized deferred tax assets |
|
|
|
|
|
|
|
|
|
| |
|
2015 |
|
|
2014 |
|
| Income tax losses |
|
$ |
194,045 |
|
|
$ |
130,300 |
|
| Property, plant and equipment |
|
|
1,904 |
|
|
|
1,404 |
|
| Provision for reclamation |
|
|
25,952 |
|
|
|
— |
|
| Long-term investments and other |
|
|
107,305 |
|
|
|
85,927 |
|
|
|
|
|
|
|
|
|
|
| Total |
|
$ |
329,206 |
|
|
$ |
217,631 |
|
|
|
|
|
|
|
|
|
|
| D. |
Tax rate reconciliation |
The provision for income taxes differs from the amount computed by applying the
combined expected federal and provincial income tax rate to earnings before income taxes. The reasons for these differences are as follows:
|
|
|
|
|
|
|
|
|
| |
|
2015 |
|
|
2014 |
|
| Loss from continuing operations before income taxes and non-controlling interest |
|
$ |
(79,268 |
) |
|
$ |
(119,098 |
) |
| Combined federal and provincial tax rate |
|
|
26.9 |
% |
|
|
26.9 |
% |
|
|
|
|
|
|
|
|
|
| Computed income tax recovery |
|
|
(21,323 |
) |
|
|
(32,037 |
) |
| Increase (decrease) in taxes resulting from: |
|
|
|
|
|
|
|
|
| Difference between Canadian rates and rates applicable to subsidiaries in other countries |
|
|
(197,967 |
) |
|
|
(225,368 |
) |
| Change in unrecognized deferred tax assets |
|
|
111,575 |
|
|
|
76,009 |
|
| Other taxes |
|
|
2,172 |
|
|
|
3,430 |
|
| Share-based compensation plans |
|
|
1,528 |
|
|
|
2,094 |
|
| Change in tax provision related to transfer pricing |
|
|
(35,000 |
) |
|
|
12,000 |
|
| Non-deductible (non-taxable) capital amounts |
|
|
(2,362 |
) |
|
|
(8,108 |
) |
| Other permanent differences |
|
|
(1,253 |
) |
|
|
(3,288 |
) |
|
|
|
|
|
|
|
|
|
| Income tax recovery |
|
$ |
(142,630 |
) |
|
$ |
(175,268 |
) |
|
|
|
|
|
|
|
|
|
36
| E. |
Earnings and income taxes by jurisdiction |
|
|
|
|
|
|
|
|
|
| |
|
2015 |
|
|
2014 |
|
| Earnings (loss) from continuing operations before income taxes |
|
|
|
|
|
|
|
|
| Canada |
|
$ |
(959,661 |
) |
|
$ |
(840,705 |
) |
| Foreign |
|
|
880,393 |
|
|
|
721,607 |
|
|
|
|
|
|
|
|
|
|
|
|
$ |
(79,268 |
) |
|
$ |
(119,098 |
) |
|
|
|
|
|
|
|
|
|
| Current income taxes (recovery) |
|
|
|
|
|
|
|
|
| Canada |
|
$ |
14,617 |
|
|
$ |
(2,944 |
) |
| Foreign |
|
|
56,141 |
|
|
|
74,234 |
|
|
|
|
|
|
|
|
|
|
|
|
$ |
70,758 |
|
|
$ |
71,290 |
|
| Deferred income taxes (recovery) |
|
|
|
|
|
|
|
|
| Canada |
|
$ |
(291,363 |
) |
|
$ |
(209,255 |
) |
| Foreign |
|
|
77,975 |
|
|
|
(37,303 |
) |
|
|
|
|
|
|
|
|
|
|
|
$ |
(213,388 |
) |
|
$ |
(246,558 |
) |
|
|
|
|
|
|
|
|
|
| Income tax recovery |
|
$ |
(142,630 |
) |
|
$ |
(175,268 |
) |
|
|
|
|
|
|
|
|
|
Canada
In 2008, as part of the ongoing annual audits of Cameco’s Canadian tax returns, Canada Revenue Agency (CRA) disputed the transfer pricing structure and
methodology used by Cameco and its wholly owned Swiss subsidiary, Cameco Europe Ltd., in respect of sale and purchase agreements for uranium products. From December 2008 to date, CRA issued notices of reassessment for the taxation years 2003 through
2010, which in aggregate have increased Cameco’s income for Canadian tax purposes by approximately $3,400,000,000. CRA has also issued notices of reassessment for transfer pricing penalties for the years 2007 through 2009 in the amount of
$229,000,000. Cameco believes it is likely that CRA will reassess Cameco’s tax returns for subsequent years on a similar basis and that these will require Cameco to make future remittances or provide security on receipt of the reassessments.
Using the methodology we believe that CRA will continue to apply and including the $3,400,000,000 already reassessed, we expect to receive notices of
reassessment for a total of approximately $7,000,000,000 for the years 2003 through 2015, which would increase Cameco’s income for Canadian tax purposes and result in a related tax expense of approximately $2,100,000,000. In addition to
penalties already imposed, CRA may continue to apply penalties to taxation years subsequent to 2009. As a result, we estimate that cash taxes and transfer pricing penalties would be between $1,650,000,000 and $1,700,000,000. In addition, we estimate
there would be interest and instalment penalties applied that would be material to Cameco. While in dispute, we would be responsible for remitting or otherwise securing 50% of the cash taxes and transfer pricing penalties (between $825,000,000 and
$850,000,000), plus related interest and instalment penalties assessed, which would be material to Cameco.
Under Canadian federal and provincial tax
rules, the amount required to be remitted each year will depend on the amount of income reassessed in that year and the availability of elective deductions. Recently, the CRA disallowed the use of any loss carry-backs to be applied to any transfer
pricing adjustment, starting with the 2008 tax year. In light of our view of the likely outcome of the case, we expect to recover the amounts remitted to CRA, including cash taxes, interest and penalties totalling $232,614,000 already paid as at
December 31, 2015 (December 31, 2014 - $211,604,000) (note 11). In addition to the cash remitted, we have provided $332,000,000 in letters of credit to secure 50% of the cash taxes and related interest amounts reassessed in 2015.
37
The case on the 2003, 2005 and 2006 reassessments is expected to go to trial in the third quarter of 2016. If
this timing is adhered to, we expect to have a Tax Court decision within six to 18 months after the trial is complete.
Having regard to advice from its
external advisors, Cameco’s opinion is that CRA’s position is incorrect and Cameco is contesting CRA’s position and expects to recover any amounts remitted or secured as a result of the reassessments. However, to reflect the
uncertainties of CRA’s appeals process and litigation, Cameco has recorded a cumulative tax provision related to this matter for the years 2003 through the current period in the amount of $50,000,000 (previously $92,000,000). We have reduced
the provision to reflect management’s revised estimate which takes into account additional contract information. While the resolution of this matter may result in liabilities that are higher or lower than the reserve, management believes that
the ultimate resolution will not be material to Cameco’s financial position, results of operations or liquidity in the year(s) of resolution. Resolution of this matter as stipulated by CRA would be material to Cameco’s financial position,
results of operations or liquidity in the year(s) of resolution and other unfavourable outcomes for the years 2003 to date could be material to Cameco’s financial position, results of operations and cash flows in the year(s) of resolution.
Further to Cameco’s decision to contest CRA’s reassessments, Cameco is pursuing its appeal rights under Canadian federal and provincial tax rules.
United States
In 2015, we received Revenue
Agent’s Reports (RARs) from the Internal Revenue Service (IRS) pertaining to the taxation years 2009, 2010 and 2011-2012, challenging the transfer pricing used under certain intercompany transactions. The RARs list the IRS’ proposed
adjustments to taxable income and calculate the tax and penalties owing based on the proposed adjustments.
The proposed adjustments reflected in the RARs
are focused on transfer pricing in respect of certain intercompany transactions within our corporate structure. The IRS asserts that a portion of the non-US income reported under our corporate structure and taxed outside the US should be recognized
and taxed in the US. Having regard to advice from its external advisors, management believes that the conclusions of the IRS in the RARs are incorrect and is contesting them in an administrative appeal of the proposed adjustments. No cash payments
are required while pursuing an administrative appeal. Management believes that the ultimate resolution of this matter will not be material to our financial position, results of operations or liquidity in the year(s) of resolution.
38
At December 31, 2015, income tax losses carried forward of $2,177,332,000 (2014
- $1,632,194,000) are available to reduce taxable income. These losses expire as follows:
|
|
|
|
|
|
|
|
|
|
|
|
|
|
|
|
|
| Date of expiry |
|
Canada |
|
|
US |
|
|
Other |
|
|
Total |
|
| 2020 |
|
$ |
— |
|
|
$ |
— |
|
|
$ |
1,247 |
|
|
$ |
1,247 |
|
| 2028 |
|
|
94,702 |
|
|
|
— |
|
|
|
— |
|
|
|
94,702 |
|
| 2029 |
|
|
— |
|
|
|
28,440 |
|
|
|
— |
|
|
|
28,440 |
|
| 2030 |
|
|
— |
|
|
|
1,661 |
|
|
|
— |
|
|
|
1,661 |
|
| 2031 |
|
|
100,872 |
|
|
|
24,256 |
|
|
|
— |
|
|
|
125,128 |
|
| 2032 |
|
|
234,093 |
|
|
|
23,938 |
|
|
|
— |
|
|
|
258,031 |
|
| 2033 |
|
|
273,689 |
|
|
|
40,808 |
|
|
|
— |
|
|
|
314,497 |
|
| 2034 |
|
|
280,382 |
|
|
|
22,511 |
|
|
|
— |
|
|
|
302,893 |
|
| 2035 |
|
|
305,950 |
|
|
|
55,939 |
|
|
|
— |
|
|
|
361,889 |
|
| 2036 |
|
|
— |
|
|
|
— |
|
|
|
— |
|
|
|
— |
|
| 2037 |
|
|
— |
|
|
|
— |
|
|
|
— |
|
|
|
— |
|
| 2038 |
|
|
— |
|
|
|
— |
|
|
|
— |
|
|
|
— |
|
| 2039 |
|
|
— |
|
|
|
— |
|
|
|
— |
|
|
|
— |
|
| No expiry |
|
|
— |
|
|
|
— |
|
|
|
688,844 |
|
|
|
688,844 |
|
|
|
|
|
|
|
|
|
|
|
|
|
|
|
|
|
|
|
|
$ |
1,289,688 |
|
|
$ |
197,553 |
|
|
$ |
690,091 |
|
|
$ |
2,177,332 |
|
|
|
|
|
|
|
|
|
|
|
|
|
|
|
|
|
|
Included in the table above is $615,412,000 (2014 - $434,051,000) of temporary differences related to loss carry forwards
where no future benefit is realized.
| H. |
Other comprehensive income |
Other comprehensive income included on the consolidated statements of
comprehensive income and the consolidated statements of changes in equity is presented net of income taxes. The following income tax amounts are included in each component of other comprehensive income:
For the year ended December 31, 2015
|
|
|
|
|
|
|
|
|
|
|
|
|
| |
|
Before tax |
|
|
Income tax
expense |
|
|
Net of tax |
|
| Remeasurements of defined benefit liability |
|
$ |
2,681 |
|
|
$ |
(666 |
) |
|
$ |
2,015 |
|
| Exchange differences on translation of foreign operations |
|
|
182,089 |
|
|
|
— |
|
|
|
182,089 |
|
| Unrealized gains on available-for-sale assets |
|
|
25 |
|
|
|
(3 |
) |
|
|
22 |
|
|
|
|
|
|
|
|
|
|
|
|
|
|
|
|
$ |
184,795 |
|
|
$ |
(669 |
) |
|
$ |
184,126 |
|
|
|
|
|
|
|
|
|
|
|
|
|
|
39
For the year ended December 31, 2014
|
|
|
|
|
|
|
|
|
|
|
|
|
| |
|
Before tax |
|
|
Income tax
recovery
(expense) |
|
|
Net of tax |
|
| Remeasurements of defined benefit liability |
|
$ |
(10,930 |
) |
|
$ |
2,978 |
|
|
$ |
(7,952 |
) |
| Exchange differences on translation of foreign operations |
|
|
58,890 |
|
|
|
— |
|
|
|
58,890 |
|
| Gains on derivatives designated as cash flow hedges transferred to net earnings - discontinued operation |
|
|
(400 |
) |
|
|
100 |
|
|
|
(300 |
) |
| Unrealized losses on available-for-sale assets |
|
|
(707 |
) |
|
|
94 |
|
|
|
(613 |
) |
| Losses on available-for-sale assets transferred to net earnings |
|
|
3 |
|
|
|
(1 |
) |
|
|
2 |
|
|
|
|
|
|
|
|
|
|
|
|
|
|
|
|
$ |
46,856 |
|
|
$ |
3,171 |
|
|
$ |
50,027 |
|
|
|
|
|
|
|
|
|
|
|
|
|
|
Per share amounts have been calculated based on the weighted average number of common
shares outstanding during the period. The weighted average number of paid shares outstanding in 2015 was 395,792,522 (2014 - 395,740,117).
|
|
|
|
|
|
|
|
|
| |
|
2015 |
|
|
2014 |
|
| Basic earnings per share computation |
|
|
|
|
|
|
|
|
| Net earnings attributable to equity holders |
|
$ |
65,286 |
|
|
$ |
185,234 |
|
| Weighted average common shares outstanding |
|
|
395,793 |
|
|
|
395,740 |
|
|
|
|
|
|
|
|
|
|
| Basic earnings per common share |
|
$ |
0.16 |
|
|
$ |
0.47 |
|
|
|
|
|
|
|
|
|
|
| Diluted earnings per share computation |
|
|
|
|
|
|
|
|
| Net earnings attributable to equity holders |
|
$ |
65,286 |
|
|
$ |
185,234 |
|
| Weighted average common shares outstanding |
|
|
395,793 |
|
|
|
395,740 |
|
| Dilutive effect of stock options |
|
|
— |
|
|
|
315 |
|
|
|
|
|
|
|
|
|
|
| Weighted average common shares outstanding, assuming dilution |
|
|
395,793 |
|
|
|
396,055 |
|
|
|
|
|
|
|
|
|
|
| Diluted earnings per common share |
|
$ |
0.16 |
|
|
$ |
0.47 |
|
|
|
|
|
|
|
|
|
|
| 24. |
Statements of cash flows |
|
|
|
|
|
|
|
|
|
| |
|
2015 |
|
|
2014 |
|
| Changes in non-cash working capital: |
|
|
|
|
|
|
|
|
| Accounts receivable |
|
$ |
216,266 |
|
|
$ |
(18,063 |
) |
| Inventories |
|
|
(238,549 |
) |
|
|
12,690 |
|
| Supplies and prepaid expenses |
|
|
(46,620 |
) |
|
|
50,522 |
|
| Accounts payable and accrued liabilities |
|
|
(12,225 |
) |
|
|
(141,905 |
) |
| Reclamation payments |
|
|
(11,807 |
) |
|
|
(15,425 |
) |
| Amortization of purchase price allocation |
|
|
16,005 |
|
|
|
23,339 |
|
| Other |
|
|
5,312 |
|
|
|
980 |
|
|
|
|
|
|
|
|
|
|
| Other operating items |
|
$ |
(71,618 |
) |
|
$ |
(87,862 |
) |
|
|
|
|
|
|
|
|
|
40
| 25. |
Share-based compensation plans |
The Company has the following equity-settled plans:
The Company has established a stock option plan under which options to purchase
common shares may be granted to employees of Cameco. Options granted under the stock option plan have an exercise price of not less than the closing price quoted on the Toronto Stock Exchange (TSX) for the common shares of Cameco on the trading day
prior to the date on which the option is granted. The options carry vesting periods of one to three years, and expire eight years from the date granted.
The aggregate number of common shares that may be issued pursuant to the Cameco stock option plan shall not exceed 43,017,198 of which 27,870,079 shares have
been issued.
Stock option transactions for the respective years were as follows:
|
|
|
|
|
|
|
|
|
| (Number of options) |
|
2015 |
|
|
2014 |
|
| Beginning of year |
|
|
8,353,006 |
|
|
|
9,817,443 |
|
| Options granted |
|
|
965,823 |
|
|
|
765,146 |
|
| Options forfeited |
|
|
(297,461 |
) |
|
|
(218,102 |
) |
| Options expired |
|
|
(518,130 |
) |
|
|
(1,696,189 |
) |
| Options exercised [note 18] |
|
|
— |
|
|
|
(315,292 |
) |
|
|
|
|
|
|
|
|
|
| End of year |
|
|
8,503,238 |
|
|
|
8,353,006 |
|
|
|
|
|
|
|
|
|
|
| Exercisable |
|
|
6,475,811 |
|
|
|
5,819,252 |
|
|
|
|
|
|
|
|
|
|
Weighted average exercise prices were as follows:
|
|
|
|
|
|
|
|
|
| |
|
2015 |
|
|
2014 |
|
| Beginning of year |
|
$ |
28.22 |
|
|
$ |
29.95 |
|
| Options granted |
|
|
19.30 |
|
|
|
26.81 |
|
| Options forfeited |
|
|
29.60 |
|
|
|
30.69 |
|
| Options expired |
|
|
46.48 |
|
|
|
38.93 |
|
| Options exercised |
|
|
— |
|
|
|
19.75 |
|
|
|
|
|
|
|
|
|
|
| End of year |
|
$ |
26.04 |
|
|
$ |
28.22 |
|
|
|
|
|
|
|
|
|
|
| Exercisable |
|
$ |
27.34 |
|
|
$ |
30.39 |
|
|
|
|
|
|
|
|
|
|
Total options outstanding and exercisable at December 31, 2015 were as follows:
|
|
|
|
|
|
|
|
|
|
|
|
|
|
|
|
|
|
|
|
|
|
|
| |
|
|
|
|
|
Options outstanding |
|
|
Options exercisable |
|
| Option price per share |
|
|
Number |
|
|
Weighted average
remaining life |
|
|
Weighted
average
exercisable
price |
|
|
Number |
|
|
Weighted
average
exercisable
price |
|
| $ |
19.30 - 34.99 |
|
|
|
6,761,748 |
|
|
|
4.6 |
|
|
$ |
22.63 |
|
|
|
4,734,321 |
|
|
$ |
22.94 |
|
| $ |
35.00 - 54.38 |
|
|
|
1,741,490 |
|
|
|
2.1 |
|
|
$ |
39.29 |
|
|
|
1,741,490 |
|
|
$ |
39.29 |
|
| |
|
|
|
|
|
|
|
|
|
|
|
|
|
|
|
|
|
|
|
|
|
|
|
|
|
|
|
8,503,238 |
|
|
|
|
|
|
|
|
|
|
|
6,475,811 |
|
|
|
|
|
|
|
|
|
|
|
|
|
|
|
|
|
|
|
|
|
|
|
|
|
|
|
|
The foregoing options have expiry dates ranging from March 3, 2016 to March 1, 2023.
41
Non-vested stock option transactions for the respective years were as follows:
|
|
|
|
|
|
|
|
|
| (Number of options) |
|
2015 |
|
|
2014 |
|
| Beginning of year |
|
|
2,533,754 |
|
|
|
3,537,814 |
|
| Options granted |
|
|
965,823 |
|
|
|
765,146 |
|
| Options forfeited |
|
|
(17,320 |
) |
|
|
(58,686 |
) |
| Options vested |
|
|
(1,454,830 |
) |
|
|
(1,710,520 |
) |
|
|
|
|
|
|
|
|
|
| End of year |
|
|
2,027,427 |
|
|
|
2,533,754 |
|
|
|
|
|
|
|
|
|
|
| B. |
Executive performance share unit (PSU) |
The Company has established a PSU plan whereby it provides each
plan participant an annual grant of PSUs in an amount determined by the board. Each PSU represents one phantom common share that entitles the participant to a payment of one Cameco common share purchased on the open market, or cash at the
board’s discretion, at the end of each three-year period if certain performance and vesting criteria have been met. The final value of the PSUs will be based on the value of Cameco common shares at the end of the three-year period and the
number of PSUs that ultimately vest. Vesting of PSUs at the end of the three-year period will be based on total shareholder return over the three years, Cameco’s ability to meet its annual operating targets and whether the participating
executive remains employed by Cameco at the end of the three-year vesting period. As of December 31, 2015, the total number of PSUs held by the participants, after adjusting for forfeitures on retirement, was 791,071 (2014 - 620,654).
| C. |
Restricted share unit (RSU) |
In 2011, the Company established an RSU plan whereby it provides each plan
participant an annual grant of RSUs in an amount determined by the board. In 2014, Cameco expanded the scope of the RSU plan to include additional employees of the Company. Each RSU represents one phantom common share that entitles the participant
to a payment of one Cameco common share purchased on the open market, or cash, at the board’s discretion. The RSUs carry vesting periods of one to three years, and the final value of the units will be based on the value of Cameco common shares
at the end of the vesting periods. As of December 31, 2015, the total number of RSUs held by the participants was 479,320 (2014 - 246,394).
| D. |
Employee share ownership plan |
Cameco also has an employee share ownership plan, whereby both employee
and Company contributions are used to purchase shares on the open market for employees. The Company’s contributions are expensed during the year of contribution. Under the plan, employees have the opportunity to participate in the program to a
maximum of 6% of eligible earnings each year with Cameco matching the first 3% of employee-paid shares by 50%. Cameco contributes $1,000 of shares annually to each employee that is enrolled in the plan. Shares purchased with Company contributions
and with dividends paid on such shares become unrestricted 12 months from the date on which such shares were purchased. At December 31, 2015, there were 3,659 participants in the plan (2014 - 3,704). The
total number of shares purchased in 2015 with Company contributions was 309,251 (2014 - 280,765). In 2015, the Company’s contributions totalled $5,295,000 (2014 - $5,240,000).
42
Cameco records compensation expense under its equity-settled plans with an offsetting credit to contributed
surplus, to reflect the estimated fair value of units granted to employees. During the year, the Company recognized the following expenses under these plans:
|
|
|
|
|
|
|
|
|
| |
|
2015 |
|
|
2014 |
|
| Stock option plan |
|
$ |
5,610 |
|
|
$ |
7,802 |
|
| Performance share unit plan |
|
|
6,574 |
|
|
|
5,199 |
|
| Restricted share unit plan |
|
|
4,669 |
|
|
|
2,807 |
|
| Employee share ownership plan |
|
|
5,295 |
|
|
|
5,240 |
|
|
|
|
|
|
|
|
|
|
| End of year |
|
$ |
22,148 |
|
|
$ |
21,048 |
|
|
|
|
|
|
|
|
|
|
Fair value measurement of equity-settled plans
The fair value of the units granted through the PSU plan was determined based on Monte Carlo simulation and the fair value of options granted under the stock
option plan was measured based on the Black-Scholes option-pricing model. The fair value of RSUs granted was determined based on their intrinsic value on the date of grant. Expected volatility was estimated by considering historic average share
price volatility.
The inputs used in the measurement of the fair values at grant date of the equity-settled share-based payment plans were as follows:
|
|
|
|
|
|
|
|
|
|
|
|
|
| |
|
Stock option plan |
|
|
PSU |
|
|
RSU |
|
| Number of options granted |
|
|
965,823 |
|
|
|
336,602 |
|
|
|
298,662 |
|
| Average strike price |
|
$ |
19.30 |
|
|
|
— |
|
|
$ |
18.89 |
|
| Expected dividend |
|
$ |
0.40 |
|
|
|
— |
|
|
|
— |
|
| Expected volatility |
|
|
32 |
% |
|
|
29 |
% |
|
|
— |
|
| Risk-free interest rate |
|
|
0.7 |
% |
|
|
0.5 |
% |
|
|
— |
|
| Expected life of option |
|
|
4.5 years |
|
|
|
3 years |
|
|
|
— |
|
| Expected forfeitures |
|
|
7 |
% |
|
|
5 |
% |
|
|
7 |
% |
| Weighted average grant date fair values |
|
$ |
4.30 |
|
|
$ |
18.88 |
|
|
$ |
18.89 |
|
In addition to these inputs, other features of the PSU grant were incorporated into the measurement of fair value. The market
condition based on total shareholder return was incorporated by utilizing a Monte Carlo simulation. The non-market criteria relating to realized selling prices and operating targets have been incorporated into the valuation at grant date by
reviewing prior history and corporate budgets.
The Company has the following cash-settled plans:
| A. |
Deferred share unit (DSU) |
Cameco offers a DSU plan to non-employee directors. A DSU is
a notional unit that reflects the market value of a single common share of Cameco. 60% of each director’s annual retainer is paid in DSUs. In addition, on an annual basis, directors can elect to receive 25%, 50%, 75% or 100% of the remaining
40% of their annual retainer and any additional fees in the form of DSUs. If a director meets their ownership requirements, the director may elect to take 25%, 50%, 75% or 100% of their annual retainer and any fees in cash, with the balance, if any,
to be paid in DSUs. Each DSU fully vests upon award. The DSUs will be redeemed for cash upon a director leaving the board. The redemption amount will be based upon the weighted average of the closing prices of the common shares of Cameco on the TSX
for the last 20 trading days prior to the redemption date multiplied by the number of DSUs held by the director. As of December 31, 2015, the total number of DSUs held by participating directors was 623,534 (2014 - 542,391).
43
Cameco makes annual grants of bonuses to eligible non-North American employees in
the form of phantom stock options. Employees receive the equivalent value of shares in cash when exercised. Options granted under the phantom stock option plan have an award value equal to the closing price quoted on the TSX for the common shares of
Cameco on the trading day prior to the date on which the option is granted. The options vest over three years and expire eight years from the date granted. As of December 31, 2015, the number of options held by participating employees was
290,833 (2014 - 223,053) with exercise prices ranging from $19.30 to $39.53 per share (2014 - $19.37 to $46.88) and a weighted average exercise price of $26.05 (2014 - $28.81).
Cameco has recognized the following expenses under its cash-settled plans:
|
|
|
|
|
|
|
|
|
| |
|
2015 |
|
|
2014 |
|
| Deferred share unit plan |
|
$ |
(1,088 |
) |
|
$ |
(1,493 |
) |
| Phantom stock option plan |
|
|
77 |
|
|
|
(123 |
) |
|
|
|
|
|
|
|
|
|
|
|
$ |
(1,011 |
) |
|
$ |
(1,616 |
) |
|
|
|
|
|
|
|
|
|
At December 31, 2015, a liability of $11,063,000 (2014 - $10,675,000) was included in the consolidated statements of
financial position to recognize accrued but unpaid expenses for cash-settled plans.
Fair value measurement of cash-settled plans
The fair value of the phantom stock option plan was measured based on the Black-Scholes option-pricing model. Expected volatility is estimated by considering
historic average share price volatility. The inputs used in the measurement of the fair values of the phantom stock option plan at the grant and reporting dates were as follows:
|
|
|
|
|
|
|
|
|
| |
|
Grant date
March 2, 2015 |
|
|
Reporting date
December 31, 2015 |
|
| Number of units |
|
|
80,980 |
|
|
|
290,833 |
|
| Average strike price |
|
$ |
19.30 |
|
|
$ |
26.05 |
|
| Expected dividend |
|
$ |
0.40 |
|
|
$ |
0.40 |
|
| Expected volatility |
|
|
33 |
% |
|
|
32 |
% |
| Risk-free interest rate |
|
|
0.8 |
% |
|
|
0.6 |
% |
| Expected life of option |
|
|
4.6 years |
|
|
|
3.4 years |
|
| Expected forfeitures |
|
|
7 |
% |
|
|
7 |
% |
| Weighted average measurement date fair values |
|
$ |
4.04 |
|
|
$ |
1.76 |
|
| 26. |
Pension and other post-retirement benefits |
Cameco maintains both defined benefit and defined
contribution plans providing pension benefits to substantially all of its employees. All regular and temporary employees participate in a registered defined contribution plan. This plan is registered under the Pension Benefits Standard Act, 1985. In
addition, all Canadian-based executives participate in a non-registered supplemental executive pension plan which is a defined benefit plan.
44
Under the supplemental executive pension plan (SEPP), Cameco provides a lump sum benefit equal to the present
value of a lifetime pension benefit based on the executive’s length of service and final average earnings. The plan provides for unreduced benefits to be paid at the normal retirement age of 65, however unreduced benefits could be paid if the
executive was at least 60 years of age and had 20 years of service at retirement. This program provides for a benefit determined by a formula based on earnings and service, reduced by the benefits payable under the registered base plan. Security is
provided for the SEPP benefits through a letter of credit held by the plan’s trustee. The face amount of the letter of credit is determined each year based on the wind-up liabilities of the supplemental plan, less any plan assets currently held
with the trustee. A valuation is required annually to determine the letter of credit amount. Benefits will continue to be paid from plan assets until the fund is exhausted, at which time Cameco will begin paying benefits from corporate assets.
Cameco also maintains non-pension post-retirement plans (“other benefit plans”) which are defined benefit plans that cover such benefits as group
life insurance and supplemental health and dental coverage to eligible employees and their dependants. The costs related to these plans are charged to earnings in the period during which the employment services are rendered. These plans are funded
by Cameco as benefit claims are made.
The board of directors of Cameco has final responsibility and accountability for the Cameco retirement programs.
The board is ultimately responsible for managing the programs to comply with applicable legislation, providing oversight over the general functions and setting certain policies.
Cameco expects to pay $1,665,000 in contributions and letter of credit fees to its defined benefit plans in 2016.
The post-retirement plans expose Cameco to actuarial risks, such as longevity risk, market risk, interest rate risk, liquidity risk and foreign currency risk.
The other benefit plans expose Cameco to risks of higher supplemental health and dental utilization than expected. However, the other benefit plans have limits on Cameco’s annual benefits payable.
The effective date of the most recent valuations for funding purposes on the registered defined benefit pension plans is January 1, 2015. The next
planned effective date for valuations is January 1, 2018.
45
Cameco has more than one defined benefit plan and has generally provided aggregated disclosures in respect of
these plans, on the basis that these plans are not exposed to materially different risks. Information relating to Cameco’s defined benefit plans is shown in the following table:
|
|
|
|
|
|
|
|
|
|
|
|
|
|
|
|
|
| |
|
Pension benefit plans |
|
|
Other benefit plans |
|
| |
|
2015 |
|
|
2014 |
|
|
2015 |
|
|
2014 |
|
| Fair value of plan assets, beginning of year |
|
$ |
10,877 |
|
|
$ |
15,402 |
|
|
$ |
— |
|
|
$ |
— |
|
| Interest income on plan assets |
|
|
406 |
|
|
|
717 |
|
|
|
— |
|
|
|
— |
|
| Return on assets excluding interest income |
|
|
1,960 |
|
|
|
188 |
|
|
|
— |
|
|
|
— |
|
| Employer contributions |
|
|
— |
|
|
|
10 |
|
|
|
— |
|
|
|
— |
|
| Benefits paid |
|
|
(2,581 |
) |
|
|
(5,420 |
) |
|
|
— |
|
|
|
— |
|
| Administrative costs paid |
|
|
(30 |
) |
|
|
(20 |
) |
|
|
— |
|
|
|
— |
|
|
|
|
|
|
|
|
|
|
|
|
|
|
|
|
|
|
| Fair value of plan assets, end of year |
|
$ |
10,632 |
|
|
$ |
10,877 |
|
|
$ |
— |
|
|
$ |
— |
|
|
|
|
|
|
|
|
|
|
|
|
|
|
|
|
|
|
| Defined benefit obligation, beginning of year |
|
$ |
52,440 |
|
|
$ |
44,386 |
|
|
$ |
20,107 |
|
|
$ |
16,947 |
|
| Current service cost |
|
|
1,744 |
|
|
|
2,203 |
|
|
|
1,195 |
|
|
|
960 |
|
| Interest cost |
|
|
1,627 |
|
|
|
1,940 |
|
|
|
813 |
|
|
|
825 |
|
| - demographic assumptions |
|
|
— |
|
|
|
971 |
|
|
|
38 |
|
|
|
106 |
|
| - financial assumptions |
|
|
(1,007 |
) |
|
|
5,992 |
|
|
|
(1,228 |
) |
|
|
2,037 |
|
| - experience adjustment |
|
|
(195 |
) |
|
|
2,192 |
|
|
|
1,671 |
|
|
|
(180 |
) |
| Past service cost |
|
|
— |
|
|
|
2,374 |
|
|
|
— |
|
|
|
— |
|
| Benefits paid |
|
|
(3,175 |
) |
|
|
(6,674 |
) |
|
|
(825 |
) |
|
|
(588 |
) |
| Foreign exchange |
|
|
1,562 |
|
|
|
(944 |
) |
|
|
— |
|
|
|
— |
|
|
|
|
|
|
|
|
|
|
|
|
|
|
|
|
|
|
| Defined benefit obligation, end of year |
|
$ |
52,996 |
|
|
$ |
52,440 |
|
|
$ |
21,771 |
|
|
$ |
20,107 |
|
|
|
|
|
|
|
|
|
|
|
|
|
|
|
|
|
|
| Defined benefit liability [note 16] |
|
$ |
(42,364 |
) |
|
$ |
(41,563 |
) |
|
$ |
(21,771 |
) |
|
$ |
(20,107 |
) |
|
|
|
|
|
|
|
|
|
|
|
|
|
|
|
|
|
The percentages of the total fair value of assets in the pension plans for each asset category at December 31 were as
follows:
|
|
|
|
|
|
|
|
|
| |
|
Pension benefit plans |
|
| |
|
2015 |
|
|
2014 |
|
| Asset category(a) |
|
|
|
|
|
|
|
|
| Canadian equity securities |
|
|
8 |
% |
|
|
7 |
% |
| Global equity securities |
|
|
16 |
% |
|
|
13 |
% |
| Canadian fixed income |
|
|
25 |
% |
|
|
21 |
% |
| Other(b) |
|
|
51 |
% |
|
|
59 |
% |
|
|
|
|
|
|
|
|
|
| Total |
|
|
100 |
% |
|
|
100 |
% |
|
|
|
|
|
|
|
|
|
| (a) |
The defined benefit plan assets contain no material amounts of related party assets at December 31, 2015 and 2014 respectively. |
| (b) |
Relates to the value of the refundable tax account held by the Canada Revenue Agency. The refundable total is approximately equal to half of the sum of the realized investment income plus employer contributions less
half of the benefits paid by the plan. |
46
The following represents the components of net pension and other benefit expense included primarily as part of
administration:
|
|
|
|
|
|
|
|
|
|
|
|
|
|
|
|
|
| |
|
Pension benefit plans |
|
|
Other benefit plans |
|
| |
|
2015 |
|
|
2014 |
|
|
2015 |
|
|
2014 |
|
| Current service cost |
|
$ |
1,744 |
|
|
$ |
2,203 |
|
|
$ |
1,195 |
|
|
$ |
960 |
|
| Net interest cost |
|
|
1,221 |
|
|
|
1,223 |
|
|
|
813 |
|
|
|
825 |
|
| Past service cost |
|
|
— |
|
|
|
2,374 |
|
|
|
— |
|
|
|
— |
|
| Administration cost |
|
|
30 |
|
|
|
20 |
|
|
|
— |
|
|
|
— |
|
|
|
|
|
|
|
|
|
|
|
|
|
|
|
|
|
|
| Defined benefit expense [note 19] |
|
|
2,995 |
|
|
|
5,820 |
|
|
|
2,008 |
|
|
|
1,785 |
|
| Defined contribution pension expense [note 19] |
|
|
17,961 |
|
|
|
17,274 |
|
|
|
— |
|
|
|
— |
|
|
|
|
|
|
|
|
|
|
|
|
|
|
|
|
|
|
| Net pension and other benefit expense |
|
$ |
20,956 |
|
|
$ |
23,094 |
|
|
$ |
2,008 |
|
|
$ |
1,785 |
|
|
|
|
|
|
|
|
|
|
|
|
|
|
|
|
|
|
The total amount of actuarial losses (gains) recognized in other comprehensive income is:
|
|
|
|
|
|
|
|
|
|
|
|
|
|
|
|
|
| |
|
Pension benefit plans |
|
|
Other benefit plans |
|
| |
|
2015 |
|
|
2014 |
|
|
2015 |
|
|
2014 |
|
| Actuarial loss (gain) |
|
$ |
(1,202 |
) |
|
$ |
9,155 |
|
|
$ |
481 |
|
|
$ |
1,963 |
|
| Return on plan assets excluding interest income |
|
|
(1,960 |
) |
|
|
(188 |
) |
|
|
— |
|
|
|
— |
|
|
|
|
|
|
|
|
|
|
|
|
|
|
|
|
|
|
|
|
$ |
(3,162 |
) |
|
$ |
8,967 |
|
|
$ |
481 |
|
|
$ |
1,963 |
|
|
|
|
|
|
|
|
|
|
|
|
|
|
|
|
|
|
The assumptions used to determine the Company’s defined benefit obligation and net pension and other benefit expense were
as follows at December 31 (expressed as weighted averages):
|
|
|
|
|
|
|
|
|
|
|
|
|
|
|
|
|
| |
|
Pension benefit plans |
|
|
Other benefit plans |
|
| |
|
2015 |
|
|
2014 |
|
|
2015 |
|
|
2014 |
|
| Discount rate - obligation |
|
|
3.9 |
% |
|
|
3.4 |
% |
|
|
4.0 |
% |
|
|
3.9 |
% |
| Discount rate - expense |
|
|
3.4 |
% |
|
|
4.4 |
% |
|
|
3.9 |
% |
|
|
4.8 |
% |
| Rate of compensation increase |
|
|
3.0 |
% |
|
|
3.0 |
% |
|
|
— |
|
|
|
— |
|
| Initial health care cost trend rate |
|
|
— |
|
|
|
— |
|
|
|
7.0 |
% |
|
|
7.0 |
% |
| Cost trend rate declines to |
|
|
— |
|
|
|
— |
|
|
|
5.0 |
% |
|
|
5.0 |
% |
| Year the rate reaches its final level |
|
|
— |
|
|
|
— |
|
|
|
2021 |
|
|
|
2018 |
|
| Dental care cost trend rate |
|
|
— |
|
|
|
— |
|
|
|
5.0 |
% |
|
|
5.0 |
% |
At December 31, 2015, the weighted average duration of the defined benefit obligation for the pension plans was 19.6
years (2014 - 20.3 years) and for the other benefit plans was 15.0 years (2014 - 14.0 years).
47
A 1% change at the reporting date to one of the relevant actuarial assumptions, holding other assumptions
constant, would have affected the defined benefit obligation by the following:
|
|
|
|
|
|
|
|
|
|
|
|
|
|
|
|
|
| |
|
Pension benefit plans |
|
|
Other benefit plans |
|
| |
|
Increase |
|
|
Decrease |
|
|
Increase |
|
|
Decrease |
|
| Discount rate |
|
$ |
(6,449 |
) |
|
$ |
8,412 |
|
|
$ |
(2,985 |
) |
|
$ |
3,791 |
|
| Rate of compensation increase |
|
|
2,553 |
|
|
|
(2,307 |
) |
|
|
n/a |
|
|
|
n/a |
|
A 1% change in any of the other assumptions would not have a significant impact on the defined benefit obligation.
The methods and assumptions used in preparing the sensitivity analyses are the same as the methods and assumptions used in determining the financial position
of Cameco’s plans as at December 31, 2015. The sensitivity analyses are determined by varying the sensitivity assumption and leaving all other assumptions unchanged. Therefore, the sensitivity analyses do not recognize any interdependence
in the assumptions. The methods and assumptions used in determining the above sensitivity are consistent with the methods and assumptions used in the previous year.
In addition, an increase of one year in the expected lifetime of plan participants in the pension benefit plans would increase the defined benefit obligation
by $1,207,000.
To measure the longevity risk for these plans, the mortality rates were reduced such that the average life expectancy for all members
increased by one year. The reduced mortality rates were subsequently used to re-measure the defined benefit obligation of the entire plan.
| 27. |
Financial instruments and related risk management |
Cameco is exposed in varying degrees to a variety of
risks from its use of financial instruments. Management and the board of directors, both separately and together, discuss the principal risks of our businesses. The board sets policies for the implementation of systems to manage, monitor and
mitigate identifiable risks. Cameco’s risk management objective in relation to these instruments is to protect and minimize volatility in cash flow. The types of risks Cameco is exposed to, the source of risk exposure and how each is managed is
outlined below.
Market risk
Market risk is the risk
that changes in market prices, such as commodity prices, foreign currency exchange rates and interest rates, will affect the Company’s earnings or the fair value of its financial instruments. Cameco engages in various business activities which
expose the Company to market risk. As part of its overall risk management strategy, Cameco uses derivatives to manage some of its exposures to market risk that result from these activities.
Derivative instruments may include financial and physical forward contracts. Such contracts may be used to establish a fixed price for a commodity, an
interest-bearing obligation or a cash flow denominated in a foreign currency. Market risks are monitored regularly against defined risk limits and tolerances.
Cameco’s actual exposure to these market risks is constantly changing as the Company’s portfolios of foreign currency, interest rate and commodity
contracts change.
The types of market risk exposure and the way in which such exposure is managed are as follows:
As a significant producer and supplier of uranium and nuclear fuel processing
services, Cameco bears significant exposure to changes in prices for these products. A substantial change in prices will affect the Company’s net earnings and operating cash flows. Prices for Cameco’s products are volatile and are
influenced by numerous factors beyond the Company’s control, such as supply and demand fundamentals and geopolitical events.
48
Cameco’s sales contracting strategy focuses on reducing the volatility in future earnings and cash flow,
while providing both protection against decreases in market price and retention of exposure to future market price increases. To mitigate the risks associated with the fluctuations in the market price for uranium products, Cameco seeks to maintain a
portfolio of uranium product sales contracts with a variety of delivery dates and pricing mechanisms that provide a degree of protection from pricing volatility.
Cameco does not hold any significant financial instruments that expose the Company to material commodity price risk as of the reporting date.
The relationship between the Canadian and US dollar affects financial results of
the uranium business as well as the fuel services business. Sales of uranium product, conversion and fuel manufacturing services are routinely denominated in US dollars while production costs are largely denominated in Canadian dollars.
Cameco attempts to provide some protection against exchange rate fluctuations by planned hedging activity designed to smooth volatility. To mitigate risks
associated with foreign currency, Cameco enters into forward sales and option contracts to establish a price for future delivery of the foreign currency. These foreign currency contracts are not designated as hedges and are recorded at fair value
with changes in fair value recognized in earnings. Cameco also has a natural hedge against US currency fluctuations because a portion of its annual cash outlays, including purchases of uranium and conversion services, is denominated in US dollars.
Cameco holds a number of financial instruments denominated in foreign currencies that expose the Company to foreign exchange risk. Cameco measures its
exposure to foreign exchange risk on financial instruments as the change in carrying values that would occur as a result of reasonably possible changes in foreign exchange rates, holding all other variables constant. As of the reporting date, the
Company has determined its pre-tax exposure to foreign currency exchange risk on financial instruments to be as follows based on a 5% weakening of the Canadian dollar:
|
|
|
|
|
|
|
|
|
|
|
| |
|
|
|
Carrying value |
|
|
|
|
| |
|
Currency |
|
(Cdn) |
|
|
Gain (loss) |
|
| Cash and cash equivalents |
|
USD |
|
|
123,089 |
|
|
|
6,154 |
|
| Accounts receivable |
|
USD |
|
|
212,433 |
|
|
|
10,622 |
|
| Long-term receivables, investments and other |
|
USD |
|
|
90,634 |
|
|
|
4,532 |
|
| Accounts payable and accrued liabilities |
|
USD |
|
|
(127,111 |
) |
|
|
(6,356 |
) |
| Net foreign currency derivatives |
|
USD |
|
|
(167,060 |
) |
|
|
(87,746 |
) |
A 5% strengthening of the Canadian dollar against the currencies above at December 31, 2015 would have had an equal but
opposite effect on the amounts shown above, assuming all other variables remained constant.
The Company has a strategy of minimizing its exposure to interest rate risk by
maintaining target levels of fixed and variable rate borrowings. The proportions of outstanding debt carrying fixed and variable interest rates are reviewed by senior management to ensure that these levels are within approved policy limits. At
December 31, 2015, the proportion of Cameco’s outstanding debt that carries fixed interest rates is 80% (2014 - 80%).
Cameco is exposed to
interest rate risk through its interest rate swap contracts whereby fixed rate payments on a notional amount of $300,000,000 of the Series D senior unsecured debentures were swapped for variable rate payments. The swaps terminate on
September 2, 2019. Under the terms of the swaps, Cameco makes interest payments based on the three-month Canada Dealer Offered Rate plus an average margin of 3.7% and receives fixed interest payments of 5.67%. At December 31, 2015, the
fair value of Cameco’s interest rate swap assets was $10,783,000 (2014 - $2,978,000).
49
Cameco is also exposed to interest rate risk on its loan facility with Inkai and on NUKEM’s multicurrency
revolving loan facility due to the variable nature of the interest rates contained in the terms therein.
Cameco measures its exposure to interest rate
risk as the change in cash flows that would occur as a result of reasonably possible changes in interest rates, holding all other variables constant. As of the reporting date, the Company has determined the impact on earnings of a 1% increase in
interest rate on variable rate financial instruments to be as follows:
|
|
|
|
|
| |
|
Gain (loss) |
|
| Interest rate contracts |
|
$ |
(3,029 |
) |
| Advances receivable from Inkai |
|
|
794 |
|
No amounts were drawn against NUKEM’s revolving loan facility as of December 31, 2015.
Counterparty credit risk
Counterparty credit risk is
associated with the ability of counterparties to satisfy their contractual obligations to Cameco, including both payment and performance. Cameco’s sales of uranium product, conversion and fuel manufacturing services expose the Company to the
risk of non-payment.
Cameco manages the risk of non-payment by monitoring the credit worthiness of its customers and seeking pre-payment or other forms
of payment security from customers with an unacceptable level of credit risk. To mitigate risks associated with certain financial assets, Cameco will hold positions with a variety of large creditworthy institutions.
The maximum exposure to credit risk, as represented by the carrying amount of the financial assets, at December 31 was:
|
|
|
|
|
|
|
|
|
| |
|
2015 |
|
|
2014 |
|
| Cash and cash equivalents |
|
$ |
458,604 |
|
|
$ |
566,583 |
|
| Accounts receivable |
|
|
240,626 |
|
|
|
435,479 |
|
| Advances receivable from Inkai [note 32] |
|
|
87,188 |
|
|
|
91,672 |
|
| Derivative assets |
|
|
11,143 |
|
|
|
3,889 |
|
| Other |
|
|
3,446 |
|
|
|
— |
|
At December 31, 2015, there were no significant concentrations of credit risk and no amounts were held as collateral.
Historically, Cameco has experienced minimal customer defaults and, as a result, considers the credit quality of its accounts receivable to be high. All accounts receivable at the reporting date are neither past due nor impaired.
Cameco has established programs for sales without recourse of trade accounts receivable to financial institutions. Through these programs, the Company
surrenders the control, risks and benefits associated with the accounts receivable sold. The amount of receivables sold is recorded as a sale of financial assets and the balances are removed from the consolidated statement of financial position at
the time of sale. The total amount of receivables sold under these programs and derecognized in accordance with IAS 39 during 2015 was $201,992,000 ($152,410,000 (USD)) (2014 - $145,477,000 ($130,295,000 (USD)).
Liquidity risk
Financial liquidity represents
Cameco’s ability to fund future operating activities and investments. Cameco ensures that there is sufficient capital in order to meet short-term business requirements, after taking into account cash flows from operations and the Company’s
holdings of cash and cash equivalents. The Company believes that these sources will be sufficient to cover the likely short-term and long-term cash requirements.
50
The table below outlines the Company’s available debt facilities at December 31, 2015:
|
|
|
|
|
|
|
|
|
|
|
|
|
| |
|
|
|
|
Outstanding and |
|
|
|
|
| |
|
Total amount |
|
|
committed |
|
|
Amount available |
|
| Unsecured revolving credit facility |
|
$ |
1,250,000 |
|
|
$ |
— |
|
|
$ |
1,250,000 |
|
| Letter of credit facilities |
|
|
1,490,809 |
|
|
|
1,384,061 |
|
|
|
106,748 |
|
| NUKEM multicurrency revolving loan facility |
|
|
112,718 |
|
|
|
562 |
|
|
|
112,156 |
|
The tables below present a maturity analysis of Cameco’s financial liabilities, including principal and interest, based
on the expected cash flows from the reporting date to the contractual maturity date:
|
|
|
|
|
|
|
|
|
|
|
|
|
|
|
|
|
|
|
|
|
|
|
|
|
| |
|
Carrying
amount |
|
|
Contractual
cash flows |
|
|
Due in
less than
1 year |
|
|
Due in 1-3
years |
|
|
Due in 3-5
years |
|
|
Due after 5
years |
|
| Accounts payable and accrued liabilities |
|
$ |
317,856 |
|
|
$ |
317,856 |
|
|
$ |
317,856 |
|
|
$ |
— |
|
|
$ |
— |
|
|
$ |
— |
|
| Dividends payable |
|
|
39,579 |
|
|
|
39,579 |
|
|
|
39,579 |
|
|
|
— |
|
|
|
— |
|
|
|
— |
|
| Long-term debt |
|
|
1,492,237 |
|
|
|
1,500,000 |
|
|
|
— |
|
|
|
— |
|
|
|
500,000 |
|
|
|
1,000,000 |
|
| Foreign currency contracts |
|
|
167,420 |
|
|
|
167,420 |
|
|
|
167,420 |
|
|
|
— |
|
|
|
— |
|
|
|
— |
|
| Other derivative liabilities |
|
|
816 |
|
|
|
816 |
|
|
|
816 |
|
|
|
— |
|
|
|
— |
|
|
|
— |
|
|
|
|
|
|
|
|
|
|
|
|
|
|
|
|
|
|
|
|
|
|
|
|
|
|
| Total contractual repayments |
|
$ |
2,017,908 |
|
|
$ |
2,025,671 |
|
|
$ |
525,671 |
|
|
$ |
— |
|
|
$ |
500,000 |
|
|
$ |
1,000,000 |
|
|
|
|
|
|
|
|
|
|
|
|
|
|
|
|
|
|
|
|
|
|
|
|
|
|
|
|
|
|
|
|
|
|
|
|
|
|
|
|
|
|
|
|
|
|
|
| |
|
Total |
|
|
Due in
less than
1 year |
|
|
Due in 1-3
years |
|
|
Due in 3-5
years |
|
|
Due after 5
years |
|
| Total interest payments on long-term debt |
|
$ |
544,380 |
|
|
$ |
69,390 |
|
|
$ |
138,780 |
|
|
$ |
110,430 |
|
|
$ |
225,780 |
|
|
|
|
|
|
|
|
|
|
|
|
|
|
|
|
|
|
|
|
|
|
Measurement of fair values
| A. |
Accounting classifications and fair values |
The following tables summarize the carrying amounts and
accounting classifications of Cameco’s financial instruments at the reporting date:
51
At December 31, 2015
|
|
|
|
|
|
|
|
|
|
|
|
|
|
|
|
|
|
|
|
|
| |
|
Fair value
through
profit or loss |
|
|
Loans and
receivables |
|
|
Available for
sale |
|
|
Other
financial
liabilities |
|
|
Total |
|
| Financial assets |
|
|
|
|
|
|
|
|
|
|
|
|
|
|
|
|
|
|
|
|
| Cash and cash equivalents |
|
$ |
— |
|
|
$ |
458,604 |
|
|
$ |
— |
|
|
$ |
— |
|
|
$ |
458,604 |
|
| Accounts receivable [note 7] |
|
|
— |
|
|
|
246,865 |
|
|
|
— |
|
|
|
— |
|
|
|
246,865 |
|
| Derivative assets [note 11] |
|
|
|
|
|
|
|
|
|
|
|
|
|
|
|
|
|
|
|
|
| Foreign currency contracts |
|
|
360 |
|
|
|
— |
|
|
|
— |
|
|
|
— |
|
|
|
360 |
|
| Interest rate contracts |
|
|
10,783 |
|
|
|
— |
|
|
|
— |
|
|
|
— |
|
|
|
10,783 |
|
| Investments in equity securities [note 11] |
|
|
— |
|
|
|
— |
|
|
|
938 |
|
|
|
— |
|
|
|
938 |
|
| Advances receivable from Inkai [note 32] |
|
|
— |
|
|
|
87,188 |
|
|
|
— |
|
|
|
— |
|
|
|
87,188 |
|
| Other |
|
|
— |
|
|
|
3,446 |
|
|
|
— |
|
|
|
— |
|
|
|
3,446 |
|
|
|
|
|
|
|
|
|
|
|
|
|
|
|
|
|
|
|
|
|
|
|
|
$ |
11,143 |
|
|
$ |
796,103 |
|
|
$ |
938 |
|
|
$ |
— |
|
|
$ |
808,184 |
|
|
|
|
|
|
|
|
|
|
|
|
|
|
|
|
|
|
|
|
|
|
| Financial liabilities |
|
|
|
|
|
|
|
|
|
|
|
|
|
|
|
|
|
|
|
|
| Accounts payable and accrued liabilities [note 13] |
|
$ |
— |
|
|
$ |
— |
|
|
$ |
— |
|
|
$ |
317,856 |
|
|
$ |
317,856 |
|
| Dividends payable |
|
|
— |
|
|
|
— |
|
|
|
— |
|
|
|
39,579 |
|
|
|
39,579 |
|
| Derivative liabilities [note 16] |
|
|
|
|
|
|
|
|
|
|
|
|
|
|
|
|
|
|
|
|
| Foreign currency contracts |
|
|
167,420 |
|
|
|
— |
|
|
|
— |
|
|
|
— |
|
|
|
167,420 |
|
| Other |
|
|
816 |
|
|
|
— |
|
|
|
— |
|
|
|
— |
|
|
|
816 |
|
| Long-term debt [note 15] |
|
|
— |
|
|
|
— |
|
|
|
— |
|
|
|
1,492,237 |
|
|
|
1,492,237 |
|
|
|
|
|
|
|
|
|
|
|
|
|
|
|
|
|
|
|
|
|
|
|
|
|
168,236 |
|
|
|
— |
|
|
|
— |
|
|
|
1,849,672 |
|
|
|
2,017,908 |
|
|
|
|
|
|
|
|
|
|
|
|
|
|
|
|
|
|
|
|
|
|
| Net |
|
$ |
(157,093 |
) |
|
$ |
796,103 |
|
|
$ |
938 |
|
|
$ |
(1,849,672 |
) |
|
$ |
(1,209,724 |
) |
|
|
|
|
|
|
|
|
|
|
|
|
|
|
|
|
|
|
|
|
|
At December 31, 2014
|
|
|
|
|
|
|
|
|
|
|
|
|
|
|
|
|
|
|
|
|
| |
|
Fair value
through
profit or loss |
|
|
Loans and
receivables |
|
|
Available for
sale |
|
|
Other
financial
liabilities |
|
|
Total |
|
| Financial assets |
|
|
|
|
|
|
|
|
|
|
|
|
|
|
|
|
|
|
|
|
| Cash and cash equivalents |
|
$ |
— |
|
|
$ |
566,583 |
|
|
$ |
— |
|
|
$ |
— |
|
|
$ |
566,583 |
|
| Accounts receivable [note 7] |
|
|
— |
|
|
|
455,002 |
|
|
|
— |
|
|
|
— |
|
|
|
455,002 |
|
| Derivative assets [note 11] |
|
|
|
|
|
|
|
|
|
|
|
|
|
|
|
|
|
|
|
|
| Foreign currency contracts |
|
|
911 |
|
|
|
— |
|
|
|
— |
|
|
|
— |
|
|
|
911 |
|
| Interest rate contracts |
|
|
2,978 |
|
|
|
— |
|
|
|
— |
|
|
|
— |
|
|
|
2,978 |
|
| Investments in equity securities [note 11] |
|
|
— |
|
|
|
— |
|
|
|
6,601 |
|
|
|
— |
|
|
|
6,601 |
|
| Advances receivable from Inkai [note 32] |
|
|
— |
|
|
|
91,672 |
|
|
|
— |
|
|
|
— |
|
|
|
91,672 |
|
|
|
|
|
|
|
|
|
|
|
|
|
|
|
|
|
|
|
|
|
|
|
|
$ |
3,889 |
|
|
$ |
1,113,257 |
|
|
$ |
6,601 |
|
|
$ |
— |
|
|
$ |
1,123,747 |
|
|
|
|
|
|
|
|
|
|
|
|
|
|
|
|
|
|
|
|
|
|
| Financial liabilities |
|
|
|
|
|
|
|
|
|
|
|
|
|
|
|
|
|
|
|
|
| Accounts payable and accrued liabilities [note 13] |
|
$ |
— |
|
|
$ |
— |
|
|
$ |
— |
|
|
$ |
316,258 |
|
|
$ |
316,258 |
|
| Dividends payable |
|
|
— |
|
|
|
— |
|
|
|
— |
|
|
|
39,579 |
|
|
|
39,579 |
|
| Derivative liabilities [note 16] |
|
|
|
|
|
|
|
|
|
|
|
|
|
|
|
|
|
|
|
|
| Foreign currency contracts |
|
|
67,916 |
|
|
|
— |
|
|
|
— |
|
|
|
— |
|
|
|
67,916 |
|
| Long-term debt [note 15] |
|
|
— |
|
|
|
— |
|
|
|
— |
|
|
|
1,491,198 |
|
|
|
1,491,198 |
|
|
|
|
|
|
|
|
|
|
|
|
|
|
|
|
|
|
|
|
|
|
|
|
|
67,916 |
|
|
|
— |
|
|
|
— |
|
|
|
1,847,035 |
|
|
|
1,914,951 |
|
|
|
|
|
|
|
|
|
|
|
|
|
|
|
|
|
|
|
|
|
|
| Net |
|
$ |
(64,027 |
) |
|
$ |
1,113,257 |
|
|
$ |
6,601 |
|
|
$ |
(1,847,035 |
) |
|
$ |
(791,204 |
) |
|
|
|
|
|
|
|
|
|
|
|
|
|
|
|
|
|
|
|
|
|
Cameco does not have any financial instruments classified as held-for-trading, or held-to-maturity as of the reporting date.
52
The following tables summarize the carrying amounts and fair values of Cameco’s financial instruments that
are measured at fair value, including their levels in the fair value hierarchy:
As at December 31, 2015
|
|
|
|
|
|
|
|
|
|
|
|
|
|
|
|
|
| |
|
|
|
|
Fair value |
|
| |
|
Carrying value |
|
|
Level 1 |
|
|
Level 2 |
|
|
Total |
|
| Derivative assets [note 11] |
|
|
|
|
|
|
|
|
|
|
|
|
|
|
|
|
| Foreign currency contracts |
|
$ |
360 |
|
|
$ |
— |
|
|
$ |
360 |
|
|
$ |
360 |
|
| Interest rate contracts |
|
|
10,783 |
|
|
|
— |
|
|
|
10,783 |
|
|
|
10,783 |
|
| Investments in equity securities [note 11] |
|
|
938 |
|
|
|
938 |
|
|
|
— |
|
|
|
938 |
|
| Derivative liabilities [note 16] |
|
|
|
|
|
|
|
|
|
|
|
|
|
|
|
|
| Foreign currency contracts |
|
|
(167,420 |
) |
|
|
— |
|
|
|
(167,420 |
) |
|
|
(167,420 |
) |
| Other |
|
|
(816 |
) |
|
|
— |
|
|
|
(816 |
) |
|
|
(816 |
) |
| Long-term debt [note 15] |
|
|
(1,492,237 |
) |
|
|
— |
|
|
|
(1,786,567 |
) |
|
|
(1,786,567 |
) |
|
|
|
|
|
|
|
|
|
|
|
|
|
|
|
|
|
| Net |
|
$ |
(1,648,392 |
) |
|
$ |
938 |
|
|
$ |
(1,943,660 |
) |
|
$ |
(1,942,722 |
) |
|
|
|
|
|
|
|
|
|
|
|
|
|
|
|
|
|
As at December 31, 2014
|
|
|
|
|
|
|
|
|
|
|
|
|
|
|
|
|
| |
|
|
|
|
Fair value |
|
| |
|
Carrying value |
|
|
Level 1 |
|
|
Level 2 |
|
|
Total |
|
| Derivative assets [note 11] |
|
|
|
|
|
|
|
|
|
|
|
|
|
|
|
|
| Foreign currency contracts |
|
$ |
911 |
|
|
$ |
— |
|
|
$ |
911 |
|
|
$ |
911 |
|
| Interest rate contracts |
|
|
2,978 |
|
|
|
— |
|
|
|
2,978 |
|
|
|
2,978 |
|
| Investments in equity securities [note 11] |
|
|
6,601 |
|
|
|
6,601 |
|
|
|
— |
|
|
|
6,601 |
|
| Derivative liabilities [note 16] |
|
|
|
|
|
|
|
|
|
|
|
|
|
|
|
|
| Foreign currency contracts |
|
|
(67,916 |
) |
|
|
— |
|
|
|
(67,916 |
) |
|
|
(67,916 |
) |
| Long-term debt [note 15] |
|
|
(1,491,198 |
) |
|
|
— |
|
|
|
(1,765,178 |
) |
|
|
(1,765,178 |
) |
|
|
|
|
|
|
|
|
|
|
|
|
|
|
|
|
|
| Net |
|
$ |
(1,548,624 |
) |
|
$ |
6,601 |
|
|
$ |
(1,829,205 |
) |
|
$ |
(1,822,604 |
) |
|
|
|
|
|
|
|
|
|
|
|
|
|
|
|
|
|
The preceding tables exclude fair value information for financial instruments whose carrying amounts are a reasonable
approximation of fair value.
There were no transfers between level 1 and level 2 during the period. Cameco does not have any financial instruments that
are classified as level 3 as of the reporting date.
| B. |
Financial instruments measured at fair value |
Cameco measures its derivative financial instruments,
material investments in equity securities and long-term debt at fair value. Investments in publicly held equity securities are classified as a recurring level 1 fair value measurement while derivative financial instruments and long-term debt are
classified as a recurring level 2 fair value measurement.
The fair value of investments in equity securities is determined using quoted share prices
observed in the principal market for the securities as of the reporting date. The fair value of Cameco’s long-term debt is determined using quoted market yields as of the reporting date, which ranged from 0.6% to 2.2% (2014 - 1.2% to 2.3%).
Foreign currency derivatives consist of foreign currency forward contracts, options and swaps. The fair value of foreign currency options is measured
based on the Black Scholes option-pricing model. The fair value of foreign currency forward contracts and swaps is measured using a market approach, based on the difference between contracted foreign exchange rates and quoted forward exchange rates
as of the reporting date.
53
Interest rate derivatives consist of interest rate swap contracts. The fair value of interest rate swaps is
determined by discounting expected future cash flows from the contracts. The future cash flows are determined by measuring the difference between fixed interest payments to be received and floating interest payments to be made to the counterparty
based on Canada Dealer Offer Rate forward interest rate curves.
Where applicable, the fair value of the derivatives reflects the credit risk of the
instrument and includes adjustments to take into account the credit risk of the Company and counterparty. These adjustments are based on credit ratings and yield curves observed in active markets at the reporting date.
| C. |
Financial instruments not measured at fair value |
The carrying value of Cameco’s cash and cash
equivalents, accounts receivable and accounts payable and accrued liabilities approximates its fair value as a result of the short-term nature of the instruments.
Derivatives
The following table summarizes the fair
value of derivatives and classification on the consolidated statements of financial position:
|
|
|
|
|
|
|
|
|
| |
|
2015 |
|
|
2014 |
|
| Non-hedge derivatives: |
|
|
|
|
|
|
|
|
| Foreign currency contracts |
|
$ |
(167,060 |
) |
|
$ |
(67,005 |
) |
| Interest rate contracts |
|
|
10,783 |
|
|
|
2,978 |
|
| Other |
|
|
(816 |
) |
|
|
— |
|
|
|
|
|
|
|
|
|
|
| Net |
|
$ |
(157,093 |
) |
|
$ |
(64,027 |
) |
|
|
|
|
|
|
|
|
|
| Classification: |
|
|
|
|
|
|
|
|
| Current portion of long-term receivables, investments and other [note 11] |
|
$ |
3,823 |
|
|
$ |
500 |
|
| Long-term receivables, investments and other [note 11] |
|
|
7,320 |
|
|
|
3,389 |
|
| Current portion of other liabilities [note 16] |
|
|
(168,236 |
) |
|
|
(53,873 |
) |
| Other liabilities [note 16] |
|
|
— |
|
|
|
(14,043 |
) |
|
|
|
|
|
|
|
|
|
| Net |
|
$ |
(157,093 |
) |
|
$ |
(64,027 |
) |
|
|
|
|
|
|
|
|
|
The following table summarizes the different components of the losses on derivatives included in net earnings:
|
|
|
|
|
|
|
|
|
| |
|
| |
|
2015 |
|
|
2014 |
|
| Non-hedge derivatives: |
|
|
|
|
|
|
|
|
| Foreign currency contracts |
|
$ |
(292,039 |
) |
|
$ |
(126,069 |
) |
| Interest rate contracts |
|
|
10,708 |
|
|
|
4,893 |
|
| Other |
|
|
721 |
|
|
|
16 |
|
|
|
|
|
|
|
|
|
|
| Net |
|
$ |
(280,610 |
) |
|
$ |
(121,160 |
) |
|
|
|
|
|
|
|
|
|
Cameco’s capital structure reflects our vision and the environment in which we
operate. We seek growth through development and expansion of existing assets by acquisition. Our capital resources are managed to support achievement of our goals. The overall objectives for managing capital in 2015 remained unchanged from the prior
comparative period.
Cameco’s management considers its capital structure to consist of bank overdrafts, long-term debt, short-term debt (net of cash
and cash equivalents and short-term investments), non-controlling interest and shareholders’ equity.
54
The capital structure at December 31 was as follows:
|
|
|
|
|
|
|
|
|
| |
|
2015 |
|
|
2014 |
|
| Long-term debt [note 15] |
|
$ |
1,492,237 |
|
|
$ |
1,491,198 |
|
| Cash and cash equivalents |
|
|
(458,604 |
) |
|
|
(566,583 |
) |
|
|
|
|
|
|
|
|
|
| Net debt |
|
|
1,033,633 |
|
|
|
924,615 |
|
|
|
|
|
|
|
|
|
|
| Non-controlling interest |
|
|
(1,741 |
) |
|
|
160 |
|
| Shareholders’ equity |
|
|
5,547,020 |
|
|
|
5,443,644 |
|
|
|
|
|
|
|
|
|
|
| Total equity |
|
|
5,545,279 |
|
|
|
5,443,804 |
|
|
|
|
|
|
|
|
|
|
| Total capital |
|
$ |
6,578,912 |
|
|
$ |
6,368,419 |
|
|
|
|
|
|
|
|
|
|
Cameco is bound by certain covenants in its general credit facilities. These covenants place restrictions on total debt,
including guarantees and set minimum levels for net worth. As of December 31, 2015, Cameco met these requirements.
The terms of NUKEM’s
revolving loan facility contain a financial covenant that places restrictions on total debt and working capital balances. The facility also requires Cameco, as guarantor, to maintain a minimum credit rating. As of December 31, 2015 the Company
is in compliance with all requirements under this facility.
| 29. |
Segmented information |
Cameco has three reportable segments: uranium, fuel services and NUKEM. The
uranium segment involves the exploration for, mining, milling, purchase and sale of uranium concentrate. The fuel services segment involves the refining, conversion and fabrication of uranium concentrate and the purchase and sale of conversion
services. The NUKEM segment acts as a market intermediary between uranium producers and nuclear-electric utilities.
Cameco’s reportable segments are
strategic business units with different products, processes and marketing strategies.
Accounting policies used in each segment are consistent with the
policies outlined in the summary of significant accounting policies. Segment revenues, expenses and results include transactions between segments incurred in the ordinary course of business. These transactions are priced on an arm’s length
basis, are eliminated on consolidation and are reflected in the “other” column.
55
| A. |
Business segments - 2015 |
For the year ended December 31, 2015
|
|
|
|
|
|
|
|
|
|
|
|
|
|
|
|
|
|
|
|
|
| |
|
Uranium |
|
|
Fuel
services |
|
|
NUKEM |
|
|
Other |
|
|
Total |
|
| Revenue |
|
$ |
1,866,198 |
|
|
$ |
318,999 |
|
|
$ |
553,665 |
|
|
$ |
15,516 |
|
|
$ |
2,754,378 |
|
|
|
|
|
|
|
| Expenses |
|
|
|
|
|
|
|
|
|
|
|
|
|
|
|
|
|
|
|
|
| Cost of products and services sold |
|
|
989,239 |
|
|
|
226,854 |
|
|
|
516,880 |
|
|
|
11,842 |
|
|
|
1,744,815 |
|
| Depreciation and amortization |
|
|
269,084 |
|
|
|
30,670 |
|
|
|
(5,103 |
) |
|
|
17,867 |
|
|
|
312,518 |
|
|
|
|
|
|
|
|
|
|
|
|
|
|
|
|
|
|
|
|
|
|
| Cost of sales |
|
|
1,258,323 |
|
|
|
257,524 |
|
|
|
511,777 |
|
|
|
29,709 |
|
|
|
2,057,333 |
|
|
|
|
|
|
|
|
|
|
|
|
|
|
|
|
|
|
|
|
|
|
| Gross profit (loss) |
|
|
607,875 |
|
|
|
61,475 |
|
|
|
41,888 |
|
|
|
(14,193 |
) |
|
|
697,045 |
|
|
|
|
|
|
|
| Administration |
|
|
— |
|
|
|
— |
|
|
|
18,130 |
|
|
|
168,680 |
|
|
|
186,810 |
|
| Impairment charges |
|
|
215,488 |
|
|
|
— |
|
|
|
— |
|
|
|
— |
|
|
|
215,488 |
|
| Exploration |
|
|
40,259 |
|
|
|
— |
|
|
|
— |
|
|
|
— |
|
|
|
40,259 |
|
| Research and development |
|
|
— |
|
|
|
— |
|
|
|
— |
|
|
|
6,587 |
|
|
|
6,587 |
|
| Loss on disposal of assets |
|
|
1,753 |
|
|
|
564 |
|
|
|
9 |
|
|
|
— |
|
|
|
2,326 |
|
| Finance costs |
|
|
— |
|
|
|
— |
|
|
|
4,593 |
|
|
|
99,022 |
|
|
|
103,615 |
|
| Loss (gain) on derivatives |
|
|
— |
|
|
|
— |
|
|
|
(587 |
) |
|
|
281,197 |
|
|
|
280,610 |
|
| Finance income |
|
|
— |
|
|
|
— |
|
|
|
(3 |
) |
|
|
(5,414 |
) |
|
|
(5,417 |
) |
| Share of loss from equity-accounted investees |
|
|
758 |
|
|
|
— |
|
|
|
— |
|
|
|
— |
|
|
|
758 |
|
| Other expense (income) |
|
|
4,600 |
|
|
|
— |
|
|
|
1,899 |
|
|
|
(61,222 |
) |
|
|
(54,723 |
) |
|
|
|
|
|
|
|
|
|
|
|
|
|
|
|
|
|
|
|
|
|
| Earnings (loss) before income taxes |
|
|
345,017 |
|
|
|
60,911 |
|
|
|
17,847 |
|
|
|
(503,043 |
) |
|
|
(79,268 |
) |
| Income tax recovery |
|
|
|
|
|
|
|
|
|
|
|
|
|
|
|
|
|
|
(142,630 |
) |
|
|
|
|
|
|
|
|
|
|
|
|
|
|
|
|
|
|
|
|
|
| Net earnings |
|
|
|
|
|
|
|
|
|
|
|
|
|
|
|
|
|
|
63,362 |
|
|
|
|
|
|
|
|
|
|
|
|
|
|
|
|
|
|
|
|
|
|
| Capital expenditures for the year |
|
$ |
344,610 |
|
|
$ |
13,952 |
|
|
$ |
— |
|
|
$ |
— |
|
|
$ |
358,562 |
|
|
|
|
|
|
|
|
|
|
|
|
|
|
|
|
|
|
|
|
|
|
56
For the year ended December 31, 2014
|
|
|
|
|
|
|
|
|
|
|
|
|
|
|
|
|
|
|
|
|
| |
|
Uranium |
|
|
Fuel
services |
|
|
NUKEM |
|
|
Other |
|
|
Total |
|
| Revenue |
|
$ |
1,777,180 |
|
|
$ |
306,235 |
|
|
$ |
349,245 |
|
|
$ |
(35,128 |
) |
|
$ |
2,397,532 |
|
|
|
|
|
|
|
| Expenses |
|
|
|
|
|
|
|
|
|
|
|
|
|
|
|
|
|
|
|
|
| Cost of products and services sold |
|
|
902,813 |
|
|
|
237,872 |
|
|
|
319,369 |
|
|
|
(39,286 |
) |
|
|
1,420,768 |
|
| Depreciation and amortization |
|
|
272,632 |
|
|
|
30,038 |
|
|
|
7,584 |
|
|
|
28,729 |
|
|
|
338,983 |
|
|
|
|
|
|
|
|
|
|
|
|
|
|
|
|
|
|
|
|
|
|
| Cost of sales |
|
|
1,175,445 |
|
|
|
267,910 |
|
|
|
326,953 |
|
|
|
(10,557 |
) |
|
|
1,759,751 |
|
|
|
|
|
|
|
|
|
|
|
|
|
|
|
|
|
|
|
|
|
|
| Gross profit (loss) |
|
|
601,735 |
|
|
|
38,325 |
|
|
|
22,292 |
|
|
|
(24,571 |
) |
|
|
637,781 |
|
|
|
|
|
|
|
| Administration |
|
|
— |
|
|
|
— |
|
|
|
16,591 |
|
|
|
159,794 |
|
|
|
176,385 |
|
| Impairment charges |
|
|
143,078 |
|
|
|
183,615 |
|
|
|
— |
|
|
|
— |
|
|
|
326,693 |
|
| Exploration |
|
|
46,565 |
|
|
|
— |
|
|
|
— |
|
|
|
— |
|
|
|
46,565 |
|
| Research and development |
|
|
— |
|
|
|
— |
|
|
|
— |
|
|
|
5,044 |
|
|
|
5,044 |
|
| Gain (loss) on disposal of assets |
|
|
32,959 |
|
|
|
11,808 |
|
|
|
(5 |
) |
|
|
— |
|
|
|
44,762 |
|
| Finance costs |
|
|
— |
|
|
|
— |
|
|
|
4,428 |
|
|
|
107,425 |
|
|
|
111,853 |
|
| Loss on derivatives |
|
|
— |
|
|
|
— |
|
|
|
1,799 |
|
|
|
119,361 |
|
|
|
121,160 |
|
| Finance income |
|
|
— |
|
|
|
— |
|
|
|
(14 |
) |
|
|
(7,388 |
) |
|
|
(7,402 |
) |
| Share of loss from equity-accounted investees |
|
|
3,874 |
|
|
|
13,267 |
|
|
|
— |
|
|
|
— |
|
|
|
17,141 |
|
| Other expense (income) |
|
|
(68,626 |
) |
|
|
18,035 |
|
|
|
(659 |
) |
|
|
(34,072 |
) |
|
|
(85,322 |
) |
|
|
|
|
|
|
|
|
|
|
|
|
|
|
|
|
|
|
|
|
|
| Earnings (loss) before income taxes |
|
|
443,885 |
|
|
|
(188,400 |
) |
|
|
152 |
|
|
|
(374,735 |
) |
|
|
(119,098 |
) |
| Income tax recovery |
|
|
|
|
|
|
|
|
|
|
|
|
|
|
|
|
|
|
(175,268 |
) |
|
|
|
|
|
|
|
|
|
|
|
|
|
|
|
|
|
|
|
|
|
| Net earnings from continuing operations |
|
|
|
|
|
|
|
|
|
|
|
|
|
|
|
|
|
|
56,170 |
|
|
|
|
|
|
|
|
|
|
|
|
|
|
|
|
|
|
|
|
|
|
| Capital expenditures for the year |
|
$ |
466,332 |
|
|
$ |
13,776 |
|
|
$ |
— |
|
|
$ |
— |
|
|
$ |
480,108 |
|
|
|
|
|
|
|
|
|
|
|
|
|
|
|
|
|
|
|
|
|
|
Revenue is attributed to the geographic location based on the location of the
entity providing the services. The Company’s revenue from external customers is as follows:
|
|
|
|
|
|
|
|
|
| |
|
2015 |
|
|
2014 |
|
| United States |
|
$ |
2,135,977 |
|
|
$ |
1,914,583 |
|
| Canada |
|
|
341,568 |
|
|
|
308,327 |
|
| Germany |
|
|
276,833 |
|
|
|
174,622 |
|
|
|
|
|
|
|
|
|
|
|
|
$ |
2,754,378 |
|
|
$ |
2,397,532 |
|
|
|
|
|
|
|
|
|
|
The Company’s non-current assets, excluding deferred tax assets and financial instruments, by geographic location are as
follows:
|
|
|
|
|
|
|
|
|
| |
|
2015 |
|
|
2014 |
|
| Canada |
|
$ |
3,867,740 |
|
|
$ |
4,048,009 |
|
| Australia |
|
|
684,261 |
|
|
|
643,986 |
|
| United States |
|
|
429,815 |
|
|
|
409,495 |
|
| Other |
|
|
327,847 |
|
|
|
274,527 |
|
| Germany |
|
|
135,627 |
|
|
|
116,106 |
|
|
|
|
|
|
|
|
|
|
|
|
$ |
5,445,290 |
|
|
$ |
5,492,123 |
|
|
|
|
|
|
|
|
|
|
57
Cameco relies on a small number of customers to purchase a significant portion of its
uranium concentrates and uranium conversion services. During 2015, revenues from one customer of Cameco’s uranium, fuel services and NUKEM segments represented approximately $320,312,000 (2014 - $281,485,000), approximately 12% (2014 - 12%) of
Cameco’s total revenues from these segments. As customers are relatively few in number, accounts receivable from any individual customer may periodically exceed 10% of accounts receivable depending on delivery schedule.
The following are the principal subsidiaries and associates of the Company:
|
|
|
|
|
|
|
|
|
|
|
| |
|
Principal place |
|
Ownership interest |
|
| |
|
of business |
|
2015 |
|
|
2014 |
|
| Subsidiaries: |
|
|
|
|
|
|
|
|
|
|
| Cameco Fuel Manufacturing Inc. |
|
Canada |
|
|
100 |
% |
|
|
100 |
% |
| Cameco Inc. |
|
US |
|
|
100 |
% |
|
|
100 |
% |
| Power Resources, Inc. |
|
US |
|
|
100 |
% |
|
|
100 |
% |
| Crow Butte Resources, Inc. |
|
US |
|
|
100 |
% |
|
|
100 |
% |
| NUKEM Investments GmbH |
|
Germany |
|
|
100 |
% |
|
|
100 |
% |
| Cameco Australia Pty. Ltd. |
|
Australia |
|
|
100 |
% |
|
|
100 |
% |
| Cameco Europe Ltd. |
|
Switzerland |
|
|
100 |
% |
|
|
100 |
% |
|
|
|
|
| Associates |
|
|
|
|
|
|
|
|
|
|
| GE-Hitachi Global Laser Enrichment LLC |
|
US |
|
|
24.00 |
% |
|
|
24.00 |
% |
| UEX Corporation |
|
Canada |
|
|
20.33 |
% |
|
|
21.28 |
% |
Cameco conducts a portion of its exploration, development, mining and milling
activities through joint operations located around the world. Operations are governed by agreements that provide for joint control of the strategic operating, investing and financing activities among the partners. These agreements were considered in
the determination of joint control. Cameco’s significant Canadian uranium joint operation interests are McArthur River, Key Lake and Cigar Lake. The Canadian uranium joint operations allocate uranium production to each joint operation
participant and the joint operation participant derives revenue directly from the sale of such product. The participants in the Inkai joint operation purchase uranium from Inkai and, in turn, derive revenue directly from the sale of such product to
third-party customers. Mining and milling expenses incurred by joint operations are included in the cost of inventory.
58
Cameco reflects its proportionate interest in these assets and liabilities as follows:
|
|
|
|
|
|
|
|
|
|
|
|
|
|
|
| |
|
Principal place
of business |
|
Ownership |
|
|
2015 |
|
|
2014 |
|
| Total assets |
|
|
|
|
|
|
|
|
|
|
|
|
|
|
| McArthur River |
|
Canada |
|
|
69.81 |
% |
|
$ |
1,107,017 |
|
|
$ |
1,074,501 |
|
| Key Lake |
|
Canada |
|
|
83.33 |
% |
|
|
629,075 |
|
|
|
645,186 |
|
| Cigar Lake |
|
Canada |
|
|
50.03 |
% |
|
|
1,674,805 |
|
|
|
1,617,101 |
|
| Inkai |
|
Kazakhstan |
|
|
60.00 |
% |
|
|
436,611 |
|
|
|
359,554 |
|
|
|
|
|
|
|
|
|
|
|
|
|
|
|
|
|
|
|
|
|
|
|
|
$ |
3,847,508 |
|
|
$ |
3,696,342 |
|
|
|
|
|
|
|
|
|
|
|
|
|
|
|
|
| Total liabilities |
|
|
|
|
|
|
|
|
|
|
|
|
|
|
| McArthur River |
|
|
|
|
69.81 |
% |
|
$ |
49,986 |
|
|
$ |
54,170 |
|
| Key Lake |
|
|
|
|
83.33 |
% |
|
|
174,654 |
|
|
|
181,443 |
|
| Cigar Lake |
|
|
|
|
50.03 |
% |
|
|
39,201 |
|
|
|
52,580 |
|
| Inkai |
|
|
|
|
60.00 |
% |
|
|
176,163 |
|
|
|
171,198 |
|
|
|
|
|
|
|
|
|
|
|
|
|
|
|
|
|
|
|
|
|
|
|
|
$ |
440,004 |
|
|
$ |
459,391 |
|
|
|
|
|
|
|
|
|
|
|
|
|
|
|
|
Through unsecured shareholder loans, Cameco has agreed to fund the development of the Inkai project. Cameco eliminates the
loan balances recorded by Inkai and records advances receivable (notes 11 and 32) representing its 40% share.
The shares of Cameco are widely held and no shareholder, resident in Canada, is allowed
to own more than 25% of the Company’s outstanding common shares, either individually or together with associates. A non-resident of Canada is not allowed to own more than 15%.
Transactions with key management personnel
Key
management personnel are those persons that have the authority and responsibility for planning, directing and controlling the activities of the Company, directly or indirectly. Key management personnel of the Company include executive officers,
vice-presidents, other senior managers and members of the board of directors.
In addition to their salaries, Cameco also provides non-cash benefits to
executive officers and vice-presidents and contributes to pension plans on their behalf (note 26). Senior management and directors also participate in the Company’s share-based compensation plans (note 25).
Executive officers are subject to terms of notice ranging from three to six months. Upon resignation at the Company’s request, they are entitled to
termination benefits up to the lesser of 24 months or the period remaining until age 65. The termination benefits include gross salary plus the target short-term incentive bonus for the year in which termination occurs.
Compensation for key management personnel was comprised of:
|
|
|
|
|
|
|
|
|
| |
|
2015 |
|
|
2014 |
|
| Short-term employee benefits |
|
$ |
20,271 |
|
|
$ |
19,922 |
|
| Post-employment benefits |
|
|
5,787 |
|
|
|
8,395 |
|
| Share-based compensation(a) |
|
|
12,749 |
|
|
|
11,306 |
|
|
|
|
|
|
|
|
|
|
|
|
$ |
38,807 |
|
|
$ |
39,623 |
|
|
|
|
|
|
|
|
|
|
| (a) |
Excludes deferred share units held by directors (see note 25). |
59
Other related party transactions
Through unsecured shareholder loans, Cameco has agreed to fund Inkai’s project development costs as well as further evaluation on block 3. The limits of
the loan facilities are $189,218,000 (US) and advances under these facilities bear interest at a rate of LIBOR plus 2%. At December 31, 2015, $157,492,000 (US) of principal and interest was outstanding (2014 - $197,551,000 (US)).
Cameco’s share of outstanding principal and interest was $87,188,000 at December 31, 2015 (2014 - $91,672,000) (note 11). For the year ended
December 31, 2015, Cameco recorded interest income of $2,007,000 relating to this balance (2014 - $2,038,000).
60

Management’s discussion and analysis
February 5, 2016
|
|
|
| 6 |
|
2015 PERFORMANCE HIGHLIGHTS |
|
|
| 8 |
|
MARKET OVERVIEW AND 2015 DEVELOPMENTS |
|
|
| 14 |
|
OUR STRATEGY |
|
|
| 21 |
|
MEASURING OUR RESULTS |
|
|
| 23 |
|
FINANCIAL RESULTS |
|
|
| 51 |
|
OUR OPERATIONS AND PROJECTS |
|
|
| 80 |
|
MINERAL RESERVES AND RESOURCES |
|
|
| 85 |
|
ADDITIONAL INFORMATION |
|
|
| 88 |
|
2015 CONSOLIDATED FINANCIAL STATEMENTS |
This management’s discussion and analysis (MD&A) includes information that will help you understand management’s
perspective of our audited consolidated financial statements (financial statements) and notes for the year ended December 31, 2015. The information is based on what we knew as of February 4, 2016.
We encourage you to read our audited consolidated financial statements and notes as you review this MD&A. You can find more information about Cameco,
including our financial statements and our most recent annual information form, on our website at cameco.com, on SEDAR at sedar.com or on EDGAR at sec.gov. You should also read our annual information form before making an investment decision about
our securities.
The financial information in this MD&A and in our financial statements and notes are prepared according to International Financial
Reporting Standards (IFRS), unless otherwise indicated.
Unless we have specified otherwise, all dollar amounts are in Canadian dollars.
Throughout this document, the terms we, us, our, the Company and Cameco mean Cameco Corporation and its subsidiaries, including NUKEM Energy GmbH (NUKEM),
unless otherwise indicated.
Caution about forward-looking information
Our MD&A includes statements and information about our expectations for the future. When we discuss our strategy, plans, future financial and operating
performance, or other things that have not yet taken place, we are making statements considered to be forward-looking information or forward-looking statements under Canadian and United States (US) securities laws. We refer to them in
this MD&A as forward-looking information.
Key things to understand about the forward-looking information in this MD&A:
| • |
|
It typically includes words and phrases about the future, such as: anticipate, believe, estimate, expect, plan, will, intend, goal, target, forecast, project, strategy and outlook (see examples below).
|
| • |
|
It represents our current views, and can change significantly. |
| • |
|
It is based on a number of material assumptions, including those we have listed on page 3, which may prove to be incorrect. |
| • |
|
Actual results and events may be significantly different from what we currently expect, due to the risks associated with our business. We list a number of these material risks on pages 2 and 3. We recommend you
also review our annual information form, which includes a discussion of other material risks that could cause actual results to differ significantly from our current expectations. |
| • |
|
Forward-looking information is designed to help you understand management’s current views of our near and longer term prospects, and it may not be appropriate for other purposes. We will not necessarily update this
information unless we are required to by securities laws. |
Examples of forward-looking information in this MD&A
| • |
|
our expectations about 2016 and future global uranium supply, consumption, demand, contracting volumes, number of reactors and nuclear generating capacity, including the discussion under the headings Market overview
and 2015 developments |
| • |
|
the discussion under the heading Our strategy |
| • |
|
our expectations for uranium deliveries in 2016 |
| • |
|
the discussion of our expectations relating to our transfer pricing disputes, including our estimate of the amount and timing of expected cash taxes and transfer pricing penalties |
| • |
|
our consolidated outlook for the year and the outlook for our uranium, fuel services and NUKEM segments for 2016 |
| • |
|
our expectations for future tax payments and rates |
| • |
|
our expectations for future royalty payments
|
| • |
|
our price sensitivity analysis for our uranium segment |
| • |
|
our expectation that existing cash balances and operating cash flows will meet our anticipated 2016 capital requirements without the need for any significant additional funding, other than we may need to temporarily
draw on other short-term liquidity during the course of the year |
| • |
|
our expectations for 2016, 2017 and 2018 capital expenditures |
| • |
|
our expectation that in 2016 we will continue to comply with all the covenants in our unsecured revolving credit facility |
| • |
|
our future plans and expectations for each of our uranium operating properties and projects under evaluation, and fuel services operating sites |
| • |
|
our mineral reserve and resource estimates |
Material risks
| • |
|
actual sales volumes or market prices for any of our products or services are lower than we expect for any reason, including changes in market prices or loss of market share to a competitor |
| • |
|
we are adversely affected by changes in currency exchange rates, interest rates, royalty rates, or tax rates |
| • |
|
our production costs are higher than planned, or necessary supplies are not available, or not available on commercially reasonable terms |
| • |
|
our estimates of production, purchases, costs, decommissioning or reclamation expenses, or our tax expense estimates prove to be inaccurate |
| • |
|
we are unable to enforce our legal rights under our existing agreements, permits or licences |
| • |
|
we are subject to litigation or arbitration that has an adverse outcome, including lack of success in our disputes with tax authorities |
| • |
|
we are unsuccessful in our dispute with Canada Revenue Agency (CRA) and this results in significantly higher cash taxes, interest charges and penalties than the amount of our cumulative tax provision |
| • |
|
we are unable to utilize letters of credit to the extent anticipated in our dispute with CRA
|
| • |
|
there are defects in, or challenges to, title to our properties |
| • |
|
our mineral reserve and resource estimates are not reliable, or we face unexpected or challenging geological, hydrological or mining conditions |
| • |
|
we are affected by environmental, safety and regulatory risks, including increased regulatory burdens or delays |
| • |
|
we cannot obtain or maintain necessary permits or approvals from government authorities |
| • |
|
we are affected by political risks |
| • |
|
we are affected by terrorism, sabotage, blockades, civil unrest, social or political activism, accident or a deterioration in political support for, or demand for, nuclear energy |
| • |
|
we are impacted by changes in the regulation or public perception of the safety of nuclear power plants, which adversely affect the construction of new plants, the relicensing of existing plants and the demand for
uranium |
| • |
|
there are changes to government regulations or policies that adversely affect us, including tax and trade laws and policies |
| • |
|
our uranium suppliers fail to fulfil delivery commitments |
| • |
|
our McArthur River development, mining or production plans are delayed or do not succeed for any reason
|
2 CAMECO
CORPORATION
| • |
|
our Cigar Lake development, mining or production plans are delayed or do not succeed, including as a result of any difficulties with freezing the deposit to meet production targets, or any difficulties with the McClean
Lake mill modifications or expansion or milling of Cigar Lake ore |
| • |
|
the production increase approval at McClean Lake is delayed or not obtained, or there is a labour dispute at McClean Lake |
| • |
|
we are affected by natural phenomena, including inclement weather, fire, flood and earthquakes
|
| • |
|
our operations are disrupted due to problems with our own or our customers’ facilities, the unavailability of reagents, equipment, operating parts and supplies critical to production, equipment failure, lack of
tailings capacity, labour shortages, labour relations issues (including an inability to renew the collective bargaining agreement with unionized employees at the Port Hope conversion facility), strikes or lockouts, underground floods, cave-ins,
ground movements, tailings dam failures, transportation disruptions or accidents, or other development and operating risks
|
Material assumptions
| • |
|
our expectations regarding sales and purchase volumes and prices for uranium and fuel services |
| • |
|
our expectations regarding the demand for uranium, the construction of new nuclear power plants and the relicensing of existing nuclear power plants not being more adversely affected than expected by changes in
regulation or in the public perception of the safety of nuclear power plants |
| • |
|
our expected production level and production costs |
| • |
|
the assumptions regarding market conditions upon which we have based our capital expenditures expectations |
| • |
|
our expectations regarding spot prices and realized prices for uranium, and other factors discussed under the heading Price sensitivity analysis: uranium segment |
| • |
|
our expectations regarding tax rates and payments, royalty rates, currency exchange rates and interest rates |
| • |
|
our expectations about the outcome of disputes with tax authorities |
| • |
|
we are able to utilize letters of credit to the extent anticipated in our dispute with CRA |
| • |
|
our decommissioning and reclamation expenses |
| • |
|
our mineral reserve and resource estimates, and the assumptions upon which they are based, are reliable |
| • |
|
the geological, hydrological and other conditions at our mines |
| • |
|
our McArthur River development, mining and production plans succeed
|
| • |
|
our Cigar Lake development, mining and production plans succeed, and the deposit freezes as planned |
| • |
|
modification and expansion of the McClean Lake mill are completed as planned and the mill is able to process Cigar Lake ore as expected |
| • |
|
the production increase approval at McClean Lake is approved by the regulator and there is no labour dispute at the McClean Lake mill |
| • |
|
our ability to continue to supply our products and services in the expected quantities and at the expected times |
| • |
|
our ability to comply with current and future environmental, safety and other regulatory requirements, and to obtain and maintain required regulatory approvals |
| • |
|
our operations are not significantly disrupted as a result of political instability, nationalization, terrorism, sabotage, blockades, civil unrest, breakdown, natural disasters, governmental or political actions,
litigation or arbitration proceedings, the unavailability of reagents, equipment, operating parts and supplies critical to production, labour shortages, labour relations issues (including an ability to renew the collective bargaining agreement with
unionized employees at the Port Hope conversion facility), strikes or lockouts, underground floods, cave-ins, ground movements, tailings dam failure, lack of tailings capacity, transportation disruptions or accidents, or other development or
operating risks |
MANAGEMENT’S
DISCUSSION AND ANALYSIS 3
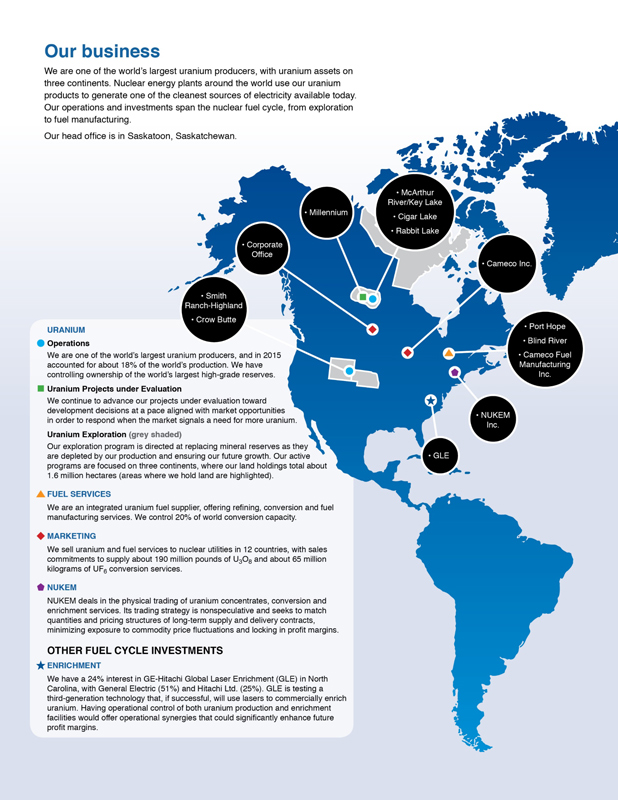
4 CAMECO
CORPORATION
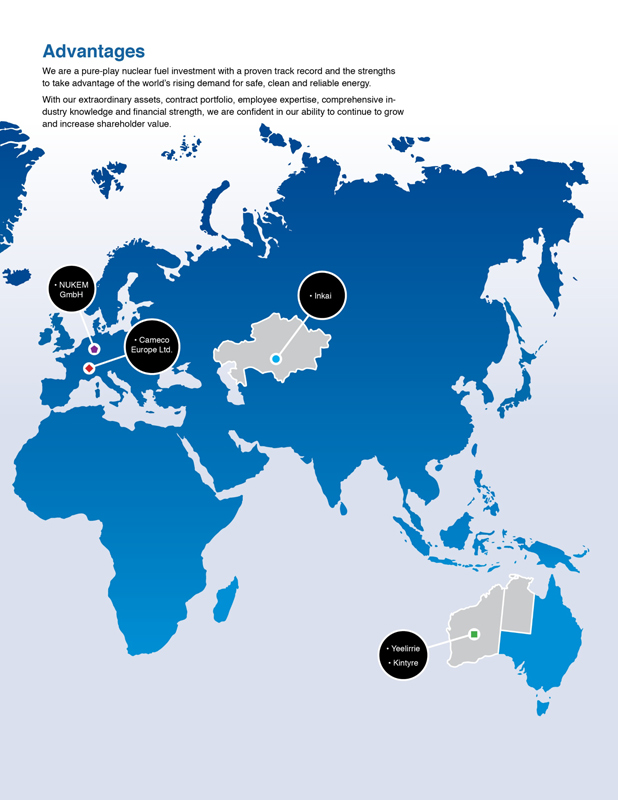
MANAGEMENT’S
DISCUSSION AND ANALYSIS 5
2015 performance highlights
Cameco performed well in 2015, navigating the challenging market conditions, while continuing to prepare for the positive long-term growth we see coming in the
industry.
Financial performance
|
|
|
|
|
|
|
|
|
|
|
|
|
| HIGHLIGHTS |
|
|
|
| DECEMBER 31 ($ MILLIONS EXCEPT WHERE INDICATED) |
|
2015 |
|
|
2014 |
|
|
CHANGE |
|
| Revenue |
|
|
2,754 |
|
|
|
2,398 |
|
|
|
15 |
% |
| Gross profit |
|
|
697 |
|
|
|
638 |
|
|
|
9 |
% |
| Net earnings attributable to equity holders |
|
|
65 |
|
|
|
185 |
|
|
|
(65 |
)% |
| $ per common share (diluted) |
|
|
0.16 |
|
|
|
0.47 |
|
|
|
(65 |
)% |
| Adjusted net earnings (non-IFRS, see page 25) |
|
|
344 |
|
|
|
412 |
|
|
|
(17 |
)% |
| $ per common share (adjusted and diluted) |
|
|
0.87 |
|
|
|
1.04 |
|
|
|
(16 |
)% |
| Cash provided by operations (after working capital changes) |
|
|
450 |
|
|
|
480 |
|
|
|
(6 |
)% |
Net earnings attributable to equity holders (net earnings) and adjusted net earnings were lower in 2015 compared to 2014.
However, significant weakness in the Canadian dollar in 2015 resulted in record annual consolidated revenue of $2.8 billion, and record annual revenue from our uranium segment of $1.9 billion based on sales of 32.4 million pounds at a record
Canadian dollar average realized price of $57.58 per pound. See 2015 consolidated financial results beginning on page 24 for more information.
Solid progress in our uranium segment
this year
In our uranium segment, we exceeded our annual production expectations, and realized a number of successes at our mining operations. Key
highlights:
| • |
|
record annual production of 28.4 million pounds—4% higher than the guidance provided in our 2015 third quarter MD&A |
| • |
|
record quarterly production of 9.6 million pounds in the fourth quarter—17% higher than in 2014, largely due to production from Cigar Lake |
| • |
|
exceeded planned production at the Cigar Lake mine and AREVA’s McClean Lake mill |
We continued to advance
exploration activities, spending $2 million on four brownfield exploration projects, $4 million on our projects under evaluation in Australia, and $2 million at Inkai and our US operations. We spent about $32 million on regional exploration
programs, mostly in Saskatchewan and Australia.
Updates on our other segments and investments
Production in 2015 from our fuel services segment was 16% lower than in 2014. We continue to face weak market conditions for conversion services, and have
decided to further reduce production at Port Hope in 2016.
6 CAMECO
CORPORATION
On January 31, 2014, we announced the sale of our 31.6% limited partnership interest in Bruce Power Limited
Partnership (BPLP) and related entities for $450 million. The sale closed on March 27, 2014, and was accounted for as being completed effective January 1, 2014.
|
|
|
|
|
|
|
|
|
|
|
|
|
|
|
|
|
| HIGHLIGHTS |
|
2015 |
|
|
2014 |
|
|
CHANGE |
|
| Uranium |
|
Production volume (million lbs) |
|
|
|
|
28.4 |
|
|
|
23.3 |
|
|
|
22 |
% |
|
|
Sales volume (million lbs)1 |
|
|
|
|
32.4 |
|
|
|
33.9 |
|
|
|
(4 |
)% |
|
|
Average realized price |
|
($US/lb) |
|
|
45.19 |
|
|
|
47.53 |
|
|
|
(5 |
)% |
|
|
|
|
($Cdn/lb) |
|
|
57.58 |
|
|
|
52.37 |
|
|
|
10 |
% |
|
|
Revenue ($ millions)1 |
|
|
|
|
1,866 |
|
|
|
1,777 |
|
|
|
5 |
% |
|
|
Gross profit ($ millions) |
|
|
|
|
608 |
|
|
|
602 |
|
|
|
1 |
% |
| Fuel services |
|
Production volume (million kgU) |
|
|
|
|
9.7 |
|
|
|
11.6 |
|
|
|
(16 |
)% |
|
|
Sales volume (million kgU)1 |
|
|
|
|
13.6 |
|
|
|
15.5 |
|
|
|
(12 |
)% |
|
|
Average realized price |
|
($Cdn/kgU) |
|
|
23.37 |
|
|
|
19.70 |
|
|
|
19 |
% |
|
|
Revenue ($ millions)1 |
|
|
|
|
319 |
|
|
|
306 |
|
|
|
4 |
% |
|
|
Gross profit ($ millions) |
|
|
|
|
61 |
|
|
|
38 |
|
|
|
61 |
% |
| NUKEM |
|
Sales volume U3O8 (million lbs)1 |
|
|
|
|
10.7 |
|
|
|
8.1 |
|
|
|
32 |
% |
|
|
Average realized price |
|
($Cdn/lb) |
|
|
48.82 |
|
|
|
44.90 |
|
|
|
9 |
% |
|
|
Revenue ($ millions)1 |
|
|
|
|
554 |
|
|
|
349 |
|
|
|
59 |
% |
|
|
Gross profit ($ millions) |
|
|
|
|
42 |
|
|
|
22 |
|
|
|
91 |
% |
| 1 |
Includes sales and revenue between our uranium, fuel services and NUKEM segments. Please see 2015 Financial results by segment beginning on page 43. |
SHARES AND STOCK OPTIONS OUTSTANDING
At February 3, 2016, we had:
| • |
|
395,792,522 common shares and one Class B share outstanding |
| • |
|
8,481,833 stock options outstanding, with exercise prices ranging from $19.30 to $54.38
|
DIVIDEND POLICY
Our board of directors has established a policy of paying a quarterly dividend of $0.10 ($0.40 per year) per common share. This policy will be reviewed from
time to time based on our cash flow, earnings, financial position, strategy and other relevant factors.
MANAGEMENT’S
DISCUSSION AND ANALYSIS 7
Market overview and 2015 developments
The world needs energy
It’s no secret the world
needs more energy. The world’s population increasing from 7 billion to 9 billion over the next two decades will drive the need for energy, but, even today, there are 2 billion people who lack access to electricity or have only limited access.
This is unacceptable in today’s modern world, where electricity is one of the greatest contributors to quality of life. Many countries are working to fill that gap and, in many cases, to keep up with rapid growth. Nuclear energy is an important
option in the world’s energy mix, and, as energy demand continues to grow, nuclear is expected to do the same.
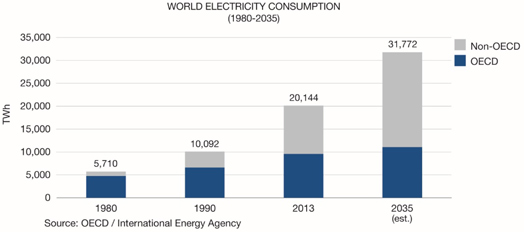
Nuclear – an integral part of the energy mix
Today, nuclear power contributes 11% of global electricity. While that percentage is not expected to change significantly over the next two decades, nuclear
power output is expected to change—increasing along with rising electricity demand. In other words, the nuclear story is a growth story.
It’s
easy to see why. Nuclear power is a safe, clean, reliable, affordable, and, most importantly, baseload energy source. As a result, it is an integral part of the energy mix for many countries, and even more so as the focus on climate change and clean
air intensifies. Not only does it provide baseload power—that 24-hour power required to have health care, education, transportation, and communication systems—but it does so without emitting greenhouse gases (GHGs).
Reactors – gigawatt growth
That’s why, today,
we see billions of dollars being invested in nuclear around the world. By 2025, we expect to see around 113 new reactors built, more than 60 of which are under construction right now. In addition, some existing plants are also adding capacity
through uprates. Although this growth will be tempered somewhat by the closure of around 55 reactors, the end result is growth in the range of 80 gigawatts of nuclear power added to the world’s grids over the next decade, and even more expected
outside that time frame.
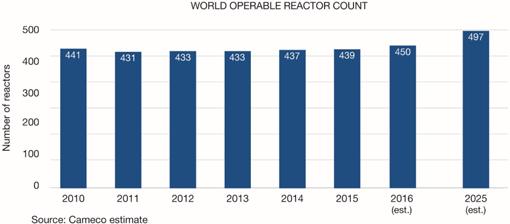
8 CAMECO
CORPORATION
The areas of the world where we are seeing the most growth are those with increasing populations and rapidly
expanding economies. China continues to lead the way with 24 reactors under construction. India, Russia, South Korea, United Arab Emirates (UAE), and the United States are also building new reactors. Of the reactors under construction today, if
startups occur as planned, 65% of those units could be online over the next three years.
Elsewhere, the United Kingdom (UK) government is maintaining its
commitment to nuclear energy as a source of emissions-free energy. Critical milestones have been reached, allowing new build plans to move forward. In addition, several previously non-nuclear countries are moving ahead with their reactor
construction programs or considering adding nuclear to their energy mix in the future. Construction continues on four units in the UAE. Turkey is also moving forward with plans to build eight new reactors. Bangladesh, Vietnam, Jordan, Poland, Saudi
Arabia, and Egypt are a few more of the countries continuing their plans to proceed with nuclear power development.

As we expand our 10-year market analysis by one year, the net new reactor count at the end of the window changes from about
80 net new reactors previously expected by 2024, to about 58 net new reactors expected by 2025. Although this change in growth expectations impacts the expected demand in the later years of our industry outlook, it does not influence our view of the
market fundamentals and is primarily a function of rolling our analysis forward. This year, the change is related to:
| • |
|
a number of new reactors that came online in 2015 and are now in the “Operable” category, rather than the “New build” category |
| • |
|
several reactors that are scheduled to be shut down in 2025, which are now included in our 10-year window, as well as additional shutdowns announced in 2015, increasing the “Retirements” category
|
| • |
|
low electricity prices and flat demand, in conjunction with delays in finalizing energy policies, contributing to the announcement of construction delays for some reactors in the outermost years of the 10-year window,
pushing the affected units beyond 2025 and removing them from the current “New build” category |
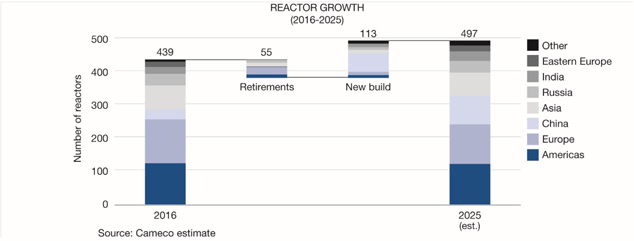
MANAGEMENT’S
DISCUSSION AND ANALYSIS 9
More reactors means more demand for uranium
Today, the world’s reactors consume around 160 million pounds of uranium annually. With the growth in reactor construction, we expect that to grow to
around 220 million pounds per year by 2025—average annual growth of 3%. This does not include the strategic inventory building that usually occurs with new reactor construction, which would mean even further growth in demand. So, over the
long term, we see very strong growth in the demand for the products that we supply.
Can supply keep up?
Over the long term, while demand is increasing, supply, without new investment, is expected to decrease, resulting in the possibility of a widening gap between
supply and demand.
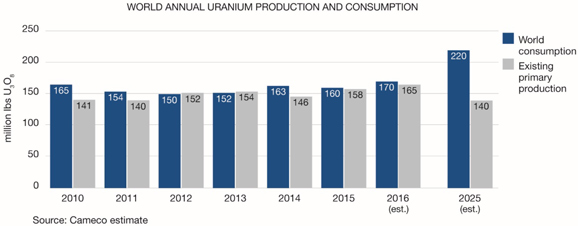
There is already a gap between the uranium consumed by reactors and the uranium produced from the world’s mines, which
has been the case for several years. That gap has been bridged by secondary supplies—uranium in various forms that is already out of the ground and sitting in stockpiles around the world. Today, about 20% of global supply comes from secondary
sources, but those stockpiles are being drawn down, and are expected to contribute less and less over time. This means that more primary production will be needed from uranium mines—in fact, we estimate about 10% of total supply required over
the next decade will need to come from new mines that are not yet in development.
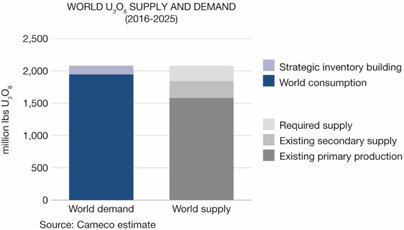
But that could be difficult. In general, new mines are difficult to bring on in a timely manner. The long lead nature of
mine development means our industry is not able to respond quickly to sudden increases in demand or significant supply interruptions. Bringing on and ramping up a significant new production centre can take between seven and 10 years.
10 CAMECO
CORPORATION
Adding to the challenge are the number of new projects being cancelled or delayed, and the existing production
being shelved due to the low uranium prices that have persisted since the 2011 events at the Fukushima-Daiichi nuclear power plant in Japan. Today’s uranium prices are not high enough to incent new mine production and, in some cases, not high
enough to keep current mines in operation. While some new mines may be brought on regardless of price as a result of sovereign interests or to cover existing commitments, overall, we expect supply to decrease over time due to the global lack of
investment.
Today – little demand, a lot of supply
Today, the uranium market continues to be in a state of oversupply, and there are a number of factors contributing: primary supply continues to perform
relatively well; enrichers are underfeeding their plants in reaction to excess enrichment capacity, which creates another source of uranium; the majority of Japan’s reactors remain idled, meaning their inventories continue to grow and Japanese
utilities will be well covered for some time; and the new reactors under construction today have not yet started to consume the inventories that have been purchased and stored for their operation.
In addition, market activity is much lighter than it has been in the past. Utilities are well covered in their fuel requirements and are not under pressure to
contract for more. They have time to wait it out to see if uranium prices continue to decrease. So far, this strategy has paid off for them. Similarly, existing suppliers appear reluctant to enter into meaningful contract volumes at current prices.
The result has been very low levels of contracting over the past three years. Consumption is a fairly simple and constant equation based on the fuel needs of operating reactors and, historically, the quantity of material contracted in the long-term
market in a year has been roughly equivalent to the quantity of uranium consumed in the world’s reactors in a year. In fact, only 35% of the uranium consumed in nuclear reactors over the past three years has been replaced by utilities with
long-term contracts. That’s less than 180 million pounds contracted when about 475 million pounds were used, meaning inventories and the current oversupply are being drawn down as future requirements remain uncovered. If contracting
is not happening now, it will have to later; the demand has just been pushed further out in time.
2015 market developments
THE GOOD, THE BAD AND THE INDIFFERENT
As has been the
case in recent years, a lot happened over the course of 2015, although the general state of the market did not see much change.
Making positive news for
nuclear, as usual, was China. Not only did the country continue with its rapid reactor new build program and bring eight reactors online, but Chinese companies also signed agreements with Argentina, Romania and the UK for new reactors, illustrating
the country’s commitment to nuclear and its intent to become a major international player in the nuclear industry.
Undoubtedly, the biggest headline
of 2015 was the long-awaited first reactor restarts in Japan. Sendai units 1 and 2 were the first reactors in Japan to restart since 2013, and it is hoped they are the first of many to come.
New builds in the UK and US continued to be bright spots for the industry, in addition to a number of reactor life extensions approved in Japan, and the US,
with utilities now considering additional extensions that could see reactor lives reaching 80 years.
However, these positive developments could not
outweigh the more powerful influence of a continued sluggish global economy, geopolitical issues, concerns around growth in China, and flat electricity demand. These more general drivers had help from industry specific factors as well, such as
slower new reactor construction, eight reactor shutdowns, the continued high level of inventories held by market participants, and France’s policy to reduce nuclear in their energy mix to 50% by 2025 becoming law.
In addition, supply performed relatively well, with only minor disruptions and one curtailment, unlike 2014, which saw six projects tempered or curtailed.
The end result was a market seemingly indifferent to the commotion of events that occurred throughout the year.
MANAGEMENT’S
DISCUSSION AND ANALYSIS 11
CONTRACTING
Market contracting activity was modest. Spot volumes were normal, but long-term contracting was well below historical averages and current consumption
levels—about half of current annual reactor consumption estimates, similar to 2014. Long-term contracting is a key factor in the timing of market recovery, and its pace will depend on the respective coverage levels, market views and risk
appetite of both buyers and sellers.
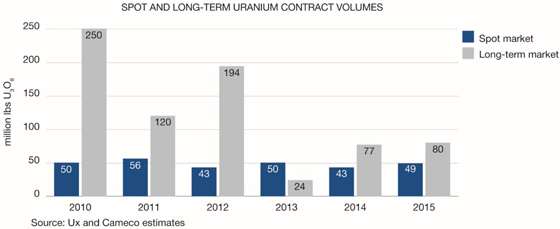
JAPAN
The big news in
Japan was the restart of Sendai units 1 and 2, which occurred in August and October. In addition, the court injunction against the two Takahama units was overturned in December, 2015, clearing the way for Takahama unit 3 to restart on
January 29, 2016, with unit 4 expected to restart later in the first quarter. Ikata unit 3 has also cleared a safety inspection by the Nuclear Regulatory Authority, and four more units are in the final stages of approval. In all, three reactors
are now in operation, while 23 remain under evaluation for restart.
Over the long term, Japan’s energy policy states that nuclear will make up 20 to
22% of the energy mix in the country. The billions of dollars in investment being made by Japan’s utilities suggest a high degree of confidence in reactors coming back online and meeting this target; however, public sentiment towards nuclear in
Japan remains somewhat uncertain.
OTHER REGIONS
China’s remarkable nuclear growth program remains on track and the UK’s plans for new reactor construction continue to move forward. India and South
Korea are also among several key regions growing their nuclear generation fleet.
In 2015, growth was tangible as 10 reactors came online—double that
of 2014. These included the eight noted in China, one in Russia and one in South Korea. And seven more reactors began construction—six in China and one in the UAE, a formerly non-nuclear country with four reactors now under construction.
But, to round out the picture, eight units shut down. Five of these were in Japan, plus one in Sweden, one in Germany as part of its phase-out plans, and one
in the UK—the last Magnox reactor operating in the world. In addition, there were announcements for future shutdowns in the US, where nuclear struggles to remain competitive in deregulated electricity markets and in the context of low natural
gas prices.
One event that could have an effect on the future of nuclear in the US and other western countries is the UN Climate Conference COP-21
agreement, finalized in 2015. As a non-GHG emitter, nuclear could play a significant role in achieving climate change prevention goals.
12 CAMECO
CORPORATION
Industry prices
In 2015, the spot price declined from a high of $39 (US) per pound to a low of about $34 (US) per pound, but managed to average around $37 (US) for the year.
Utilities continue to be well covered under existing contracts, and, given the current uncertainties in the market, we expect they and other market participants will continue to be opportunistic in their buying. As a result, contracting is expected
to remain somewhat discretionary in 2016.
|
|
|
|
|
|
|
|
|
|
|
|
|
| |
|
2015 |
|
|
2014 |
|
|
CHANGE |
|
| Uranium ($US/lb
U3O8)1 |
|
|
|
|
|
|
|
|
|
|
|
|
| Average spot market price |
|
|
36.55 |
|
|
|
33.21 |
|
|
|
10 |
% |
| Average long-term price |
|
|
46.29 |
|
|
|
46.46 |
|
|
|
— |
|
| Fuel services ($US/kgU as UF6)1 |
|
|
|
|
|
|
|
|
|
|
|
|
| Average spot market price |
|
|
|
|
|
|
|
|
|
|
|
|
| North America |
|
|
7.35 |
|
|
|
7.63 |
|
|
|
(4 |
)% |
| Europe |
|
|
7.85 |
|
|
|
7.97 |
|
|
|
(2 |
)% |
| Average long-term price |
|
|
|
|
|
|
|
|
|
|
|
|
| North America |
|
|
15.33 |
|
|
|
16.00 |
|
|
|
(4 |
)% |
| Europe |
|
|
16.38 |
|
|
|
17.00 |
|
|
|
(4 |
)% |
Note: the industry does not publish UO2 prices.
| 1 |
Average of prices reported by TradeTech and Ux Consulting (Ux) |
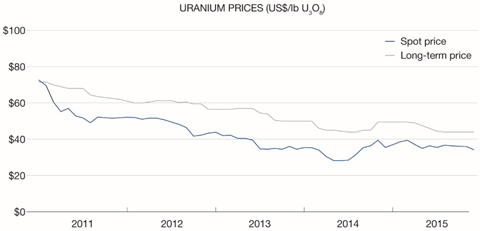
MANAGEMENT’S
DISCUSSION AND ANALYSIS 13
Our strategy
Positioned for success
Our strategy is set within the
context of a challenging market environment, which we expect to give way to strong long-term fundamentals driven by increasing population and electricity demand.
We are a pure-play nuclear fuel producer, focused on taking advantage of the long-term growth we see coming in our industry, while maintaining the ability to
respond to market conditions as they evolve. Our strategy is to focus on our tier-one assets and profitably produce at a pace aligned with market signals in order to increase long-term shareholder value, and to do that with an emphasis on safety,
people and the environment.
URANIUM
Uranium
production is central to our strategy, as it is the biggest value driver of the nuclear fuel cycle and our business. We plan to focus on our tier-one assets and manage our supply according to market conditions in order to return the best value
possible. As conditions improve, we expect to meet rising demand with increased production from our best margin operations. See Uranium – production overview on page 54 for additional details.
FUEL SERVICES
Our fuel services division is a source of
profit and supports our uranium segment while allowing us to vertically integrate across the fuel cycle. Our focus is on maintaining and optimizing profitability.
ENRICHMENT
We continue to explore opportunities in the
second largest value driver of the fuel cycle.
NUKEM
NUKEM’s activities provide a source of profit and give us insight into market dynamics.
Capital allocation – focus on value
Delivering
returns to our long-term shareholders is a top priority. We continually evaluate our investment options to ensure we allocate our capital in a way that we believe will:
| • |
|
create the greatest long-term value for our shareholders |
| • |
|
allow us to maintain our investment grade rating |
| • |
|
ensure we execute on our dividend policy |
To deliver value, free cash flow must be productively reinvested in
the business or returned to shareholders, which requires good execution and disciplined allocation. We have a multidisciplinary capital allocation team that evaluates all possible uses of investable capital.
We start by determining how much cash we have to invest (investable capital), which is based on our expected cash flow from operations minus expenses we
consider to be a higher priority, such as dividends and financing costs, and could include others. This investable capital can be reinvested in the company or returned to shareholders.
Today, considering the continued near-term uncertainty, we believe the best way to create value is to focus on expanding our tier-one assets and maintaining a
strong balance sheet. This provides us with the opportunity to gain operating leverage as the market transitions to being demand driven, and mitigates risk in the event of a prolonged period of uncertainty.
REINVESTMENT
Before investable capital is reinvested in
sustaining, capacity replacement or growth, all opportunities are ranked and only those that meet the required risk-adjusted return criteria are considered for investment. We also must identify, at the corporate level, the expected impact on cash
flow, earnings and the balance sheet. All project risks must be identified, including the risks of not investing. Allocation of capital only occurs once an investment has cleared these hurdles.
This may result in some opportunities being held back in favour of higher return investments, and should allow us to generate the best return on investment
decisions when faced with multiple prospects, while also controlling our costs. If there are not enough good growth prospects internally or externally, this may result in residual investable capital, which we would then consider returning directly
to shareholders.
14 CAMECO
CORPORATION
RETURN
If
we determine the best use of cash is to return it to shareholders, we can do that through a share repurchase or dividend—either a one-time special dividend or a dividend growth policy. When deciding between these options, we consider a number
of factors, including generation of excess cash, growth prospects for the company, growth prospects for the industry, and the nature of the excess cash.
Share buyback: If we were generating excess cash while there were little or no growth prospects for the company or the industry, then a share buyback
might make sense. However, our current view is that the long-term fundamentals for Cameco and the industry remain strong.
Dividend: We view our
dividend as a priority. Therefore, any change to our dividend policy must be carefully considered with a view to long-term sustainability. Currently, the conditions in the uranium market do not provide us with the level of certainty we require to
implement changes to our dividend policy.
Marketing strategy – balanced contract portfolio
As with our corporate strategy and approach to capital allocation, the purpose of our marketing strategy is to deliver value. Our approach is to secure a solid
base of earnings and cash flow by maintaining a balanced contract portfolio that optimizes our realized price.
Uranium is not traded in meaningful
quantities on a commodity exchange. Utilities buy the majority of their uranium and fuel services products under long-term contracts with suppliers, and meet the rest of their needs on the spot market. We sell uranium and fuel services directly to
nuclear utilities around the world as uranium concentrates, UO2, UF6, conversion services or fuel fabrication. We have an extensive
portfolio of long-term sales contracts that reflect the long-term, trusting relationships we have with our customers.
In addition, we are active in the
spot market, buying and selling uranium when it is beneficial for us. Our NUKEM business segment enhances our ability to participate, as they are one of the world’s leading traders of uranium and uranium-related products. We undertake activity
in the spot market prudently, looking at the spot price and other business factors to decide whether it is appropriate to purchase or sell into the spot market. Not only is this activity a source of profit, it gives us insight into underlying market
fundamentals.
OPTIMIZING REALIZED PRICE
We try to
maximize our realized price by signing contracts with terms between five and 10 years (on average) that include mechanisms to protect us when market prices decline and allow us to benefit when market prices go up.
Because we deliver large volumes of uranium every year, our net earnings and operating cash flows are affected by changes in the uranium price. Market prices
are influenced by the fundamentals of supply and demand, geopolitical events, disruptions in planned supply and other market factors.
LONG-TERM
CONTRACTING
We target a ratio of 40% fixed-pricing and 60% market-related pricing in our portfolio of long-term contracts. This is a balanced and
flexible approach that allows us to adapt to market conditions and put a floor on our average realized price, reduce the volatility of our future earnings and cash flow, and deliver the best value to shareholders over the long term.
Over time, this strategy has allowed us to add increasingly favourable contracts to our portfolio that will enable us to participate in increases in market
prices in the future.
Fixed-price contracts: are typically based on the industry long-term price indicator at the time the contract is accepted
and escalated over the term of the contract.
Market-related contracts: are different from fixed-price contracts in that they may be based on
either the spot price or the long-term price, and that price is as quoted at the time of delivery rather than at the time the contract is accepted. These contracts sometimes provide for small discounts, often include floor prices, and some include
ceiling prices, all of which are also escalated over the term of the contract.
MANAGEMENT’S
DISCUSSION AND ANALYSIS 15
Fuel services contracts: the majority of our fuel services contracts are at a fixed price per kgU,
escalated over the term of the contract, and reflect the market at the time the contract is accepted.
CONTRACT PORTFOLIO STATUS
Currently, we are heavily committed under long-term uranium contracts through 2018, so we are being selective when considering new commitments. We have
commitments to sell approximately 190 million pounds of U3O8 with 41 customers worldwide in our uranium segment, and commitments to
sell approximately 65 million kilograms as UF6 conversion with 33 customers worldwide in our fuel services segment.
Customers – U3O8:
Five largest customers account for 47% of commitments

Customers – UF6 conversion:
Five largest customers account for 59% of commitments
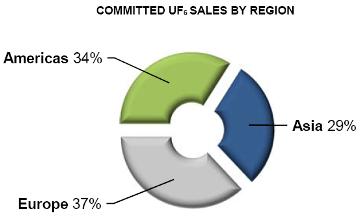
MANAGING OUR CONTRACT COMMITMENTS
To meet our delivery commitments, we use uranium obtained:
| • |
|
from our existing production |
| • |
|
through purchases under long-term agreements and in the spot market |
| • |
|
from our existing inventory |
We allow sales volumes to vary year-to-year depending on:
| • |
|
the level of sales commitments in our long-term contract portfolio (the annual average sales commitments over the next five years in our uranium segment is 27 million pounds, with commitment levels through 2018
higher than in 2019 and 2020) |
| • |
|
our production volumes, including from the rampup of Cigar Lake and from potential increases at McArthur River/Key Lake |
| • |
|
purchases under existing and/or new arrangements |
| • |
|
discretionary use of inventories |
16 CAMECO
CORPORATION
Focusing on cost efficiency
PRODUCTION COSTS
In order to operate efficiently and
cost-effectively, we manage operating costs and improve plant reliability by prudently investing in production infrastructure, new technology and business process improvements. Like all mining companies, our uranium segment is affected by the cost
of inputs such as labour and fuel.
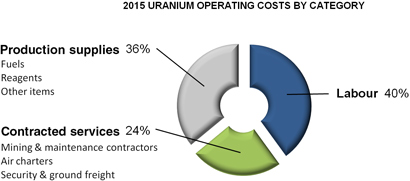
Operating costs in our fuel services segment are mainly fixed. In 2015, labour accounted for about 51% of the total. The
largest variable operating cost is for zirconium, followed by energy (natural gas and electricity), and anhydrous hydrogen fluoride.
PURCHASES AND
INVENTORY COSTS
Our costs are also affected by the purchases of uranium and conversion services we make under long-term contracts and on the spot
market.
To meet our delivery commitments, we make use of our mined production and inventories, and we purchase material where it is beneficial to do so.
The cost of purchased material may be higher or lower than our other sources of supply, depending on market conditions. The cost of purchased material affects our cost of sales, which is determined by calculating the average of all of our sources of
supply, including opening inventory, production and purchases.
FINANCIAL IMPACT
As greater certainty returns to the uranium market, based on our view that the market will transition from being supply-driven to being demand-driven, we
expect uranium prices will rise to reflect the cost of bringing on new primary production to meet growing demand, which should have a positive impact on our average realized price.
In addition, as we execute our strategy to focus on tier-one production, we expect to see more stability in the unit cost of sales for our uranium segment.
MANAGEMENT’S
DISCUSSION AND ANALYSIS 17
Sustainable development: A key part of our strategy
Social responsibility and environmental protection are top priorities for us, so much so that we have built our corporate objectives around them within our
four measures of success: a safe, healthy and rewarding workplace, a clean environment, supportive communities, and outstanding financial performance. For us, sustainability isn’t an add-on for our company; it’s at the core of our company
culture. It helps us:
| • |
|
build trust, credibility and corporate reputation |
| • |
|
gain and enhance community support for our operations and plans |
| • |
|
attract and retain employees |
| • |
|
drive innovation and continual improvement to build competitive advantage |
Because they are so important, we
integrate sustainable development principles and practices at each level of our organization, from our overall corporate strategy to individual employee practice in day-to-day operations.
SAFE, HEALTHY, REWARDING WORKPLACE
We are committed to
living a strong safety culture, while looking to continually improve. As a result of this commitment, we have a long history of strong safety performance at our operations and across the organization.
2015 Highlights:
| • |
|
our total recordable injury rate decreased by 10% |
| • |
|
continued low average dose of radiation to workers while moving Cigar Lake into commercial production |
| • |
|
awarded the John T Ryan National Safety award for McArthur River mine based on prior year performance |
A CLEAN ENVIRONMENT
We are committed to being a leading environmental performer. We strive to be a leader not only by complying with legal requirements, but also by keeping risks
as low as reasonably achievable, and looking for opportunities to move beyond requirements.
We track our progress by monitoring the air, water and land
near our operations, and by measuring the amount of energy we use and the amount of waste generated. We use this information to help identify opportunities to improve.
2015 Highlights:
| • |
|
sustained the significantly reduced uranium-to-air emissions achieved at our Port Hope Conversion facility in 2014 |
| • |
|
implemented waste management initiatives across the organization, including significant reductions of low level radioactive waste stored at our Fuel Services Division facilities |
| • |
|
achieved a 50% reduction of surface water consumption at our McArthur River operation through increased recycling initiatives |
| • |
|
carried out industry leading research and innovation in groundwater restoration at our US in situ recovery operations |
SUPPORTIVE COMMUNITIES
Gaining the trust and support of
our communities, indigenous people, and governments is necessary to sustain our business. We earn support and trust through excellent safety and environmental performance, by proactively engaging our stakeholders in an open and transparent way, and
by making a difference in communities wherever we operate. These efforts are critical to obtaining and maintaining the necessary regulatory approvals.
2015 Highlights:
| • |
|
over $299 million in procurement from locally owned northern Saskatchewan companies |
| • |
|
1,369 local personnel from northern Saskatchewan (811 Cameco employees, 558 contractors) |
| • |
|
no significant disputes related to land use or customary rights |
| • |
|
community engagement activities at all of our operations |
| • |
|
established relationships with five universities along with Los Alamos National Laboratory, and the United States Geological Survey in conducting groundwater restoration |
18 CAMECO
CORPORATION
OUTSTANDING FINANCIAL PERFORMANCE
Long-term financial stability and profitability are essential to our sustainability as a company. We firmly believe that sound governance is the foundation for
strong corporate performance.
2015 Highlights:
| • |
|
continue to achieve an average realized price that outperforms the market |
| • |
|
ranked 26th out of 234 Canadian companies by Globe and Mail in governance practices |
MONITORING AND MEASUREMENT
We take the integration of
sustainable development and measurement of our performance seriously. We have been producing a Sustainable Development (SD) Report since 2005, using the Global Reporting Initiative’s Sustainability Framework (GRI). It is our report card to our
stakeholders. It tells them how we’re performing against globally recognized key indicators that measure our social, environmental and economic impacts in the areas that matter most to them. It provides information about our goals, where
we’ve met, exceeded or struggled with them, and how we plan to do better. We expect to release our next SD Report in 2016.
All of our operating
sites are ISO 14001 compliant. In addition, we have now transitioned from individual site-based ISO 14001 certifications to a single corporate certification. We expect to roll the majority of our operations into this single certification.
Achievements
We are a four-time Gold award winner
through the Progressive Aboriginal Relations program as judged by the Canadian Council for Aboriginal Business. We are also proud to have been named one of Canada’s Top 100 Employers, Saskatchewan’s Top Employers, Canada’s Best
Diversity Employers and one of Canada’s Top Employers for Young People for the sixth year. We are a leading employer of indigenous peoples in Canada, and have procured over $3 billion in services from local suppliers in northern Saskatchewan
since 2004. This year, we were also named one of the world’s most sustainable corporations by Corporate Knights, a Canadian media and research company.
In 2015, we secured approval to increase production at the McArthur River operation as a result of earning the confidence of our regulators,
which—although primarily based on our safety, health and environmental performance—is also a reflection of the support we have from our neighbouring communities in northern Saskatchewan.
We encourage you to review our SD report at cameco.com/about/sustainability which outlines our commitment to people and the environment in more detail.
MANAGEMENT’S
DISCUSSION AND ANALYSIS 19

20 CAMECO
CORPORATION
Measuring our results
There is no finish line when it comes to delivering on our strategic goals. We have a long-term commitment to constantly measure, evaluate and improve.
Each year, we set corporate objectives that are aligned with our strategic plan. These objectives fall under our four measures of success, and performance
against specific targets under these objectives forms the foundation for a portion of annual employee and executive compensation. See our most recent management proxy circular for more information on how executive compensation is determined.
|
|
|
|
|
|
|
| 2015 OBJECTIVES1 |
|
TARGET |
|
RESULTS |
|
|
|
| OUTSTANDING FINANCIAL PERFORMANCE |
|
|
|
|
| Earnings measures |
|
Achieve targeted adjusted net earnings and cash flow from operations. |
|
Partially achieved |
|
• adjusted net earnings were lower than the
target
• cash flow from operations was higher than the target |
|
|
|
|
| Capital management measures |
|
Execute capital projects within the approved scope, cost and schedule. |
|
Achieved |
|
• cost performance was below the target level
(under budget)
• project milestones were achieved on or ahead of schedule |
|
|
|
|
| Cigar Lake |
|
Achieve production target at Cigar Lake. |
|
Exceeded |
|
• production from Cigar Lake in 2015 was higher than the target |
|
| SAFE, HEALTHY AND REWARDING WORKPLACE |
|
|
|
|
| Workplace safety |
|
Strive for no injuries at all Cameco-operated sites. Maintain a long-term downward trend in combined employee and contractor injury frequency and severity, and radiation doses. |
|
Partially achieved |
|
• did not meet our targeted safety measures
• injury rates trended downward across the company, but fell short of
targets for the year
• average radiation doses remained low and stable |
|
|
|
|
| Rewarding workplace |
|
Attract and retain the employees needed to support operations. |
|
Substantially achieved |
|
• overall voluntary turnover rate was better than
target (lower turnover)
• turnover rate for new hires during the first year of employment was
higher than the target (higher turnover) |
|
|
|
|
| CLEAN ENVIRONMENT |
|
|
|
|
|
|
|
|
|
|
| Improve environmental performance |
|
Achieve a decreasing trend for environmental incidents. |
|
Achieved |
|
• there were no significant environmental incidents
in 2015
• reportable environmental incidents were within the range of targeted
performance |
|
| SUPPORTIVE COMMUNITIES |
|
|
|
|
| Build and sustain stakeholder support |
|
Meet our business development obligations under our Collaboration Agreements. |
|
Exceeded |
|
• sourcing of northern services from northern
Saskatchewan vendors was above the target
• sourcing of capital projects construction services from northern
Saskatchewan vendors was above the target |
| 1 |
Detailed results for our 2015 corporate objectives and the related targets will be provided in our 2016 management proxy circular prior to our Annual Meeting of Shareholders on May 11, 2016. |
MANAGEMENT’S
DISCUSSION AND ANALYSIS 21
2016 objectives
|
| OUTSTANDING FINANCIAL PERFORMANCE |
|
| • Achieve targeted adjusted net earnings and cash flow from
operations.
• Achieve capital project management targets and continue to ramp up production at Cigar
Lake. |
|
| SAFE, HEALTHY AND REWARDING WORKPLACE |
|
| • Improve workplace safety performance at all sites.
• Attract and retain
the employees needed to support operations. |
|
| CLEAN ENVIRONMENT |
|
| • Improve environmental performance at all sites. |
|
| SUPPORTIVE COMMUNITIES |
|
| • Build and sustain strong stakeholder support for our activities. |
22 CAMECO
CORPORATION
Financial results
This section of our MD&A discusses our performance, financial condition and outlook for the future.
|
|
|
| 24 |
|
2015 CONSOLIDATED FINANCIAL RESULTS |
|
|
| 35 |
|
OUTLOOK FOR 2016 |
|
|
| 37 |
|
LIQUIDITY AND CAPITAL RESOURCES |
|
|
| 42 |
|
BALANCE SHEET |
|
|
| 43 |
|
2015 FINANCIAL RESULTS BY SEGMENT |
|
|
| 43 |
|
URANIUM |
|
|
| 45 |
|
FUEL SERVICES |
|
|
| 45 |
|
NUKEM |
|
|
| 46 |
|
FOURTH QUARTER FINANCIAL RESULTS |
|
|
| 46 |
|
CONSOLIDATED RESULTS |
|
|
| 48 |
|
URANIUM |
|
|
| 50 |
|
FUEL SERVICES |
|
|
| 50 |
|
NUKEM |
MANAGEMENT’S
DISCUSSION AND ANALYSIS 23
2015 consolidated financial results
On January 31, 2014, we announced the sale of our 31.6% limited partnership interest in BPLP and related entities for $450 million. The sale closed on
March 27, 2014 and has been accounted for as being completed effective January 1, 2014.
Under IFRS, we are required to report the results from
discontinued operations separately from continuing operations. We have included our operating earnings from BPLP, and the financial impact of the sale, in discontinued operations.
Throughout this document, for comparison purposes, all results for “earnings from continuing operations” and “cash from continuing
operations” have been revised to exclude BPLP. The impact of BPLP is shown separately as a discontinued operation.
|
|
|
|
|
|
|
|
|
|
|
|
|
|
|
|
|
| HIGHLIGHTS |
|
|
|
|
|
|
|
CHANGE FROM |
|
| DECEMBER 31 ($ MILLIONS EXCEPT WHERE INDICATED) |
|
2015 |
|
|
2014 |
|
|
2013 |
|
|
2014 TO 2015 |
|
| Revenue |
|
|
2,754 |
|
|
|
2,398 |
|
|
|
2,439 |
|
|
|
15 |
% |
| Gross profit |
|
|
697 |
|
|
|
638 |
|
|
|
607 |
|
|
|
9 |
% |
| Net earnings attributable to equity holders |
|
|
65 |
|
|
|
185 |
|
|
|
318 |
|
|
|
(65 |
)% |
| $ per common share (basic) |
|
|
0.16 |
|
|
|
0.47 |
|
|
|
0.81 |
|
|
|
(65 |
)% |
| $ per common share (diluted) |
|
|
0.16 |
|
|
|
0.47 |
|
|
|
0.81 |
|
|
|
(65 |
)% |
| Adjusted net earnings (non-IFRS, see page 25) |
|
|
344 |
|
|
|
412 |
|
|
|
445 |
|
|
|
(17 |
)% |
| $ per common share (adjusted and diluted) |
|
|
0.87 |
|
|
|
1.04 |
|
|
|
1.12 |
|
|
|
(16 |
)% |
| Cash provided by operations (after working capital changes) |
|
|
450 |
|
|
|
480 |
|
|
|
524 |
|
|
|
(6 |
)% |
Net earnings
Our net
earnings attributable to equity holders (net earnings) in 2015 were $65 million ($0.16 per share diluted) compared to $185 million ($0.47 per share diluted) in 2014, mainly due to:
| • |
|
greater losses on foreign exchange derivatives due to the weakening of the Canadian dollar. See Foreign exchange on page 34 for details. |
| • |
|
lower tax recoveries, primarily due to the write-off of our deferred tax asset in the US. See Income taxes on page 29 for details. |
partially offset by:
| • |
|
lower impairment charges ($215 million in 2015; $327 million in 2014) |
| • |
|
higher earnings in our uranium and fuel services segments due to higher average realized prices |
| • |
|
higher earnings in our NUKEM segment as a result of higher volumes and average realized price |
| • |
|
reduction of the provision related to our CRA litigation. See Income taxes on page 29 for details. |
In
addition, in 2014 there were a number of one-time items that contributed to the higher net earnings in 2014 compared to 2015, including:
| • |
|
the sale of our interest in BPLP resulting in a $127 million gain in 2014 |
| • |
|
a favourable settlement of $66 million in 2014 with respect to a dispute regarding a long-term supply contract with a utility customer |
partially offset by:
| • |
|
payment of an early agreement termination fee of $18 million as a result of the cancellation of our toll conversion agreement with Springfields Fuels Limited (SFL), and $12 million for settlement costs with respect to
early redemption of our Series C debentures in 2014 |
| • |
|
the write-off of $41 million of assets under construction in 2014 as a result of changes made to the scope of a number of projects |
THREE-YEAR TREND
Our net earnings normally trend with
revenue, but, in recent years, have been significantly influenced by unusual items.
24 CAMECO
CORPORATION
In 2014, our net earnings were $133 million lower than in 2013 primarily due to:
| • |
|
an increase in impairment charges ($70 million in 2013; $327 million in 2014) |
| • |
|
no earnings from BPLP, which we divested in the first quarter of 2014 |
| • |
|
the write-off of $41 million of assets under construction as a result of changes made to the scope of a number of projects |
| • |
|
payment of an early termination fee of $18 million incurred as a result of our toll conversion agreement with SFL, and settlement costs of $12 million with respect to early termination of our Series C debentures
|
| • |
|
lower earnings from our fuel services business as a result of a decrease in sales volumes and higher unit cost of sales |
| • |
|
higher losses on foreign exchange derivatives due to the weakening Canadian dollar. See Foreign exchange on page 34 for more information. |
partially offset by:
| • |
|
a $127 million gain on the sale of our interest in BPLP in 2014 |
| • |
|
higher earnings from our uranium segment due to a higher average realized price |
| • |
|
a favourable settlement of $66 million in a dispute regarding a long-term supply contract with a utility customer |
| • |
|
lower exploration costs |
| • |
|
higher tax recoveries resulting from higher pre-tax losses in Canada |
Impairment charge on producing assets
During the fourth quarter of 2015, we recognized a $210 million impairment charge related to our Rabbit Lake operation. The impairment was due to
increased uncertainty around future production sources for the Rabbit Lake mill as a result of the ongoing economic conditions. The amount of the charge was determined as the excess of carrying value over the recoverable amount. The recoverable
amount of the mill was determined to be $69 million. See note 9 to the financial statements.
Non-IFRS measures
ADJUSTED NET EARNINGS
Adjusted net earnings is a measure
that does not have a standardized meaning or a consistent basis of calculation under IFRS (non-IFRS measure). We use this measure as a more meaningful way to compare our financial performance from period to period. We believe that, in addition to
conventional measures prepared in accordance with IFRS, certain investors use this information to evaluate our performance. Adjusted net earnings is our net earnings attributable to equity holders, adjusted to better reflect the underlying financial
performance for the reporting period. The adjusted earnings measure reflects the matching of the net benefits of our hedging program with the inflows of foreign currencies in the applicable reporting period, and adjusted for impairment charges, the
write-off of assets, NUKEM inventory write-down, loss on exploration properties, gain on interest in BPLP (after tax), and income taxes on adjustments.
Adjusted net earnings is non-standard supplemental information and should not be considered in isolation or as a substitute for financial information prepared
according to accounting standards. Other companies may calculate this measure differently, so you may not be able to make a direct comparison to similar measures presented by other companies.
To facilitate a better understanding of these measures, the table below reconciles adjusted net earnings with our net earnings for the years ended 2015, 2014
and 2013.
|
|
|
|
|
|
|
|
|
|
|
|
|
|
|
| ($ MILLIONS) |
|
2015 |
|
|
2014 |
|
|
2013 |
|
| Net earnings attributable to equity holders |
|
|
65 |
|
|
|
185 |
|
|
|
318 |
|
|
|
|
|
|
|
|
|
|
|
|
|
|
|
|
| Adjustments |
|
|
|
|
|
|
|
|
|
|
|
|
|
|
| Adjustments on derivatives (pre-tax) |
|
|
166 |
|
|
|
47 |
|
|
|
56 |
|
| NUKEM purchase price inventory recovery |
|
|
(3 |
) |
|
|
(5 |
) |
|
|
14 |
|
| Impairment charges |
|
|
215 |
|
|
|
327 |
|
|
|
70 |
|
| Income taxes on adjustments |
|
|
(99 |
) |
|
|
(56 |
) |
|
|
(28 |
) |
| Write-off of assets |
|
|
— |
|
|
|
41 |
|
|
|
— |
|
| Loss on exploration properties |
|
|
— |
|
|
|
— |
|
|
|
15 |
|
| Gain on interest in BPLP (after tax) |
|
|
— |
|
|
|
(127 |
) |
|
|
— |
|
|
|
|
|
|
|
|
|
|
|
|
|
|
|
|
| Adjusted net earnings |
|
|
344 |
|
|
|
412 |
|
|
|
445 |
|
|
|
|
|
|
|
|
|
|
|
|
|
|
|
|
MANAGEMENT’S
DISCUSSION AND ANALYSIS 25
The following table shows what contributed to the change in adjusted net earnings for 2015.
|
|
|
|
|
|
|
| ($ MILLIONS) |
|
|
|
|
|
| Adjusted net earnings – 2014 |
|
|
412 |
|
|
| Change in gross profit by segment |
|
| (we calculate gross profit by deducting from revenue the cost of products and services sold, and depreciation and
amortization (D&A), net of hedging benefits) |
|
|
|
|
| Uranium |
|
Lower sales volume |
|
|
(27 |
) |
|
|
Lower realized prices ($US) |
|
|
(76 |
) |
|
|
Foreign exchange impact on realized prices |
|
|
245 |
|
|
|
Higher costs |
|
|
(136 |
) |
|
|
|
|
|
|
|
|
|
change – uranium |
|
|
6 |
|
|
|
|
|
|
|
|
| Fuel services |
|
Lower sales volume |
|
|
(5 |
) |
|
|
Higher realized prices ($Cdn) |
|
|
50 |
|
|
|
Higher costs |
|
|
(22 |
) |
|
|
|
|
|
|
|
|
|
change – fuel services |
|
|
23 |
|
|
|
|
|
|
|
|
| NUKEM |
|
Gross profit |
|
|
20 |
|
|
|
|
|
|
|
|
|
|
change – NUKEM |
|
|
20 |
|
|
|
|
|
|
|
|
| Other changes |
|
|
|
|
|
|
| Higher administration expenditures |
|
|
(10 |
) |
| Lower exploration expenditures |
|
|
6 |
|
| Lower income tax recovery |
|
|
(76 |
) |
| Contract termination fee (SFL) incurred in 2014 |
|
|
18 |
|
| Arbitration award in 2014 |
|
|
(66 |
) |
| Debenture redemption premium incurred in 2014 |
|
|
12 |
|
| Lower loss on disposal of assets |
|
|
1 |
|
| Higher loss on derivatives |
|
|
(40 |
) |
| Lower loss on equity-accounted investments |
|
|
16 |
|
| Higher foreign exchange gains |
|
|
25 |
|
| Other |
|
|
(3 |
) |
|
|
|
|
|
|
|
| Adjusted net earnings – 2015 |
|
|
344 |
|
|
|
|
|
|
|
|
THREE-YEAR TREND
Our
adjusted net earnings decreased from 2013 to 2014, and decreased again from 2014 to 2015.
The 7% decrease from 2013 to 2014 resulted from:
| • |
|
no earnings from BPLP due to divestiture of our interest in the first quarter of 2014 |
| • |
|
an early termination fee of $18 million incurred as a result of the cancellation of our toll conversion agreement with SFL, which was to expire in 2016 |
| • |
|
settlement costs of $12 million with respect to the early redemption of our Series C debentures |
| • |
|
lower earnings from our fuel services business as a result of lower sales volumes and higher unit cost of sales |
| • |
|
greater losses on foreign exchange derivatives due to the weakening of the Canadian dollar |
partially offset
by:
| • |
|
higher earnings in our uranium segment due to a higher average realized price |
| • |
|
a favourable settlement of $66 million with respect to a dispute regarding a long-term supply contract with a utility customer |
| • |
|
lower exploration costs due to a more focused effort on our core projects in Saskatchewan, with decreases in activity elsewhere, particularly at our Kintyre project in Australia and at Inkai |
The 17% decrease from 2014 to 2015 resulted from:
| • |
|
greater losses on foreign exchange derivatives due to the weakening of the Canadian dollar, see Foreign exchange on page 34 for more information |
| • |
|
lower tax recoveries, primarily due to the write-off of our deferred tax asset in the US. See Income taxes on page 29 for details. |
26 CAMECO
CORPORATION
partially offset by:
| • |
|
higher earnings in our uranium and fuel services segments mainly due to a higher average realized price |
| • |
|
higher earnings from our NUKEM segment mainly due to higher sales volumes and a higher average realized price |
| • |
|
a reduction of the provision related to our CRA litigation, see Income taxes on page 29 for details |
In
addition, in 2014 there was a favourable settlement of $66 million with respect to a dispute regarding a long-term supply contract with a utility customer that contributed to the higher adjusted net earnings in 2014 compared to 2015. The impact of
the settlement was partially offset by an early termination fee of $18 million incurred as a result of the cancellation of our toll conversion agreement with SFL and settlement costs of $12 million with respect to the early redemption of our Series
C debentures in 2014.
Average realized prices
|
|
|
|
|
|
|
|
|
|
|
|
|
|
|
|
|
|
|
| |
|
| |
|
|
|
|
|
|
|
|
|
|
CHANGE FROM |
|
| |
|
|
|
2015 |
|
|
2014 |
|
|
2013 |
|
|
2014 TO 2015 |
|
| Uranium1 |
|
$US/lb |
|
|
45.19 |
|
|
|
47.53 |
|
|
|
48.35 |
|
|
|
(5 |
)% |
|
|
$Cdn/lb |
|
|
57.58 |
|
|
|
52.37 |
|
|
|
49.81 |
|
|
|
10 |
% |
| Fuel services |
|
$Cdn/kgU |
|
|
23.37 |
|
|
|
19.70 |
|
|
|
18.12 |
|
|
|
19 |
% |
| NUKEM |
|
$Cdn/lb |
|
|
48.82 |
|
|
|
44.90 |
|
|
|
42.26 |
|
|
|
9 |
% |
| 1 |
Average realized foreign exchange rate ($US/$Cdn): 2015 – $1.27, 2014 – $1.10 and 2013 – $1.03. |
Revenue
The following table shows what contributed to
the change in revenue for 2015.
|
|
|
|
|
| ($ MILLIONS) |
|
|
|
| Revenue – 2014 |
|
|
2,398 |
|
| Uranium |
|
|
|
|
| Lower sales volume |
|
|
(80 |
) |
| Higher realized prices ($Cdn) |
|
|
169 |
|
| Change in intersegment sales |
|
|
48 |
|
|
|
|
|
|
| Fuel services |
|
|
|
|
| Lower sales volume |
|
|
(37 |
) |
| Higher realized prices ($Cdn) |
|
|
50 |
|
| Change in intersegment sales |
|
|
4 |
|
|
|
|
|
|
| NUKEM |
|
|
|
|
| Change in revenue |
|
|
204 |
|
| Change in intersegment sales |
|
|
23 |
|
|
|
|
|
|
| Other |
|
|
(25 |
) |
|
|
|
|
|
| Revenue – 2015 |
|
|
2,754 |
|
|
|
|
|
|
See 2015 Financial results by segment on page 43 for more detailed discussion.
THREE-YEAR TREND
In 2014, revenue decreased by 2%
compared to 2013 due to lower sales revenues in our NUKEM and fuel services segments as we reduced sales volumes in response to market conditions. This was partially offset by higher revenues in our uranium business due to a higher average realized
price for uranium resulting from the weakening of the Canadian dollar compared to 2013. The realized foreign exchange rate was 1.10 compared to 1.03 in 2013.
In the third quarter of 2015, we projected our annual revenue to increase between 5% and 10%, but realized a 15% increase over 2014. One contributing factor
was higher revenue in our NUKEM segment as a result of higher than expected sales volumes, which were driven by increased market activity in the fourth quarter. In addition, sales revenues in all of our operating segments increased compared to 2014
due to higher realized prices resulting from the weakening of the Canadian dollar. The realized foreign exchange rate was 1.27 compared to 1.10 in 2014.
MANAGEMENT’S
DISCUSSION AND ANALYSIS 27
OUTLOOK FOR 2016
We expect consolidated revenue to decrease up to 5% in 2016, based on currently committed sales volumes, due to a planned decrease in uranium and fuel services
sales volumes. If we make additional sales with deliveries in 2016, we would expect our revenue outlook to increase.
In our uranium and fuel services
segments, our customers choose when in the year to receive deliveries. As a result, our quarterly delivery patterns and, therefore, our sales volumes and revenue can vary significantly as shown below. We expect the quarterly distribution of uranium
deliveries in 2016 to be weighted to the second half of the year. However, not all delivery notices have been received to date and the expected delivery pattern could change. Typically, we receive notices six months in advance of the requested
delivery date.
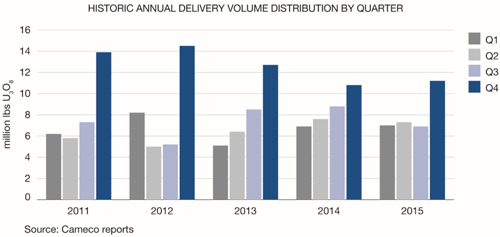
Discontinued operation
On March 27, 2014, we completed the sale of our 31.6% limited partnership interest in BPLP, which was accounted for effective January 1, 2014. The
aggregate sale price for our interest in BPLP and certain related entities was $450 million. We realized an after tax gain of $127 million on this divestiture. As a result of the transaction, we presented the results of BPLP as a discontinued
operation and we revised our statement of earnings, statement of comprehensive income and statement of cash flows to reflect the change in presentation. See note 6 to the financial statements for more information.
|
|
|
|
|
|
|
|
|
| ($ MILLIONS) |
|
2015 |
|
|
2014 |
|
| Share of earnings from BPLP and related entities |
|
|
— |
|
|
|
— |
|
| Tax expense |
|
|
— |
|
|
|
— |
|
|
|
|
|
|
|
|
|
|
|
|
|
— |
|
|
|
— |
|
| Gain on disposal of BPLP and related entities |
|
|
— |
|
|
|
145 |
|
| Tax expense on disposal |
|
|
— |
|
|
|
(18 |
) |
|
|
|
|
|
|
|
|
|
|
|
|
— |
|
|
|
127 |
|
|
|
|
|
|
|
|
|
|
| Net earnings from discontinued operations |
|
|
— |
|
|
|
127 |
|
|
|
|
|
|
|
|
|
|
Corporate expenses
ADMINISTRATION
|
|
|
|
|
|
|
|
|
|
|
|
|
| ($ MILLIONS) |
|
2015 |
|
|
2014 |
|
|
CHANGE |
|
| Direct administration |
|
|
173 |
|
|
|
163 |
|
|
|
6 |
% |
| Stock-based compensation |
|
|
14 |
|
|
|
13 |
|
|
|
8 |
% |
|
|
|
|
|
|
|
|
|
|
|
|
|
| Total administration |
|
|
187 |
|
|
|
176 |
|
|
|
6 |
% |
|
|
|
|
|
|
|
|
|
|
|
|
|
Direct administration costs in 2015 were $10 million higher than in 2014 due to costs related to our collaboration agreement
with the startup of Cigar Lake, increased legal costs as our CRA dispute progresses toward trial, and the effect of foreign exchange on our US subsidiaries.
28 CAMECO
CORPORATION
We recorded $14 million in stock-based compensation expenses this year under our stock option, restricted share
unit, deferred share unit, performance share unit and phantom stock option plans, compared to $13 million in 2014. See note 25 to the financial statements.
Outlook for 2016
We expect administration costs (not
including stock-based compensation) to be 5% to 10% higher compared to 2015 due to increased costs related to the northern collaboration agreements and increased project work. In 2016, we are continuing to negotiate new collaboration agreements with
northern communities, which could result in additional one-time payments. Due to the uncertainty of the timing for the potential signing of agreements, the cost is not included in our outlook. If agreements are signed and there is an impact on our
administrative costs, we will update our outlook.
EXPLORATION
Our 2015 exploration activities remained focused on Canada and Australia. As we continued to focus more on our core projects in Saskatchewan, and reduced our
activities elsewhere, we decreased our spending from $47 million in 2014 to $40 million in 2015.
Outlook for 2016
We expect exploration expenses to be about 15% to 20% higher than they were in 2015 due to increased exploration activity at Cigar Lake.
FINANCE COSTS
Finance costs were $104 million compared
to $112 million in 2014. The decrease from last year was a result of $12 million in settlement costs related to the early redemption of our Series C debentures being incurred in 2014, partially offset by higher interest on long-term debt in 2015.
See note 20 to the financial statements.
FINANCE INCOME
Finance income was $5 million compared to $7 million in 2014, reflecting lower average cash balances in 2015.
GAINS AND LOSSES ON DERIVATIVES
In 2015, we recorded
$281 million in losses on our derivatives compared to losses of $121 million in 2014. The increase reflects the continued weakening of the Canadian dollar compared to the US dollar in 2015. See Foreign exchange on page 34 and note 27 to the
financial statements.
INCOME TAXES
We recorded an
income tax recovery of $143 million in 2015 compared to a recovery of $175 million in 2014. The decrease in recovery was primarily due to the write-off of our deferred tax asset in the US, partially offset by a reduction in the provision related to
our CRA litigation and a change in the distribution of earnings between jurisdictions compared to 2014. See note 22 to the financial statements.
During
the fourth quarter, we reversed amounts related to our deferred tax asset in the US totaling $73 million. We determined that it was no longer probable that there would be sufficient taxable profit in the future against which the operating losses and
other tax deductions could be used.
The recovery was impacted by a decrease of $42 million to our provision related to the CRA litigation. Since 2008,
CRA has disputed our corporate structure and the related transfer pricing methodology we used for certain intercompany uranium sale and purchase agreements, and issued notices of reassessment for our 2003 through 2010 tax returns. We have recorded a
cumulative tax provision of $50 million (September 30, 2015 - $92 million), where an argument could be made that our transfer price may have fallen outside of an appropriate range of pricing in uranium contracts for the period from 2003 through
2015. We have reduced the provision to reflect management’s revised estimate, which takes into account additional contract information. We are confident that we will be successful in our case and continue to believe the ultimate resolution of
this matter will not be material to our financial position, results of operations and cash flows in the year(s) of resolution. See note 22 to the financial statements.
MANAGEMENT’S
DISCUSSION AND ANALYSIS 29
In 2015, we recorded losses of $960 million in Canada compared to $841 million in 2014, while earnings in foreign
jurisdictions increased to $880 million from $722 million. The tax rate in Canada is higher than the average of the rates in the foreign jurisdictions in which our subsidiaries operate.
In the third quarter, we expected our annual income tax rate, based on adjusted net earnings, to be a recovery of 25% to 30%. The actual result was a recovery
of 15%, mainly due to one-time adjustments as discussed above. On an adjusted earnings basis, we recognized a tax recovery of $44 million in 2015 compared to a recovery of $120 million in 2014. Our effective tax rate was a recovery of 15% in 2015,
compared to a recovery of 41% in 2014. The table below presents our adjusted earnings and adjusted income tax expenses attributable to Canadian and foreign jurisdictions.
|
|
|
|
|
|
|
|
|
| ($ MILLIONS) |
|
2015 |
|
|
2014 |
|
| Pre-tax adjusted earnings1 |
|
|
|
|
|
|
|
|
| Canada |
|
|
(578 |
) |
|
|
(611 |
) |
| Foreign |
|
|
877 |
|
|
|
901 |
|
|
|
|
|
|
|
|
|
|
| Total pre-tax adjusted earnings |
|
|
299 |
|
|
|
290 |
|
|
|
|
|
|
|
|
|
|
| Adjusted income taxes1 |
|
|
|
|
|
|
|
|
| Canada |
|
|
(177 |
) |
|
|
(156 |
) |
| Foreign |
|
|
133 |
|
|
|
36 |
|
|
|
|
|
|
|
|
|
|
| Adjusted income tax recovery |
|
|
(44 |
) |
|
|
(120 |
) |
|
|
|
|
|
|
|
|
|
| 1 |
Pre-tax adjusted earnings and adjusted income taxes are non-IFRS measures. Our IFRS-based measures have been adjusted by the amounts reflected in the table in adjusted net earnings (non-IFRS measure on page 25).
|
TRANSFER PRICING DISPUTES
We have
been reporting on our transfer pricing disputes with CRA since 2008, when it originated, and with the United States Internal Revenue Service (IRS) since the first quarter of 2015. Below, we discuss the general nature of transfer pricing disputes
and, more specifically, the ongoing disputes we have.
Transfer pricing is a complex area of tax law, and it is difficult to predict the outcome of cases
like ours. However, tax authorities generally test two things:
| • |
|
the governance (structure) of the corporate entities involved in the transactions |
| • |
|
the price at which goods and services are sold by one member of a corporate group to another |
We have a global
customer base and we established a marketing and trading structure involving foreign subsidiaries, including Cameco Europe Limited (CEL), which entered into various intercompany arrangements, including purchase and sale agreements, as well as
uranium purchase and sale agreements with third parties. Cameco and its subsidiaries made reasonable efforts to put arm’s-length transfer pricing arrangements in place, and these arrangements expose the parties to the risks and rewards accruing
to them under these contracts. The intercompany contract prices are generally comparable to those established in comparable contracts between arm’s-length parties entered into at that time.
For the years 2003 to 2010, CRA has shifted CEL’s income (as recalculated by CRA) back to Canada and applied statutory tax rates, interest and instalment
penalties, and, from 2007 to 2009, transfer pricing penalties. There has not yet been a decision regarding a transfer pricing penalty for 2010. The IRS is also proposing to allocate a portion of CEL’s income for the years 2009 through 2012 to
the US, resulting in such income being taxed in multiple jurisdictions. Taxes of approximately $320 million for the 2003 – 2015 years have already been paid in a jurisdiction outside Canada and the US. Bilateral international tax treaties
contain provisions that generally seek to prevent taxation of the same income in both countries. As such, in connection with these disputes, we are considering our options, including remedies under international tax treaties that would limit double
taxation; however, there is a risk that we will not be successful in eliminating all potential double taxation. The expected income adjustments under our tax disputes are represented by the amounts claimed by CRA and IRS and are described below.
30 CAMECO
CORPORATION
CRA dispute
Since 2008, CRA has disputed our corporate structure and the related transfer pricing methodology we used for certain intercompany uranium sale and purchase
agreements. To the end of 2014, we received notices of reassessment for our 2003 through 2009 tax returns, and, in the fourth quarter of 2015, we received a notice of reassessment for our 2010 tax year. We have recorded a cumulative tax provision of
$50 million (September 30, 2015 - $92 million), where an argument could be made that our transfer price may have fallen outside of an appropriate range of pricing in uranium contracts for the period from 2003 through 2015. We have reduced the
provision to reflect management’s revised estimate, which takes into account additional contract information. We are confident that we will be successful in our case and continue to believe the ultimate resolution of this matter will not be
material to our financial position, results of operations and cash flows in the year(s) of resolution.
For the years 2003 through 2010, CRA issued
notices of reassessment for approximately $3.4 billion of additional income for Canadian tax purposes, which would result in a related tax expense of about $1.1 billion. CRA has also issued notices of reassessment for transfer pricing penalties for
the years 2007 through 2009 in the amount of $229 million. The Canadian income tax rules include provisions that require larger companies like us to remit or otherwise secure 50% of the cash tax plus related interest and penalties at the time of
reassessment. To date, under these provisions, after applying elective deductions, we have paid a net amount of $232 million cash. In addition, we have provided $332 million in letters of credit (LC) to secure 50% of the cash taxes and related
interest amounts reassessed in 2015. The amounts paid or secured are shown in the table below.
|
|
|
|
|
|
|
|
|
|
|
|
|
|
|
|
|
|
|
|
|
|
|
|
|
| YEAR PAID ($ MILLIONS) |
|
CASH TAXES |
|
|
INTEREST
AND INSTALMENT
PENALTIES |
|
|
TRANSFER
PRICING
PENALTIES |
|
|
TOTAL |
|
|
CASH
REMITTANCE |
|
|
SECURED BY
LC |
|
| Prior to 2013 |
|
|
— |
|
|
|
13 |
|
|
|
— |
|
|
|
13 |
|
|
|
13 |
|
|
|
— |
|
| 2013 |
|
|
1 |
|
|
|
9 |
|
|
|
36 |
|
|
|
46 |
|
|
|
46 |
|
|
|
— |
|
| 2014 |
|
|
106 |
|
|
|
47 |
|
|
|
— |
|
|
|
153 |
|
|
|
153 |
|
|
|
— |
|
| 2015 |
|
|
202 |
|
|
|
71 |
|
|
|
79 |
|
|
|
352 |
|
|
|
20 |
|
|
|
332 |
|
|
|
|
|
|
|
|
|
|
|
|
|
|
|
|
|
|
|
|
|
|
|
|
|
|
| Total |
|
|
309 |
|
|
|
140 |
|
|
|
115 |
|
|
|
564 |
|
|
|
232 |
|
|
|
332 |
|
|
|
|
|
|
|
|
|
|
|
|
|
|
|
|
|
|
|
|
|
|
|
|
|
|
Using the methodology we believe CRA will continue to apply, and including the $3.4 billion already reassessed, we expect to
receive notices of reassessment for a total of approximately $7.0 billion of additional income taxable in Canada for the years 2003 through 2015, which would result in a related tax expense of approximately $2.1 billion. As well, CRA may continue to
apply transfer pricing penalties to taxation years subsequent to 2009. As a result, we estimate that cash taxes and transfer pricing penalties for these years would be between $1.65 billion and $1.70 billion. In addition, we estimate there would be
interest and instalment penalties applied that would be material to us. While in dispute, we would be responsible for remitting or otherwise providing security for 50% of the cash taxes and transfer pricing penalties (between $825 million and $850
million), plus related interest and instalment penalties assessed, which would be material to us.
Under the Canadian federal and provincial tax rules,
the amount required to be paid or secured each year will depend on the amount of income reassessed in that year and the availability of elective deductions and tax loss carryovers. Recently, the CRA decided to disallow the use of any loss
carry-backs for any transfer pricing adjustment, starting with the 2008 tax year. This does not impact the anticipated income tax expense for a particular year, but does impact the timing of any required security or payment. As noted above, for the
2010 tax year, as an alternative to paying cash, we used letters of credit to satisfy our obligations related to the reassessed income tax and related interest amounts. We expect to be able to continue to provide security in the form of letters of
credit to satisfy these requirements. The estimated amounts summarized in the table below reflect actual amounts paid or secured and estimated future amounts owing based on the actual and expected reassessments for the years 2003 through 2015, and
include the expected timing adjustment for the inability to use any loss carry-backs starting in 2008. We will update this table annually to include the estimated impact of reassessments expected for completed years subsequent to 2015.
MANAGEMENT’S
DISCUSSION AND ANALYSIS 31
|
|
|
|
|
|
|
|
|
|
|
|
|
|
|
|
|
| $ MILLIONS |
|
2003-2015 |
|
|
2016-2017 |
|
|
2018-2023 |
|
|
TOTAL |
|
| 50% of cash taxes and transfer pricing penalties paid, secured or owing in the period |
|
|
|
|
|
|
|
|
|
|
|
|
|
|
|
|
| Cash payments |
|
|
156 |
|
|
|
155 - 180 |
|
|
|
30 - 55 |
|
|
|
335 - 360 |
|
| Secured by letters of credit |
|
|
264 |
|
|
|
95 - 120 |
|
|
|
20 - 45 |
|
|
|
425 - 450 |
|
|
|
|
|
|
|
|
|
|
|
|
|
|
|
|
|
|
| Total paid1 |
|
|
420 |
|
|
|
255 - 280 |
|
|
|
65 - 90 |
|
|
|
825 - 850 |
|
|
|
|
|
|
|
|
|
|
|
|
|
|
|
|
|
|
| 1 |
These amounts do not include interest and instalment penalties, which totaled approximately $140 million to December 31, 2015. |
In light of our view of the likely outcome of the case as described above, we expect to recover the amounts remitted, including the $564 million already paid
or otherwise secured to date.
We are expecting the trial for the 2003, 2005 and 2006 reassessments to commence during the week of September 26,
2016, with final arguments in April 2017. If this timing is adhered to, we expect to receive a Tax Court decision within six to 18 months after the trial is complete.
IRS dispute
In the fourth quarter of 2015, we received a
Revenue Agents Report (RAR) from the IRS for the tax years 2010 to 2012. Similar to the 2009 RAR received in the first quarter of 2015, the IRS is challenging the transfer pricing used under certain intercompany transactions pertaining to the 2010
to 2012 tax years for certain of our US subsidiaries. The 2009 and 2010 to 2012 RARs list the adjustments proposed by the IRS and calculate the tax and any penalties owing based on the proposed adjustments.
The current position of the IRS is that a portion of the non-US income reported under our corporate structure and taxed in non-US jurisdictions should be
recognized and taxed in the US on the basis that:
| • |
|
the prices received by our US mining subsidiaries for the sale of uranium to CEL are too low |
| • |
|
the compensation earned by Cameco Inc., one of our US subsidiaries, is inadequate |
The proposed adjustments
result in an increase in taxable income in the US of approximately $419 million (US) and a corresponding increased income tax expense of approximately $122 million (US) for the 2009 through 2012 taxation years, with interest being charged thereon.
In addition, the IRS proposed cumulative penalties of approximately $8 million (US) in respect of the adjustment.
We believe that the conclusions of the
IRS in the RARs are incorrect and we are contesting them in an administrative appeal, during which we are not required to make any cash payments. Until this matter progresses further, we cannot provide an estimation of the likely timeline for a
resolution of the dispute.
We believe that the ultimate resolution of this matter will not be material to our financial position, results of operations
and cash flows in the year(s) of resolution.
Overview of disputes
The table below provides an overview of some of the key points with respect to our CRA and IRS tax disputes.
|
|
|
|
|
| |
|
CRA |
|
IRS |
| Basis for dispute |
|
• Corporate structure/governance
• Transfer pricing methodology used for certain intercompany uranium
sale and purchase agreements
• Allocates Cameco Europe Ltd. (CEL) income (as adjusted) for 2003
through 2010 to Canada (same income we paid tax on in foreign jurisdictions and includes income that IRS is proposing to tax) |
|
• Income earned on sales of uranium by the US mines to
CEL is inadequate
• Compensation earned by Cameco Inc., one of our US subsidiaries, is
inadequate
• Allocates a portion of CEL’s income for the years 2009 through
2012 to the US (a portion of the same income we paid tax on in foreign jurisdictions and which the CRA is proposing to tax) |
|
|
|
| Years under consideration |
|
• CRA reassessed 2003 to 2010
• Auditing 2011 to 2012 |
|
• IRS has proposed adjustments for 2009 through 2012 |
32 CAMECO
CORPORATION
|
|
|
|
|
| Timing of resolution |
|
• Expect our appeal of the 2003, 2005 and 2006
reassessments to commence during the week of September 26, 2016, with final arguments expected in April 2017
• Expect Tax Court decision six to 18 months after completion of
trial |
|
• Contesting proposed adjustments in an administrative
appeal
• We cannot yet provide an estimate as to the timeline for
resolution |
|
|
|
| Required payments |
|
• Expect to provide security in form of letters of
credit and/or make cash payments for 50% of cash taxes, interest and penalties as reassessed
• Paid $232 million in cash to date
• Secured $332 million using letters of credit |
|
• No security or cash payments required while under administrative appeal |
Caution about forward-looking information relating to our CRA and IRS tax dispute
This discussion of our expectations relating to our tax disputes with CRA and IRS and future tax reassessments by CRA and IRS is forward-looking information
that is based upon the assumptions and subject to the material risks discussed under the heading Caution about forward-looking information beginning on page 2 and also on the more specific assumptions and risks listed below. Actual outcomes
may vary significantly.
Assumptions
| • |
|
CRA will reassess us for the years 2011 through 2015 using a similar methodology as for the years 2003 through 2010, and the reassessments will be issued on the basis we expect |
| • |
|
we will be able to apply elective deductions and utilize letters of credit to the extent anticipated |
| • |
|
CRA will seek to impose transfer pricing penalties (in a manner consistent with penalties charged in the years 2007 through 2009) in addition to interest charges and instalment penalties |
| • |
|
we will be substantially successful in our dispute with CRA and the cumulative tax provision of $50 million to date will be adequate to satisfy any tax liability resulting from the outcome of the dispute to date
|
| • |
|
IRS may propose adjustments for later years subsequent to 2012 |
| • |
|
we will be substantially successful in our dispute with IRS
|
Material risks that could cause actual results to differ materially
| • |
|
CRA reassesses us for years 2011 through 2015 using a different methodology than for years 2003 through 2010, or we are unable to utilize elective deductions or letters of credit to the extent anticipated, resulting in
the required cash payments or security provided to CRA pending the outcome of the dispute being higher than expected |
| • |
|
the time lag for the reassessments for each year is different than we currently expect |
| • |
|
we are unsuccessful and the outcomes of our dispute with CRA and/or IRS result in significantly higher cash taxes, interest charges and penalties than the amount of our cumulative tax provision, which could have a
material adverse effect on our liquidity, financial position, results of operations and cash flows |
| • |
|
cash tax payable increases due to unanticipated adjustments by CRA or IRS not related to transfer pricing |
| • |
|
IRS proposes adjustments for years 2013 through 2015 using a different methodology than for 2009 through 2012 |
| • |
|
we are unable to effectively eliminate all double taxation |
OUTLOOK FOR 2016
On an adjusted net earnings basis, we expect a tax recovery of 25% to 30% in 2016 from our uranium, fuel services and NUKEM segments.
Our consolidated tax rate is a blend of the statutory rates applicable to taxable income earned or tax losses incurred in Canada and in our foreign
subsidiaries. We have a global customer base and we have established a marketing and trading structure involving foreign subsidiaries, which entered into various intercompany purchase and sale arrangements, as well as uranium purchase and sale
agreements with third parties. Cameco and its subsidiaries made reasonable efforts to put arm’s-length transfer pricing arrangements in place, and these arrangements expose the parties to the risks and rewards accruing to them under these
contracts. The intercompany contract prices are generally comparable to those established in comparable contracts between arm’s-length parties entered into at that time.
This year, many of the existing intercompany purchase and sale arrangements in our portfolio expire. We have started to replace these contracts and will
continue to put new intercompany arrangements in place, which, as the existing arrangements did, will reflect the market at the time they are signed.
MANAGEMENT’S
DISCUSSION AND ANALYSIS 33
As a result, in 2017, we expect our consolidated tax rate will transition to a modest expense, and trend toward a
tax expense of approximately 20% over the next five years. The actual effective tax rate will vary from year-to-year, primarily due to the actual distribution of earnings among jurisdictions and the market conditions at the time transactions occur
under both our intercompany and third-party purchase and sale arrangements.
FOREIGN EXCHANGE
The exchange rate between the Canadian dollar and US dollar affects the financial results of our uranium and fuel services segments.
We sell the majority of our uranium and fuel services products under long-term contracts, which are routinely denominated in US dollars, while our production
costs are largely denominated in Canadian dollars. To provide cash flow predictability and certainty as we undertake our operating and capital expenditures, we use hedging to try to protect our net exposure (e.g. total sales less US dollar expenses
and product purchases) against shorter term exchange rate volatility.
Our risk management policy permits us to hedge 35% to 100% of our expected net
exposure over a rolling 60-month period. Our normal practice is to hedge over a three- to four-year period by hedging 50% to 80% of net exposure in the first 12 months with decreasing hedge ratios in subsequent years. The actual hedge position is
reflected in Revenue, cash flow and earnings sensitivity analysis provided on page 35.
In the reporting period, some hedge contracts may be
settled and the remaining contracts outstanding, we mark-to-market, which can result in reported gains or losses on derivatives for the period depending on the movement in the US/Cdn exchange rate. In periods of rapid currency fluctuations, the
average exchange rate under our hedge contracts will lag the market. For example, the average US/Cdn exchange rate for our 2015 hedge position included exchange rates for periods prior to the rapid devaluation of the Canadian dollar and was much
lower than the average exchange rate for 2015. As a result, as a Canadian dollar reporter, we reported significant losses on derivatives in 2015. However, over time and as we add hedges at current market rates, we expect to realize the benefit of
the weak Canadian dollar as the average exchange rate under our hedge contracts increases. In the event of a rapidly appreciating Canadian dollar, we would see the opposite effect.
Since we use hedging to protect our foreign exchange exposure in a particular period, when we put contracts in place we designate them for use in that period.
Therefore, a portion of the reported gains and losses noted above do not apply in the current period. We take this into account in our adjusted net earnings measure, with the goal of better matching the benefits of our hedging activities with the
expected foreign currency exposure to which they apply. In our adjusted net earnings measure, we adjust net earnings in the reporting period for one-time items that are not representative of our ongoing operations and to:
| • |
|
remove mark-to-market gains or losses on the outstanding hedge position at the end of the period |
| • |
|
remove the portion of gains and losses on those contracts that were rolled over in the reporting period for use in a future period |
| • |
|
add back gains and losses previously removed and that apply to the current period |
At December 31, 2015:
| • |
|
The value of the US dollar relative to the Canadian dollar was $1.00 (US) for $1.38 (Cdn), up from $1.00 (US) for $1.16 (Cdn) at December 31, 2014. The exchange rate averaged $1.00 (US) for $1.28 (Cdn) over the
year. |
| • |
|
We had foreign currency forward contracts of $1.0 billion (US), EUR 12 million and foreign currency options of $250 million (US) at December 31, 2015. The US currency forward contracts had an average exchange
rate of $1.00 (US) for $1.23 (Cdn) and US currency option contracts had an average exchange rate range of $1.00 (US) for $1.28 to $1.34 (Cdn), and €1.00 for $1.11 (US) for EUR currency contracts. |
| • |
|
The mark-to-market loss on all foreign exchange contracts was $167 million compared to a $67 million loss at December 31, 2014. |
We manage counterparty risk associated with hedging by dealing with highly rated counterparties and limiting our exposure. At December 31, 2015, with the
exception of the EUR hedge, all of our counterparties to foreign exchange hedging contracts had a Standard & Poor’s (S&P) credit rating of A or better.
34 CAMECO
CORPORATION
Outlook for 2016
Our strategy is to focus on our tier-one assets and profitably produce at a pace aligned with market signals, while maintaining the ability to respond to
conditions as they evolve.
Our outlook for 2016 reflects the expenditures necessary to help us achieve our strategy. We do not provide an outlook for the
items in the table that are marked with a dash.
See 2015 Financial results by segment on page 43 for details.
2016 FINANCIAL OUTLOOK
|
|
|
|
|
|
|
|
|
|
|
|
|
|
|
|
|
| |
|
CONSOLIDATED |
|
|
URANIUM |
|
|
FUEL SERVICES |
|
|
NUKEM |
|
| Production |
|
|
— |
|
|
|
30.0
million lbs |
|
|
|
8 to 9
million kgU |
|
|
|
— |
|
| Delivery volume1 |
|
|
— |
|
|
|
30 to 32
million lbs |
2 |
|
|
Decrease
up to 5% |
|
|
|
9 to 10
million lbs U3O8 |
|
| Revenue compared to 20153 |
|
|
Decrease
up to 5% |
|
|
|
Decrease
up to 5% |
4 |
|
|
Increase
up to 5% |
|
|
|
Increase
5% to 10% |
|
| Average unit cost of sales (including D&A) |
|
|
— |
|
|
|
Increase
up to 5% |
5 |
|
|
Increase
10% to 15% |
|
|
|
— |
|
| Direct administration costs compared to 20156 |
|
|
Increase
5% to 10% |
|
|
|
— |
|
|
|
— |
|
|
|
— |
|
| Gross profit |
|
|
— |
|
|
|
— |
|
|
|
— |
|
|
|
Gross profit
4% to 5% |
|
| Exploration costs compared to 2015 |
|
|
— |
|
|
|
Increase
15% to 20% |
|
|
|
— |
|
|
|
— |
|
| Tax rate7 |
|
|
Recovery of
25% to 30% |
|
|
|
— |
|
|
|
— |
|
|
|
— |
|
|
|
|
|
|
| Capital expenditures |
|
$ |
320 million |
|
|
|
— |
|
|
|
— |
|
|
|
— |
|
| 1 |
Our 2016 outlook for delivery volume in our uranium and NUKEM segments does not include sales between our uranium, fuel services and NUKEM segments. |
| 2 |
Our uranium delivery volume is based on the volumes we currently have commitments to deliver under contract in 2016. |
| 3 |
For comparison of our 2016 outlook and 2015 results for revenue in our uranium and NUKEM segments, we do not include sales between our uranium, fuel services and NUKEM segments. |
| 4 |
Based on a uranium spot price of $34.65 (US) per pound (the Ux spot price as of February 1, 2016), a long-term price indicator of $44.00 (US) per pound (the Ux long-term indicator on January 25, 2016) and an
exchange rate of $1.00 (US) for $1.25 (Cdn). |
| 5 |
This increase is based on the unit cost of sales for produced material and committed long-term purchases. If we make discretionary purchases in 2016, then we expect the overall unit cost of sales may be affected.
|
| 6 |
Direct administration costs do not include stock-based compensation expenses. See page 28 for more information. |
| 7 |
Our outlook for the tax rate is based on adjusted net earnings. |
REVENUE, CASH FLOW AND EARNINGS
SENSITIVITY ANALYSIS
For 2016:
| • |
|
An increase of $5 (US) per pound in each of the Ux spot price ($34.65 (US) per pound on February 1, 2016) and the Ux long-term price indicator ($44.00 (US) per pound on January 25, 2016) would change revenue
by $72 million and net earnings by $56 million. Conversely, a decrease of $5 (US) per pound would decrease revenue by $69 million and net earnings by $54 million. |
| • |
|
A one cent change in the value of the Canadian dollar versus the US dollar would change adjusted net earnings by $8 million and cash flow by $1 million, with a decrease in the value of the Canadian dollar versus the US
dollar having a positive impact. |
PRICE SENSITIVITY ANALYSIS: URANIUM SEGMENT
The following table and graph are not forecasts of prices we expect to receive. The prices we actually realize will be different from the prices shown in the
table and graph. They are designed to indicate how the portfolio of long-term contracts we had in place on December 31, 2015 would respond to different spot prices. In other words, we would realize these prices only if the contract portfolio
remained the same as it was on December 31, 2015, and none of the assumptions we list below change.
We intend to update this table and graph each
quarter in our MD&A to reflect deliveries made and changes to our contract portfolio. As a result, we expect the table and graph to change from quarter to quarter.
MANAGEMENT’S
DISCUSSION AND ANALYSIS 35
Expected realized uranium price sensitivity under various spot price assumptions
(rounded to the nearest $1.00)
|
|
|
|
|
|
|
|
|
|
|
|
|
|
|
|
|
|
|
|
|
|
|
|
|
|
|
|
|
| SPOT PRICES
($US/lb U3O8) |
|
$20 |
|
|
$40 |
|
|
$60 |
|
|
$80 |
|
|
$100 |
|
|
$120 |
|
|
$140 |
|
| 2016 |
|
|
41 |
|
|
|
46 |
|
|
|
56 |
|
|
|
65 |
|
|
|
75 |
|
|
|
84 |
|
|
|
93 |
|
| 2017 |
|
|
39 |
|
|
|
46 |
|
|
|
56 |
|
|
|
67 |
|
|
|
78 |
|
|
|
87 |
|
|
|
94 |
|
| 2018 |
|
|
39 |
|
|
|
47 |
|
|
|
58 |
|
|
|
69 |
|
|
|
80 |
|
|
|
90 |
|
|
|
97 |
|
| 2019 |
|
|
39 |
|
|
|
47 |
|
|
|
59 |
|
|
|
70 |
|
|
|
79 |
|
|
|
88 |
|
|
|
94 |
|
| 2020 |
|
|
42 |
|
|
|
49 |
|
|
|
59 |
|
|
|
70 |
|
|
|
79 |
|
|
|
86 |
|
|
|
93 |
|
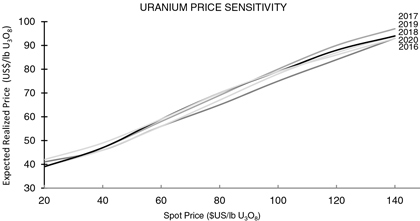
The table and graph illustrate the mix of long-term contracts in our December 31, 2015 portfolio, and are consistent
with our marketing strategy. Both have been updated to reflect deliveries made and contracts entered into up to December 31, 2015.
Our portfolio
includes a mix of fixed-price and market-related contracts, which we target at a 40:60 ratio. Those that are fixed at lower prices or have low ceiling prices will yield prices that are lower than current market prices.
Our portfolio is affected by more than just
the spot price. We made the following assumptions (which are not forecasts) to create the table:
Sales
| • |
|
sales volumes on average of 27 million pounds per year, with commitment levels in 2016 through 2018 higher than in 2019 and 2020 |
| • |
|
excludes sales between our uranium, fuel services and NUKEM segments |
Deliveries
| • |
|
deliveries include best estimates of requirements contracts and contracts with volume flex provisions
|
Annual inflation
Prices
| • |
|
the average long-term price indicator is the same as the average spot price for the entire year (a simplified approach for this purpose only). Since 1996, the long-term price indicator has averaged 19% higher than the
spot price. This differential has varied significantly. Assuming the long-term price is at a premium to spot, the prices in the table and graph will be higher.
|
36 CAMECO
CORPORATION
Liquidity and capital resources
At the end of 2015, we had cash and short-term investments of $459 million in a mix of short-term deposits and treasury bills, while our total debt amounted to
$1.5 billion.
We have large, creditworthy customers that continue to need uranium even during weak economic conditions, and we expect the uranium
contract portfolio we have built to provide a solid revenue stream for years to come.
We expect to continue investing in maintaining and prudently
expanding our production capacity over the next several years. We have a number of alternatives to fund future capital requirements, including using our current cash balances, drawing on our existing credit facilities, entering new credit
facilities, using our operating cash flow, and raising additional capital through debt or equity financings. We are always considering our financing options so we can take advantage of favourable market conditions when they arise. Due to the
cyclical nature of our business, we may need to temporarily draw on other short-term liquidity during the course of the year. However, apart from these short-term fluctuations, we expect our cash balances and operating cash flows will meet our
capital requirements during 2016, without the need for significant additional funding.
We have an ongoing dispute with CRA, see page 30 for more
information. Until this dispute is settled, we expect to pay cash or provide security in the form of letters of credit for future amounts owing to the Government of Canada for 50% of the cash taxes payable and the related interest and penalties. We
have provided an estimate of the amount and timing of the expected cash taxes and transfer pricing penalties paid, secured or owing in the table on page 32.
FINANCIAL CONDITION
|
|
|
|
|
|
|
|
|
| |
|
2015 |
|
|
2014 |
|
| Cash position ($ millions) |
|
|
459 |
|
|
|
567 |
|
| (cash and cash equivalents) |
|
|
| Cash provided by continuing operations ($ millions) |
|
|
450 |
|
|
|
480 |
|
| (net cash flow generated by our operating activities after changes in working capital) |
|
|
| Cash provided by operations/net debt |
|
|
44 |
% |
|
|
52 |
% |
| (net debt is total consolidated debt, less cash position) |
|
|
| Net debt/total capitalization |
|
|
16 |
% |
|
|
15 |
% |
| (total capitalization is net debt and equity) |
|
|
CREDIT RATINGS
The
credit ratings assigned to our securities by external ratings agencies are important to our ability to raise capital at competitive pricing to support our business operations. Our investment grade credit ratings reflect the current financial
strength of our company.
Third-party ratings for our commercial paper and senior debt as of December 31, 2015:
|
|
|
|
|
|
|
|
|
| SECURITY |
|
DBRS |
|
|
S&P |
|
| Commercial paper |
|
|
R-1 (low) |
|
|
|
A-1 (low) |
1 |
| Senior unsecured debentures |
|
|
A (low) |
|
|
|
BBB+ |
|
| Rating trend / rating outlook |
|
|
Negative |
|
|
|
Stable |
|
| 1 |
Canadian National Scale Rating. The Global Scale Rating is A-2. |
DBRS provides guidance for the outlook of the
assigned rating using the rating trend. The rating trend represents their assessment of the likelihood and direction that the rating could change in the future, should present tendencies continue, or in some cases, if challenges are not overcome.
S&P uses rating outlooks to assess the potential direction of a long-term credit rating over the intermediate term. Their outlook indicates the
likelihood that the rating could change in the future.
The rating agencies may revise or withdraw these ratings if they believe circumstances warrant. A
change in our credit ratings could affect our cost of funding and our access to capital through the capital markets.
MANAGEMENT’S
DISCUSSION AND ANALYSIS 37
Liquidity
|
|
|
|
|
|
|
|
|
| ($ MILLIONS) |
|
2015 |
|
|
2014 |
|
| Cash and cash equivalents at beginning of year |
|
|
567 |
|
|
|
188 |
|
|
|
|
|
|
|
|
|
|
| Cash from operations |
|
|
450 |
|
|
|
480 |
|
|
|
|
|
|
|
|
|
|
| Investment activities |
|
|
|
|
|
|
|
|
| Additions to property, plant and equipment and acquisitions |
|
|
(359 |
) |
|
|
(480 |
) |
| Discontinued operation |
|
|
— |
|
|
|
447 |
|
| Other investing activities |
|
|
18 |
|
|
|
12 |
|
|
|
|
|
|
|
|
|
|
| Financing activities |
|
|
|
|
|
|
|
|
| Change in debt |
|
|
— |
|
|
|
146 |
|
| Interest paid |
|
|
(70 |
) |
|
|
(78 |
) |
|
|
|
|
|
|
|
|
|
| Contributions from non-controlling interest |
|
|
— |
|
|
|
1 |
|
|
|
|
|
|
|
|
|
|
| Issue of shares |
|
|
— |
|
|
|
6 |
|
|
|
|
|
|
|
|
|
|
| Dividends |
|
|
(158 |
) |
|
|
(158 |
) |
|
|
|
|
|
|
|
|
|
| Exchange rate on changes on foreign currency cash balances |
|
|
11 |
|
|
|
3 |
|
|
|
|
|
|
|
|
|
|
| Cash and cash equivalents at end of year |
|
|
459 |
|
|
|
567 |
|
|
|
|
|
|
|
|
|
|
CASH FROM CONTINUING OPERATIONS
Cash from continuing operations was 6% lower than in 2014. This was primarily due to the settlement and rollover of contracts in our hedge portfolio which
required more cash during 2015 compared to 2014, largely due to the weakening Canadian dollar, offset by higher profits in all of our segments. Not including working capital requirements, our operating cash flows in the year were down $46 million.
See note 24 to the financial statements.
INVESTING ACTIVITIES
Cash used in investing includes acquisitions and capital spending.
Capital spending
We classify capital spending as
sustaining, capacity replacement or growth. As a mining company, sustaining capital is the money we spend to keep our facilities running in their present state, which would follow a gradually decreasing production curve, while capacity replacement
capital is spent to maintain current production levels at those operations. Growth capital is money we invest to generate incremental production, and for business development.
38 CAMECO
CORPORATION
|
|
|
|
|
|
|
|
|
|
|
|
|
| CAMECO’S SHARE ($ MILLIONS) |
|
2015 PLAN1 |
|
|
2015 ACTUAL |
|
|
2016 PLAN |
|
| Sustaining capital |
|
|
|
|
|
|
|
|
|
|
|
|
| McArthur River/Key Lake |
|
|
20 |
|
|
|
16 |
|
|
|
30 |
|
| Cigar Lake |
|
|
10 |
|
|
|
9 |
|
|
|
25 |
|
| Rabbit Lake |
|
|
35 |
|
|
|
33 |
|
|
|
25 |
|
| US ISR |
|
|
5 |
|
|
|
7 |
|
|
|
5 |
|
| Inkai |
|
|
5 |
|
|
|
1 |
|
|
|
5 |
|
| Fuel services |
|
|
15 |
|
|
|
13 |
|
|
|
20 |
|
| Other |
|
|
5 |
|
|
|
5 |
|
|
|
5 |
|
|
|
|
|
|
|
|
|
|
|
|
|
|
| Total sustaining capital |
|
|
95 |
|
|
|
84 |
|
|
|
115 |
|
|
|
|
|
|
|
|
|
|
|
|
|
|
| Capacity replacement capital |
|
|
|
|
|
|
|
|
|
|
|
|
| McArthur River/Key Lake |
|
|
95 |
|
|
|
96 |
|
|
|
55 |
|
| Cigar Lake |
|
|
25 |
|
|
|
26 |
|
|
|
20 |
|
| Rabbit Lake |
|
|
— |
|
|
|
— |
|
|
|
10 |
|
| US ISR |
|
|
30 |
|
|
|
27 |
|
|
|
20 |
|
| Inkai |
|
|
15 |
|
|
|
19 |
|
|
|
15 |
|
|
|
|
|
|
|
|
|
|
|
|
|
|
| Total capacity replacement capital |
|
|
165 |
|
|
|
168 |
|
|
|
120 |
|
|
|
|
|
|
|
|
|
|
|
|
|
|
| Growth capital |
|
|
|
|
|
|
|
|
|
|
|
|
| McArthur River/Key Lake |
|
|
15 |
|
|
|
13 |
|
|
|
40 |
|
| Cigar Lake |
|
|
90 |
|
|
|
81 |
|
|
|
30 |
|
| Inkai |
|
|
15 |
|
|
|
11 |
|
|
|
10 |
|
| Fuel services |
|
|
5 |
|
|
|
1 |
|
|
|
5 |
|
| Other |
|
|
— |
|
|
|
1 |
|
|
|
— |
|
|
|
|
|
|
|
|
|
|
|
|
|
|
| Total growth capital |
|
|
125 |
|
|
|
107 |
|
|
|
85 |
|
|
|
|
|
|
|
|
|
|
|
|
|
|
| Total uranium & fuel services |
|
|
385 |
1 |
|
|
359 |
|
|
|
320 |
|
|
|
|
|
|
|
|
|
|
|
|
|
|
| 1 |
Capital spending outlook was updated to $385 million in our third quarter MD&A. |
Outlook for investing
activities
|
|
|
|
|
|
|
|
|
| CAMECO’S SHARE ($ MILLIONS) |
|
2017 PLAN |
|
|
2018 PLAN |
|
| Total uranium & fuel services |
|
|
300-350 |
|
|
|
250-300 |
|
|
|
|
|
|
|
|
|
|
| Sustaining capital |
|
|
135-155 |
|
|
|
95-110 |
|
| Capacity replacement capital |
|
|
135-150 |
|
|
|
145-160 |
|
| Growth capital |
|
|
30-45 |
|
|
|
10-25 |
|
We expect total capital expenditures for uranium and fuel services to decrease by about 11% in 2016.
Major sustaining, capacity replacement and growth expenditures in 2016 include:
| • |
|
McArthur River/Key Lake – At McArthur River, the largest projects are the expansion of freeze capacity and mine development. Other projects include site facility and equipment purchases. At Key Lake, work will be
done to expand capacity in the solvent extraction and crystallization circuits of the mill. |
| • |
|
US in situ recovery (ISR) – wellfield construction represents the largest portion of our expenditures in the US. |
| • |
|
Rabbit Lake – At Eagle Point, the largest component is mine development, along with mine equipment upgrades and purchases. At the mill, we plan to optimize tailings capacity and work on various mill facility and
equipment replacements. |
| • |
|
Cigar Lake – Work to expand freezing capacity makes up the largest portion of capital at the Cigar Lake site. We are also paying our share of the costs to modify and expand the McClean Lake mill. |
We previously expected to spend between $350 million and $400 million in 2017. We now expect to spend between $300 million and $350 million in 2017. Due to
the continued market uncertainty, we have reduced growth capital to focus on our tier-one properties.
This information regarding currently expected
capital expenditures for future periods is forward-looking information, and is based upon the assumptions and subject to the material risks discussed on pages 2 and 3. Our actual capital expenditures for future periods may be significantly
different.
MANAGEMENT’S
DISCUSSION AND ANALYSIS 39
FINANCING ACTIVITIES
Cash from financing includes borrowing and repaying debt, and other financial transactions including paying dividends and providing financial assurance.
Long-term contractual obligations
|
|
|
|
|
|
|
|
|
|
|
|
|
|
|
|
|
|
|
|
|
| |
|
2016 |
|
|
2017 AND
2018 |
|
|
2019 AND
2020 |
|
|
2021 AND
BEYOND |
|
|
TOTAL |
|
| DECEMBER 31 ($ MILLIONS) |
|
|
|
|
|
| Long-term debt |
|
|
— |
|
|
|
— |
|
|
|
500 |
|
|
|
1,000 |
|
|
|
1,500 |
|
| Interest on long-term debt |
|
|
69 |
|
|
|
139 |
|
|
|
110 |
|
|
|
226 |
|
|
|
544 |
|
| Provision for reclamation |
|
|
13 |
|
|
|
80 |
|
|
|
81 |
|
|
|
801 |
|
|
|
975 |
|
| Provision for waste disposal |
|
|
3 |
|
|
|
14 |
|
|
|
— |
|
|
|
— |
|
|
|
17 |
|
| Other liabilities |
|
|
— |
|
|
|
— |
|
|
|
— |
|
|
|
64 |
|
|
|
64 |
|
| Capital commitments |
|
|
55 |
|
|
|
— |
|
|
|
— |
|
|
|
— |
|
|
|
55 |
|
|
|
|
|
|
|
|
|
|
|
|
|
|
|
|
|
|
|
|
|
|
| Total |
|
|
140 |
|
|
|
233 |
|
|
|
691 |
|
|
|
2,091 |
|
|
|
3,155 |
|
|
|
|
|
|
|
|
|
|
|
|
|
|
|
|
|
|
|
|
|
|
We have contractual capital commitments of approximately $55 million at December 31, 2015. Certain of the contractual
commitments may contain cancellation clauses; however, we disclose the commitments based on management’s intent to fulfil the contracts.
We have
unsecured lines of credit of about $2.7 billion, which include the following:
| • |
|
A $1.25 billion unsecured revolving credit facility that matures November 1, 2019. Each year on the anniversary date, and upon mutual agreement, the facility can be extended for an additional year. In addition to
borrowing directly from this facility, we can use up to $100 million of it to issue letters of credit and we may use it to provide liquidity for our commercial paper program, as necessary. We may increase the revolving credit facility above $1.25
billion, by increments of no less than $50 million, up to a total of $1.75 billion. The facility ranks equally with all of our other senior debt. At December 31, 2015, there were no amounts outstanding under this facility. |
| • |
|
Approximately $1.4 billion in letters of credit provided by various financial institutions. We use these facilities mainly to provide financial assurance for future decommissioning and reclamation of our operating
sites, for our obligations relating to the CRA dispute, and as overdraft protection. At December 31, 2015, we had approximately $1.4 billion outstanding in letters of credit. |
In total we have $1.5 billion in senior unsecured debentures outstanding:
| • |
|
$500 million bearing interest at 5.67% per year, maturing on September 2, 2019 |
| • |
|
$400 million bearing interest at 3.75% per year, maturing on November 14, 2022 |
| • |
|
$500 million bearing interest at 4.19% per year, maturing on June 24, 2024 |
| • |
|
$100 million bearing interest at 5.09% per year, maturing on November 14, 2042 |
Debt covenants
Our revolving credit facility includes the following financial covenants:
| • |
|
our funded debt to tangible net worth ratio must be 1:1 or less |
| • |
|
other customary covenants and events of default |
Funded debt is total consolidated debt less the following:
non-recourse debt, $100 million in letters of credit, cash and short-term investments.
Not complying with any of these covenants could result in
accelerated payment and termination of our revolving credit facility. At December 31, 2015, we complied with all covenants, and we expect to continue to comply in 2016.
40 CAMECO
CORPORATION
NUKEM financing arrangements
NUKEM enters into financing arrangements with third parties where future receivables arising from certain sales contracts are sold to financial institutions in
exchange for cash. These arrangements require NUKEM to satisfy its delivery obligations under the sales contracts, which are recognized as deferred sales (see notes 8 and 16 to the financial statements for more information). In addition, NUKEM is
required to pledge the underlying inventory as security against these performance obligations. As of December 31, 2015, we had $97.9 million ($70.8 million (US)) of inventory pledged as security under financing arrangements, compared with $94.4
million ($81.4 million (US)) at December 31, 2014.
OFF-BALANCE SHEET ARRANGEMENTS
We had three kinds of off-balance sheet arrangements at the end of 2015:
Purchase commitments
The table below is based on our purchase commitments at December 31, 2015. These commitments include a mix of fixed price and market-related contracts,
and are with entities that buy and sell uranium and uranium-related products. Actual payments will be different as a result of changes to our purchase commitments and, in the case of contracts with market-related pricing, the market prices in effect
at the time of purchase. We will update this table as required in our MD&A to reflect changes to our purchase commitments and changes in the prices used to estimate our commitments under market-related contracts.
|
|
|
|
|
|
|
|
|
|
|
|
|
|
|
|
|
|
|
|
|
| |
|
2016 |
|
|
2017 AND
2018 |
|
|
2019 AND
2020 |
|
|
2021 AND
BEYOND |
|
|
TOTAL |
|
| DECEMBER 31 ($ MILLIONS) |
|
|
|
|
|
| Purchase commitments1 |
|
|
1,036 |
|
|
|
862 |
|
|
|
391 |
|
|
|
403 |
|
|
|
2,692 |
|
| 1 |
Denominated in US dollars, converted to Canadian dollars as of December 31, 2015 at the rate of $1.38. |
At the end of 2015, we had committed to $2.7 billion (Cdn) for the following:
| • |
|
approximately 38 million pounds of U3O8 equivalent from 2016 to 2028 |
| • |
|
approximately 4 million kgU as UF6 in conversion services from 2016 to 2019 |
| • |
|
about 1 million Separative Work Units (SWU) of enrichment services to meet existing forward sales commitments under agreements with a non-Western supplier |
The suppliers do not have the right to terminate agreements other than pursuant to customary events of default provisions.
Financial assurances
Standby letters of credit mainly
provide financial assurance for the decommissioning and reclamation of our mining and conversion facilities as well as for our obligations relating to the CRA dispute. We are required to provide letters of credit to various regulatory agencies until
decommissioning and reclamation activities are complete. We are also planning to provide letters of credit until the CRA dispute is resolved. Letters of credit are issued by financial institutions for a one-year term. At December 31, 2015 our
financial assurances totaled $1.4 billion compared to $0.9 billion at December 31, 2014. The increase is mainly due to:
| • |
|
increased requirements for decommissioning letters of credit for Key Lake ($80 million) |
| • |
|
obligations relating to the CRA dispute ($332 million) |
| • |
|
exchange rate fluctuations ($65 million) |
Other arrangements
We entered into a factoring arrangement where receivables arising from certain sales contracts are sold to a financial institution. Upon the sale, we assign
the rights to the accounts receivable to the financial institution without recourse. This arrangement provides immediate access to cash and requires we collect payment from our customers and remit the payments to the financial institution. Expenses
incurred under the arrangement are recognized within finance costs in the consolidated statement of earnings.
MANAGEMENT’S
DISCUSSION AND ANALYSIS 41
In addition, NUKEM enters into arrangements with third parties where receivables arising from certain sales
contracts are sold to financial institutions in exchange for cash. Upon the sale, NUKEM assigns the rights to the accounts receivable to the financial institution without recourse. These arrangements require NUKEM to satisfy its delivery obligations
under the sales contracts; however, the customer is responsible for making payment directly to the financial institution. The discount at which the financial institution purchases the receivable is offset against the revenue NUKEM records on
delivery of the product to the customer.
BALANCE SHEET
|
|
|
|
|
|
|
|
|
|
|
|
|
|
|
|
|
| DECEMBER 31,
($ MILLIONS EXCEPT PER SHARE AMOUNTS) |
|
2015 |
|
|
2014 |
|
|
2013 |
|
|
CHANGE
2014 TO 2015 |
|
| |
|
|
|
| Inventory |
|
|
1,285 |
|
|
|
902 |
|
|
|
913 |
|
|
|
42 |
% |
| Total assets |
|
|
8,795 |
|
|
|
8,473 |
|
|
|
8,039 |
|
|
|
4 |
% |
| Long-term financial liabilities |
|
|
2,500 |
|
|
|
2,448 |
|
|
|
1,915 |
|
|
|
2 |
% |
| Dividends per common share |
|
|
0.40 |
|
|
|
0.40 |
|
|
|
0.40 |
|
|
|
— |
|
Total product inventories increased by 42% to $1.3 billion this year due to higher levels of inventory for our uranium
segment, where the quantities sold were lower than the quantities produced and purchased for the year. In 2015, total volume of product inventories for our uranium segment increased by 54%. During the year, we had the opportunity to purchase
material at favourable prices, which added to our inventory position. In addition, the average cost of inventory increased by 15% due to the high cost of Cigar Lake production as it ramps up and the cost of material purchased during the year that
was higher than the average cost of inventory at the beginning of the year. At December 31, 2015, our average cost for uranium was $36.72 per pound, up from $32.00 per pound at December 31, 2014.
At the end of 2015, our total assets amounted to $8.8 billion, an increase of $0.3 billion compared to 2014, primarily due to higher inventory and an increase
in our deferred tax assets. In 2014, the total asset balance increased by $0.4 billion compared to 2013, primarily due to higher deferred tax assets and an increase in long-term receivables related to our CRA litigation.
The major components of long-term financial liabilities are long-term debt, the provision for reclamation, deferred sales and financial derivatives. In 2015,
our balance did not change significantly. In 2014, our balance increased by $0.5 billion due to the early redemption of our Series C debentures and the issuance of the Series G debentures, as well as an increase in deferred sales.
42 CAMECO
CORPORATION
2015 financial results by segment
Uranium
|
|
|
|
|
|
|
|
|
|
|
|
|
|
|
|
|
| HIGHLIGHTS |
|
|
|
|
2015 |
|
|
2014 |
|
|
CHANGE |
|
| Production volume (million lbs) |
|
|
|
|
|
|
28.4 |
|
|
|
23.3 |
|
|
|
22 |
% |
|
|
|
|
|
|
|
|
|
|
|
|
|
|
|
|
|
| Sales volume (million lbs)1 |
|
|
|
|
|
|
32.4 |
|
|
|
33.9 |
|
|
|
(4 |
)% |
|
|
|
|
|
|
|
|
|
|
|
|
|
|
|
|
|
| Average spot price |
|
($ |
US/lb |
) |
|
|
36.55 |
|
|
|
33.21 |
|
|
|
10 |
% |
| Average long-term price |
|
($ |
US/lb |
) |
|
|
46.29 |
|
|
|
46.46 |
|
|
|
— |
|
| Average realized price |
|
($ |
US/lb |
) |
|
|
45.19 |
|
|
|
47.53 |
|
|
|
(5 |
)% |
|
|
($ |
Cdn/lb |
) |
|
|
57.58 |
|
|
|
52.37 |
|
|
|
10 |
% |
|
|
|
|
|
|
|
|
|
|
|
|
|
|
|
|
|
| Average unit cost of sales (including D&A) |
|
($ |
Cdn/lb |
) |
|
|
38.83 |
|
|
|
34.64 |
|
|
|
12 |
% |
|
|
|
|
|
|
|
|
|
|
|
|
|
|
|
|
|
| Revenue ($ millions)1 |
|
|
|
|
|
|
1,866 |
|
|
|
1,777 |
|
|
|
5 |
% |
|
|
|
|
|
|
|
|
|
|
|
|
|
|
|
|
|
| Gross profit ($ millions) |
|
|
|
|
|
|
608 |
|
|
|
602 |
|
|
|
1 |
% |
|
|
|
|
|
|
|
|
|
|
|
|
|
|
|
|
|
| Gross profit (%) |
|
|
|
|
|
|
33 |
|
|
|
34 |
|
|
|
(3 |
)% |
|
|
|
|
|
|
|
|
|
|
|
|
|
|
|
|
|
| 1 |
Includes sales and revenue between our uranium, fuel services and NUKEM segments (32,000 pounds in sales and revenue of $1.0 million in 2015, 1.4 million pounds in sales and revenue of $48 million in 2014).
|
Production volumes in 2015 increased by 22% compared to 2014. Lower production at our US ISR operations was more than offset by the rampup
of Cigar Lake production. See Uranium – production overview on page 54 for more information.
Uranium revenues this year were up 5% compared
to 2014 due to an increase of 10% in the Canadian dollar average realized price, partially offset by a decrease in sales volumes of 4%. The spot price for uranium averaged $36.55 (US) per pound in 2015, an increase of 10% compared to the 2014
average price of $33.21 (US) per pound; however, our US dollar average realized price was lower mainly due to lower prices under fixed price contracts. The effect of foreign exchange resulted in a higher Canadian dollar average realized price than
in the prior year. The realized foreign exchange rate was $1.27 compared to $1.10 in 2014.
Total cost of sales (including D&A) increased by 7% ($1.26
billion compared to $1.18 billion in 2014) due to higher unit cost of sales offset by lower sales volumes. The higher unit cost of sales was mainly the result of an increase in the volume of material purchased at prices higher than our average cost
of inventory, and an increase in unit production costs related to the addition of higher costs from Cigar Lake during rampup.
The net effect was a $6
million increase in gross profit for the year.
The following table shows the costs of produced and purchased uranium incurred in the reporting periods
(non-IFRS measures, see below). These costs do not include selling costs such as royalties, transportation and commissions, nor do they reflect the impact of opening inventories on our reported cost of sales.
|
|
|
|
|
|
|
|
|
|
|
|
|
| ($CDN/LB) |
|
2015 |
|
|
2014 |
|
|
CHANGE |
|
| Produced |
|
|
|
|
|
|
|
|
|
|
|
|
| Cash cost |
|
|
20.62 |
|
|
|
18.66 |
|
|
|
11 |
% |
| Non-cash cost |
|
|
11.51 |
|
|
|
9.30 |
|
|
|
24 |
% |
|
|
|
|
|
|
|
|
|
|
|
|
|
| Total production cost |
|
|
32.13 |
|
|
|
27.96 |
|
|
|
15 |
% |
|
|
|
|
|
|
|
|
|
|
|
|
|
| Quantity produced (million lbs) |
|
|
28.4 |
|
|
|
23.3 |
|
|
|
22 |
% |
|
|
|
|
|
|
|
|
|
|
|
|
|
| Purchased |
|
|
|
|
|
|
|
|
|
|
|
|
| Cash cost1 |
|
|
46.02 |
|
|
|
38.17 |
|
|
|
21 |
% |
|
|
|
|
|
|
|
|
|
|
|
|
|
| Quantity purchased (million lbs) |
|
|
12.5 |
|
|
|
7.1 |
|
|
|
76 |
% |
|
|
|
|
|
|
|
|
|
|
|
|
|
| Totals |
|
|
|
|
|
|
|
|
|
|
|
|
| Produced and purchased costs1 |
|
|
36.38 |
|
|
|
30.34 |
|
|
|
20 |
% |
|
|
|
|
|
|
|
|
|
|
|
|
|
| Quantities produced and purchased (million lbs) |
|
|
40.9 |
|
|
|
30.4 |
|
|
|
35 |
% |
|
|
|
|
|
|
|
|
|
|
|
|
|
| 1 |
Cash costs of purchased material in 2015 were $36.57 (US) per pound compared to $34.51 (US) per pound in 2014. In 2015, the exchange rate on purchases averaged $1.00 (US) for $1.26 (Cdn) compared to $1.00 (US) for $1.11
(Cdn) in 2014. |
MANAGEMENT’S
DISCUSSION AND ANALYSIS 43
Cash cost per pound, non-cash cost per pound and total cost per pound for produced and purchased uranium
presented in the above table are non-IFRS measures. These measures do not have a standardized meaning or a consistent basis of calculation under IFRS. We use these measures in our assessment of the performance of our uranium business. We believe
that, in addition to conventional measures prepared in accordance with IFRS, certain investors use this information to evaluate our performance and ability to generate cash flow.
These measures are non-standard supplemental information and should not be considered in isolation or as a substitute for measures of performance prepared
according to accounting standards. These measures are not necessarily indicative of operating profit or cash flow from operations as determined under IFRS. Other companies may calculate these measures differently, so you may not be able to make a
direct comparison to similar measures presented by other companies.
To facilitate a better understanding of these measures, the following table presents
a reconciliation of these measures to our unit cost of sales for the years ended 2015 and 2014 as reported in our financial statements.
CASH AND TOTAL
COST PER POUND RECONCILIATION
|
|
|
|
|
|
|
|
|
| |
|
| ($ MILLIONS) |
|
2015 |
|
|
2014 |
|
| Cost of product sold |
|
|
989.2 |
|
|
|
902.8 |
|
| Add / (subtract) |
|
|
|
|
|
|
|
|
| Royalties |
|
|
(116.5 |
) |
|
|
(91.2 |
) |
| Standby charges |
|
|
— |
|
|
|
(24.8 |
) |
| Other selling costs |
|
|
(13.8 |
) |
|
|
(9.0 |
) |
| Change in inventories |
|
|
301.8 |
|
|
|
(71.9 |
) |
|
|
|
|
|
|
|
|
|
| Cash operating costs (a) |
|
|
1,160.7 |
|
|
|
705.9 |
|
| Add / (subtract) |
|
|
|
|
|
|
|
|
| Depreciation and amortization |
|
|
269.1 |
|
|
|
272.6 |
|
| Change in inventories |
|
|
58.1 |
|
|
|
(56.2 |
) |
|
|
|
|
|
|
|
|
|
| Total operating costs (b) |
|
|
1,487.9 |
|
|
|
922.3 |
|
|
|
|
|
|
|
|
|
|
| Uranium produced & purchased (million lbs) (c) |
|
|
40.9 |
|
|
|
30.4 |
|
|
|
|
|
|
|
|
|
|
| Cash costs per pound (a ÷ c) |
|
|
28.38 |
|
|
|
23.22 |
|
| Total costs per pound (b ÷ c) |
|
|
36.38 |
|
|
|
30.34 |
|
|
|
|
|
|
|
|
|
|
URANIUM SEGMENT OUTLOOK
We expect to produce 30.0 million pounds in 2016 and have commitments under long-term contracts to purchase approximately 9 million pounds.
Based on the contracts we have in place, and not including sales between our segments, we expect to deliver between 30 million and 32 million pounds
of U3O8 in 2016. We expect the unit cost of sales to be up to 5% higher than in 2015, primarily due to the planned purchases during the
year. If we make additional discretionary purchases in 2016 at a cost different than our other sources of supply, then we expect the overall unit cost of sales to be affected.
We expect revenue to be up to 5% lower than in 2015 as a result of an expected decrease in deliveries, not including sales between our segments, partially
offset by a higher average realized price.
ROYALTIES
We pay royalties on the sale of all uranium extracted at our mines in the province of Saskatchewan. Two types of royalties are paid:
| • |
|
Basic royalty: calculated as 5% of gross sales of uranium, less the Saskatchewan resource credit of 0.75%. |
| • |
|
Profit royalty: a 10% royalty is charged on profit up to and including $22.70/kg U3O8 ($10.30/lb)
and a 15% royalty is charged on profit in excess of $22.70/kg U3O8. Profit is determined as revenue less certain operating, exploration,
reclamation and capital costs. Both exploration and capital costs are deductible at the discretion of the producer. |
As a resource
corporation in Saskatchewan, we also pay a corporate resource surcharge of 3% of the value of resource sales.
44 CAMECO
CORPORATION
During the period from 2013 to 2015, transitional rules for the new profit royalty regime were applied whereby
only 50% of capital costs were deductible. The remaining 50% was accumulated and will now be deductible beginning in 2016. In addition, the capital allowance related to Cigar Lake under the previous system was grandfathered and is also now
deductible beginning in 2016. Based on the expected application of transitional and grandfathered capital allowance deductions, we anticipate that only the first tier of the profit royalty (10%) will apply in 2016 and 2017. As capital pools are
depleted, we expect to also be subject to the top tier of the profit royalty (15%) in 2018.
Fuel services
(includes results for UF6, UO2 and fuel
fabrication)
|
|
|
|
|
|
|
|
|
|
|
|
|
|
|
| HIGHLIGHTS |
|
|
|
2015 |
|
|
2014 |
|
|
CHANGE |
|
| Production volume (million kgU) |
|
|
|
|
9.7 |
|
|
|
11.6 |
|
|
|
(16 |
)% |
| Sales volume (million kgU)1 |
|
|
|
|
13.6 |
|
|
|
15.5 |
|
|
|
(12 |
)% |
| Average realized price |
|
($Cdn/kgU) |
|
|
23.37 |
|
|
|
19.70 |
|
|
|
19 |
% |
| Average unit cost of sales (including D&A) |
|
($Cdn/kgU) |
|
|
18.87 |
|
|
|
17.24 |
|
|
|
9 |
% |
| Revenue ($ millions)1 |
|
|
|
|
319 |
|
|
|
306 |
|
|
|
4 |
% |
| Gross profit ($ millions) |
|
|
|
|
61 |
|
|
|
38 |
|
|
|
61 |
% |
| Gross profit (%) |
|
|
|
|
19 |
|
|
|
12 |
|
|
|
58 |
% |
| 1 |
Includes sales and revenue between our uranium, fuel services and NUKEM segments (339,000 kgU in sales and revenue of $2.9 million in 2015, 0.5 million kgU in sales and revenue of $4 million in 2014).
|
Total revenue increased by 4% due to a 19% increase in the realized price, partially offset by a 12% decrease in sales volumes.
The total cost of products and services sold (including D&A) decreased by 4% compared to 2014 ($258 million compared to $268 million in 2014), as a 12%
decrease in sales volumes was partially offset by a 9% increase in the average unit cost of sales (including D&A). When compared to 2014, the average unit cost of sales was 9% higher due to the mix of fuel services products sold.
The net effect was a $23 million increase in gross profit.
FUEL SERVICES OUTLOOK
In 2016, we plan to produce
8 million to 9 million kgU, and we expect sales volumes, not including intersegment sales, to be up to 5% lower than in 2015. Overall revenue is expected to increase by up to 5% as lower sales volumes will be more than offset by an
increase in the average realized price. We expect the average unit cost of sales (including D&A) to increase by 10% to 15%; therefore, overall gross profit will decrease as a result.
NUKEM
|
|
|
|
|
|
|
|
|
|
|
|
|
|
|
| HIGHLIGHTS |
|
|
|
2015 |
|
|
2014 |
|
|
CHANGE |
|
| Sales volume U3O8
(million lbs)1 |
|
|
|
|
10.7 |
|
|
|
8.1 |
|
|
|
32 |
% |
| Average realized price |
|
($Cdn/lb) |
|
|
48.82 |
|
|
|
44.90 |
|
|
|
9 |
% |
| Cost of product sold (including D&A) |
|
|
|
|
512 |
|
|
|
327 |
|
|
|
57 |
% |
| Revenue ($ millions)1 |
|
|
|
|
554 |
|
|
|
349 |
|
|
|
59 |
% |
| Gross profit ($ millions) |
|
|
|
|
42 |
|
|
|
22 |
|
|
|
91 |
% |
| Gross profit (%) |
|
|
|
|
8 |
|
|
|
6 |
|
|
|
33 |
% |
| 1 |
Includes sales and revenue between our uranium, fuel services and NUKEM segments (0.9 million pounds in sales and revenue of $19.3 million in 2015, 1.1 million pounds in sales and revenue of $43 million in 2014).
|
During 2015, NUKEM delivered 10.7 million pounds of uranium, an increase of 2.6 million pounds compared to the previous year due
to an increase in market activity. Revenues from NUKEM amounted to $554 million, 59% higher than in 2014 as a result of higher sales volumes and an increase in the average realized price, mainly due to weakening of the Canadian dollar. Gross profit
percentage was 8% for 2015, compared to 6% for 2014.
The net effect was a $20 million increase in gross profit.
NUKEM OUTLOOK
For 2016, NUKEM expects to deliver between
9 million and 10 million pounds of uranium. Total revenue and unit cost of sales, not including intersegment sales, is expected to increase by 5% to 10% compared to 2015; however, the overall gross profit percentage is expected to be
slightly lower than 2015 at 4% to 5%.
MANAGEMENT’S
DISCUSSION AND ANALYSIS 45
Fourth quarter financial results
Consolidated results
|
|
|
|
|
|
|
|
|
|
|
|
|
| |
|
THREE MONTHS ENDED |
|
|
|
|
| HIGHLIGHTS |
|
DECEMBER 31 |
|
|
|
|
| ($ MILLIONS EXCEPT WHERE INDICATED) |
|
2015 |
|
|
2014 |
|
|
CHANGE |
|
| Revenue |
|
|
975 |
|
|
|
889 |
|
|
|
10 |
% |
| Gross profit |
|
|
282 |
|
|
|
251 |
|
|
|
12 |
% |
| Net earnings (loss) attributable to equity holders |
|
|
(10 |
) |
|
|
73 |
|
|
|
(114 |
)% |
| $ per common share (basic) |
|
|
(0.03 |
) |
|
|
0.18 |
|
|
|
(114 |
)% |
| $ per common share (diluted) |
|
|
(0.03 |
) |
|
|
0.18 |
|
|
|
(114 |
)% |
| Adjusted net earnings (non-IFRS, see page 25) |
|
|
151 |
|
|
|
205 |
|
|
|
(26 |
)% |
| $ per common share (adjusted and diluted) |
|
|
0.38 |
|
|
|
0.52 |
|
|
|
(27 |
)% |
| Cash provided by operations (after working capital changes) |
|
|
503 |
|
|
|
236 |
|
|
|
113 |
% |
NET EARNINGS
In the
fourth quarter of 2015, our net loss was $10 million ($(0.03) per share diluted), a decrease of $83 million compared to net earnings of $73 million ($0.18 per share diluted) in 2014, mainly due to:
| • |
|
greater losses on foreign exchange derivatives resulting from the weakening of the Canadian dollar |
| • |
|
lower income tax recovery due to the reduction of our deferred tax asset in the US |
| • |
|
higher impairment charges in 2015 ($210 million in 2015, $131 million in 2014) |
partially offset by:
| • |
|
higher uranium gross profits resulting mainly from a higher average realized price and higher sales volumes |
| • |
|
higher gross profits from our fuel services segment due to a higher average realized price |
| • |
|
lower exploration expenditures |
| • |
|
the reduction of our provision related to the CRA litigation |
In addition, in the fourth quarter of 2014 there
was a favourable settlement of $37 million with respect to a dispute regarding a long-term supply contract with a utility customer that contributed to the higher net earnings in the fourth quarter of 2014 compared to the same period in 2015. The
impact of the settlement was partially offset by the write-off of $41 million of assets under construction as a result of changes made to the scope of a number of projects in the fourth quarter of 2014.
ADJUSTED NET EARNINGS
On an adjusted basis, our earnings
this quarter were $151 million ($0.38 per share diluted) compared to $205 million ($0.52 per share diluted) (non-IFRS measure, see page 25) in 2014, mainly due to:
| • |
|
a lower income tax recovery primarily due to the reduction of our deferred tax asset in the US |
partially
offset by:
| • |
|
higher uranium gross profits resulting mainly from a higher average realized price and higher sales volumes |
| • |
|
higher gross profits from our fuel services segment mainly due to a higher average realized price |
| • |
|
lower exploration expenditures |
| • |
|
the reduction of our provision related to the CRA litigation |
In addition, in the fourth quarter of 2014 there
was a favourable settlement of $37 million with respect to a dispute regarding a long-term supply contract with a utility customer that contributed to the higher adjusted net earnings in the fourth quarter of 2014 compared to the same period in
2015.
46 CAMECO
CORPORATION
We use adjusted net earnings, a non-IFRS measure, as a more meaningful way to compare our financial performance
from period to period. See page 25 for more information. The following table reconciles adjusted net earnings with our net earnings.
|
|
|
|
|
|
|
|
|
| |
|
THREE MONTHS ENDED
DECEMBER 31 |
|
| ($ MILLIONS) |
|
2015 |
|
|
2014 |
|
| Net earnings (loss) attributable to equity holders |
|
|
(10 |
) |
|
|
73 |
|
|
|
|
|
|
|
|
|
|
| Adjustments |
|
|
|
|
|
|
|
|
| Adjustments on derivatives (pre-tax) |
|
|
10 |
|
|
|
10 |
|
| NUKEM purchase price inventory recovery |
|
|
— |
|
|
|
(4 |
) |
| Impairment charges |
|
|
210 |
|
|
|
131 |
|
| Income taxes on adjustments |
|
|
(59 |
) |
|
|
(46 |
) |
| Write-off of assets |
|
|
— |
|
|
|
41 |
|
|
|
|
|
|
|
|
|
|
| Adjusted net earnings |
|
|
151 |
|
|
|
205 |
|
|
|
|
|
|
|
|
|
|
ADMINISTRATION
|
|
|
|
|
|
|
|
|
|
|
|
|
| |
|
THREE MONTHS ENDED
DECEMBER 31 |
|
|
|
|
| ($ MILLIONS) |
|
2015 |
|
|
2014 |
|
|
CHANGE |
|
| Direct administration |
|
|
51 |
|
|
|
52 |
|
|
|
(2 |
)% |
| Stock-based compensation |
|
|
4 |
|
|
|
3 |
|
|
|
33 |
% |
|
|
|
|
|
|
|
|
|
|
|
|
|
| Total administration |
|
|
55 |
|
|
|
55 |
|
|
|
— |
|
|
|
|
|
|
|
|
|
|
|
|
|
|
Direct administration costs were $51 million in the quarter, $1 million lower than the same period last year due to the timing
of expenditures, partially offset by higher legal costs as our CRA dispute progresses toward trial. Stock-based compensation expenses were $1 million higher than the fourth quarter of 2014. See note 25 to the financial statements.
Quarterly trends
|
|
|
|
|
|
|
|
|
|
|
|
|
|
|
|
|
|
|
|
|
|
|
|
|
|
|
|
|
|
|
|
|
| HIGHLIGHTS |
|
2015 |
|
|
2014 |
|
| ($ MILLIONS EXCEPT PER SHARE AMOUNTS) |
|
Q4 |
|
|
Q3 |
|
|
Q2 |
|
|
Q1 |
|
|
Q4 |
|
|
Q3 |
|
|
Q2 |
|
|
Q1 |
|
| Revenue |
|
|
975 |
|
|
|
649 |
|
|
|
565 |
|
|
|
566 |
|
|
|
889 |
|
|
|
587 |
|
|
|
502 |
|
|
|
419 |
|
| Net earnings (loss) attributable to equity holders |
|
|
(10 |
) |
|
|
(4 |
) |
|
|
88 |
|
|
|
(9 |
) |
|
|
73 |
|
|
|
(146 |
) |
|
|
127 |
|
|
|
131 |
|
| $ per common share (basic) |
|
|
(0.03 |
) |
|
|
(0.01 |
) |
|
|
0.22 |
|
|
|
(0.02 |
) |
|
|
0.18 |
|
|
|
(0.37 |
) |
|
|
0.32 |
|
|
|
0.33 |
|
| $ per common share (diluted) |
|
|
(0.03 |
) |
|
|
(0.01 |
) |
|
|
0.22 |
|
|
|
(0.02 |
) |
|
|
0.18 |
|
|
|
(0.37 |
) |
|
|
0.32 |
|
|
|
0.33 |
|
| Adjusted net earnings (non-IFRS, see page 25) |
|
|
151 |
|
|
|
78 |
|
|
|
46 |
|
|
|
69 |
|
|
|
205 |
|
|
|
93 |
|
|
|
79 |
|
|
|
36 |
|
| $ per common share (adjusted and diluted) |
|
|
0.38 |
|
|
|
0.20 |
|
|
|
0.12 |
|
|
|
0.18 |
|
|
|
0.52 |
|
|
|
0.23 |
|
|
|
0.20 |
|
|
|
0.09 |
|
| Earnings (loss) from continuing operations |
|
|
(10 |
) |
|
|
(4 |
) |
|
|
88 |
|
|
|
(10 |
) |
|
|
72 |
|
|
|
(146 |
) |
|
|
127 |
|
|
|
4 |
|
| $ per common share (basic) |
|
|
(0.03 |
) |
|
|
(0.01 |
) |
|
|
0.22 |
|
|
|
(0.02 |
) |
|
|
0.18 |
|
|
|
(0.37 |
) |
|
|
0.18 |
|
|
|
0.01 |
|
| $ per common share (diluted) |
|
|
(0.03 |
) |
|
|
(0.01 |
) |
|
|
0.22 |
|
|
|
(0.02 |
) |
|
|
0.18 |
|
|
|
(0.37 |
) |
|
|
0.18 |
|
|
|
0.01 |
|
| Cash provided by continuing operations (after working capital changes) |
|
|
503 |
|
|
|
(121 |
) |
|
|
(65 |
) |
|
|
134 |
|
|
|
236 |
|
|
|
263 |
|
|
|
(25 |
) |
|
|
7 |
|
Key things to note:
| • |
|
Our financial results are strongly influenced by the performance of our uranium segment, which accounted for 70% of consolidated revenues in the fourth quarter of 2015 and 68% of consolidated revenues in the fourth
quarter of 2014. |
| • |
|
The timing of customer requirements, which tends to vary from quarter to quarter, drives revenue in the uranium and fuel services segments. |
| • |
|
Net earnings do not trend directly with revenue due to unusual items and transactions that occur from time to time. We use adjusted net earnings, a non-IFRS measure, as a more meaningful way to compare our results from
period to period (see page 25 for more information). |
| • |
|
Cash from operations tends to fluctuate as a result of the timing of deliveries and product purchases in our uranium and fuel services segments. |
| • |
|
Quarterly results are not necessarily a good indication of annual results due to the variability in customer requirements noted above. |
MANAGEMENT’S
DISCUSSION AND ANALYSIS 47
Fourth quarter financial results by segment
Uranium
|
|
|
|
|
|
|
|
|
|
|
|
|
|
|
| |
|
|
|
THREE MONTHS ENDED
DECEMBER 31 |
|
|
|
|
| HIGHLIGHTS |
|
|
|
2015 |
|
|
2014 |
|
|
CHANGE |
|
| Production volume (million lbs) |
|
|
|
|
9.6 |
|
|
|
8.2 |
|
|
|
17 |
% |
|
|
|
|
|
|
|
|
|
|
|
|
|
|
|
| Sales volume (million lbs)1 |
|
|
|
|
11.2 |
|
|
|
10.7 |
|
|
|
5 |
% |
|
|
|
|
|
|
|
|
|
|
|
|
|
|
|
| Average spot price |
|
($US/lb) |
|
|
35.45 |
|
|
|
37.13 |
|
|
|
(5 |
)% |
| Average long-term price |
|
($US/lb) |
|
|
44.00 |
|
|
|
48.00 |
|
|
|
(8 |
)% |
| Average realized price |
|
($US/lb) |
|
|
46.36 |
|
|
|
50.57 |
|
|
|
(8 |
)% |
|
|
($Cdn/lb) |
|
|
61.24 |
|
|
|
56.78 |
|
|
|
8 |
% |
|
|
|
|
|
|
|
|
|
|
|
|
|
|
|
| Average unit cost of sales (including D&A) |
|
($Cdn/lb) |
|
|
38.25 |
|
|
|
34.27 |
|
|
|
12 |
% |
|
|
|
|
|
|
|
|
|
|
|
|
|
|
|
| Revenue ($ millions)1 |
|
|
|
|
687 |
|
|
|
606 |
|
|
|
13 |
% |
|
|
|
|
|
|
|
|
|
|
|
|
|
|
|
| Gross profit ($ millions) |
|
|
|
|
257 |
|
|
|
240 |
|
|
|
7 |
% |
|
|
|
|
|
|
|
|
|
|
|
|
|
|
|
| Gross profit (%) |
|
|
|
|
37 |
|
|
|
40 |
|
|
|
(8 |
)% |
|
|
|
|
|
|
|
|
|
|
|
|
|
|
|
| 1 |
Includes sales and revenue between our uranium, fuel services and NUKEM segments (17,000 pounds in sales and revenue of $0.5 million in Q4 2015, 400,000 pounds in sales and revenue of $15 million in Q4 2014).
|
Production volumes this quarter were 17% higher compared to the fourth quarter of 2014, mainly as a result of higher production from the
rampup of Cigar Lake production, offset by lower production at McArthur River/Key Lake, Rabbit Lake and our US ISR operations. See Uranium – production overview on page 54 for more information.
Uranium revenues were up 13% due to a 5% increase in sales volumes, which represents normal quarterly variance in our delivery schedule, and an 8% increase in
the average realized price.
Average spot and long-term prices decreased, as did our US dollar average realized price due to lower prices under
fixed-price contracts, and the mix of market and fixed contracts. However, the effect of foreign exchange resulted in an 8% higher Canadian dollar average realized price than the prior year. In the fourth quarter of 2015, our realized foreign
exchange rate was $1.32 compared to $1.12 in the prior year.
Total cost of sales (including D&A) increased by 17% ($429 million compared to $366
million in 2014). This was the result of a 12% increase in the average unit cost of sales and a 5% increase in sales volumes.
The unit cost of sales
increased due to an increase in the volume of material purchased throughout the year at prices higher than our average cost of inventory and an increase in the unit production costs related to the addition of higher cost production from Cigar Lake
during rampup.
The net effect was a $17 million increase in gross profit for the quarter.
48 CAMECO
CORPORATION
The following table shows the costs of produced and purchased uranium incurred in the reporting periods (which
are non-IFRS measures, see the paragraphs below the table). These costs do not include selling costs such as royalties, transportation and commissions, nor do they reflect the impact of opening inventories on our reported cost of sales.
|
|
|
|
|
|
|
|
|
|
|
|
|
| |
|
THREE MONTHS ENDED
DECEMBER 31 |
|
|
|
|
| ($/LB) |
|
2015 |
|
|
2014 |
|
|
CHANGE |
|
| Produced |
|
|
|
|
|
|
|
|
|
|
|
|
| Cash cost |
|
|
16.04 |
|
|
|
14.19 |
|
|
|
13 |
% |
| Non-cash cost |
|
|
10.96 |
|
|
|
7.15 |
|
|
|
53 |
% |
|
|
|
|
|
|
|
|
|
|
|
|
|
| Total production cost |
|
|
27.00 |
|
|
|
21.34 |
|
|
|
27 |
% |
|
|
|
|
|
|
|
|
|
|
|
|
|
| Quantity produced (million lbs) |
|
|
9.6 |
|
|
|
8.2 |
|
|
|
17 |
% |
|
|
|
|
|
|
|
|
|
|
|
|
|
| Purchased |
|
|
|
|
|
|
|
|
|
|
|
|
| Cash cost1 |
|
|
43.65 |
|
|
|
39.03 |
|
|
|
12 |
% |
|
|
|
|
|
|
|
|
|
|
|
|
|
| Quantity purchased (million lbs) |
|
|
3.2 |
|
|
|
3.7 |
|
|
|
(14 |
)% |
|
|
|
|
|
|
|
|
|
|
|
|
|
| Totals |
|
|
|
|
|
|
|
|
|
|
|
|
| Produced and purchased costs1 |
|
|
31.16 |
|
|
|
26.84 |
|
|
|
16 |
% |
|
|
|
|
|
|
|
|
|
|
|
|
|
| Quantities produced and purchased (million lbs) |
|
|
12.8 |
|
|
|
11.9 |
|
|
|
8 |
% |
|
|
|
|
|
|
|
|
|
|
|
|
|
| 1 |
In the fourth quarter of 2015, cash costs of purchased material were $33.79 (US) per pound compared to $35.05 (US) per pound in the same period in 2014. In the fourth quarter of 2015, the exchange rate on purchases
averaged $1.00 (US) for $1.29 (Cdn) compared to $1.00 (US) for $1.11 (Cdn) during the same period in 2014. |
Cash cost per pound, non-cash
cost per pound and total cost per pound for produced and purchased uranium presented in the above table are non-IFRS measures. These measures do not have a standardized meaning or a consistent basis of calculation under IFRS. We use these measures
in our assessment of the performance of our uranium business. We believe that, in addition to conventional measures prepared in accordance with IFRS, certain investors use this information to evaluate our performance and ability to generate cash
flow.
These measures are non-standard supplemental information and should not be considered in isolation or as a substitute for measures of performance
prepared according to accounting standards. These measures are not necessarily indicative of operating profit or cash flow from operations as determined under IFRS. Other companies may calculate these measures differently, so you may not be able to
make a direct comparison to similar measures presented by other companies.
To facilitate a better understanding of these measures, the following table
presents a reconciliation of these measures to our unit cost of sales for the fourth quarters of 2015 and 2014.
CASH AND TOTAL COST PER POUND
RECONCILIATION
|
|
|
|
|
|
|
|
|
| |
|
THREE MONTHS ENDED
DECEMBER 31 |
|
| ($ MILLIONS) |
|
2015 |
|
|
2014 |
|
| Cost of product sold |
|
|
328.3 |
|
|
|
269.0 |
|
| Add / (subtract) |
|
|
|
|
|
|
|
|
| Royalties |
|
|
(49.5 |
) |
|
|
(34.5 |
) |
| Other selling costs |
|
|
(6.7 |
) |
|
|
(2.3 |
) |
| Change in inventories |
|
|
21.5 |
|
|
|
28.5 |
|
|
|
|
|
|
|
|
|
|
| Cash operating costs (a) |
|
|
293.6 |
|
|
|
260.7 |
|
| Add / (subtract) |
|
|
|
|
|
|
|
|
| Depreciation and amortization |
|
|
100.9 |
|
|
|
96.7 |
|
| Change in inventories |
|
|
4.3 |
|
|
|
(38.0 |
) |
|
|
|
|
|
|
|
|
|
| Total operating costs (b) |
|
|
398.8 |
|
|
|
319.4 |
|
|
|
|
|
|
|
|
|
|
| Uranium produced & purchased (million lbs) (c) |
|
|
12.8 |
|
|
|
11.9 |
|
|
|
|
|
|
|
|
|
|
| Cash costs per pound (a ÷ c) |
|
|
22.94 |
|
|
|
21.91 |
|
| Total costs per pound (b ÷ c) |
|
|
31.16 |
|
|
|
26.84 |
|
|
|
|
|
|
|
|
|
|
MANAGEMENT’S
DISCUSSION AND ANALYSIS 49
Fuel services
(includes results for UF6, UO2 and fuel
fabrication)
|
|
|
|
|
|
|
|
|
|
|
|
|
|
|
| |
|
|
|
THREE MONTHS ENDED
DECEMBER 31 |
|
|
|
|
| HIGHLIGHTS |
|
|
|
2015 |
|
|
2014 |
|
|
CHANGE |
|
| Production volume (million kgU) |
|
|
|
|
3.4 |
|
|
|
2.7 |
|
|
|
26 |
% |
| Sales volume (million kgU)1 |
|
|
|
|
4.5 |
|
|
|
7.4 |
|
|
|
(39 |
)% |
| Average realized price |
|
($Cdn/kgU) |
|
|
21.88 |
|
|
|
16.92 |
|
|
|
29 |
% |
| Average unit cost of sales (including D&A) |
|
($Cdn/kgU) |
|
|
17.18 |
|
|
|
14.78 |
|
|
|
16 |
% |
| Revenue ($ millions)1 |
|
|
|
|
99 |
|
|
|
125 |
|
|
|
(21 |
)% |
| Gross profit ($ millions) |
|
|
|
|
21 |
|
|
|
16 |
|
|
|
31 |
% |
| Gross profit (%) |
|
|
|
|
21 |
|
|
|
13 |
|
|
|
62 |
% |
| 1 |
Includes sales and revenue between our uranium, fuel services and NUKEM segments (339,000 kgU in sales and revenue of $2.9 million in Q4 2015, 0.5 million kgU in sales and revenue of $4 million in Q4 2014).
|
Total revenue decreased by 21% due to a 39% decrease in sales volumes, partially offset by a 29% increase in average realized price.
The total cost of sales (including D&A) decreased by 28% ($78 million compared to $109 million in the fourth quarter of 2014) mainly due to a 39% decrease
in sales volumes, partially offset by an increase of 16% in the average unit cost of sales, primarily as a result of the mix of products sold.
The net
effect was a $5 million increase in gross profit.
NUKEM
|
|
|
|
|
|
|
|
|
|
|
|
|
|
|
| |
|
|
|
THREE MONTHS ENDED
DECEMBER 31 |
|
|
|
|
| HIGHLIGHTS |
|
|
|
2015 |
|
|
2014 |
|
|
CHANGE |
|
| Sales volume U3O8
(million lbs)1 |
|
|
|
|
3.7 |
|
|
|
3.4 |
|
|
|
9 |
% |
| Average realized price |
|
($Cdn/lb) |
|
|
52.22 |
|
|
|
52.12 |
|
|
|
— |
|
| Cost of product sold (including D&A) |
|
|
|
|
186 |
|
|
|
156 |
|
|
|
19 |
% |
| Revenue ($ millions)1 |
|
|
|
|
192 |
|
|
|
159 |
|
|
|
21 |
% |
| Gross profit ($ millions) |
|
|
|
|
6 |
|
|
|
3 |
|
|
|
100 |
% |
| Gross profit (%) |
|
|
|
|
3 |
|
|
|
2 |
|
|
|
50 |
% |
| 1 |
Includes sales and revenue between our uranium, fuel services and NUKEM segments (nil in Q4 2015, 1.1 million pounds in sales and revenue of $43 million in Q4 2014). |
NUKEM delivered 3.7 million pounds of uranium, an increase of 0.3 million pounds compared to 2014. NUKEM revenues amounted to $192 million compared
to $159 million in 2014 due to an increase in volumes delivered.
Gross profit percentage was 3% in the fourth quarter of 2015, compared to 2% in the
fourth quarter of 2014.
The net effect was a $3 million increase in gross profit.
50 CAMECO
CORPORATION
Our operations and projects
This section of our MD&A is an overview of each of our operations, what we accomplished this year, our plans for the future and how we manage risk.
|
|
|
| 52 |
|
MANAGING THE RISKS |
|
|
| 54 |
|
URANIUM – PRODUCTION OVERVIEW |
|
|
| 54 |
|
PRODUCTION OUTLOOK |
|
|
| 55 |
|
URANIUM – OPERATING PROPERTIES |
|
|
| 55 |
|
MCARTHUR RIVER MINE / KEY LAKE MILL |
|
|
| 60 |
|
CIGAR LAKE |
|
|
| 65 |
|
INKAI |
|
|
| 68 |
|
RABBIT LAKE |
|
|
| 70 |
|
SMITH RANCH-HIGHLAND |
|
|
| 71 |
|
CROW BUTTE |
|
|
| 72 |
|
URANIUM – PROJECTS UNDER EVALUATION |
|
|
| 72 |
|
MILLENNIUM |
|
|
| 72 |
|
YEELIRRIE |
|
|
| 72 |
|
KINTYRE |
|
|
| 74 |
|
URANIUM – EXPLORATION AND CORPORATE DEVELOPMENT |
|
|
| 76 |
|
FUEL SERVICES |
|
|
| 76 |
|
BLIND RIVER REFINERY |
|
|
| 77 |
|
PORT HOPE CONVERSION SERVICES |
|
|
| 77 |
|
CAMECO FUEL MANUFACTURING INC. (CFM) |
|
|
| 79 |
|
NUKEM GMBH |
MANAGEMENT’S
DISCUSSION AND ANALYSIS 51
Managing the risks
The nature of our operations means we face many potential risks and hazards that could have a significant impact on our business. Our risk policy and process
involves a broad, systematic approach to identifying, assessing, reporting and managing the significant risks we face in our business and operations. The policy establishes clear accountabilities for enterprise risk management. We use a common risk
matrix throughout the company and consider any risk that has the potential to significantly affect our ability to achieve our corporate objectives or strategic plan as an enterprise risk. However, there is no assurance we will be successful in
preventing the harm any of these risks and hazards could cause. We recommend you read our most recent management proxy circular for more information about our risk oversight.
Below we list the regulatory, environmental and operational risks that generally apply to all of our operations and projects under evaluation. We also talk
about how we manage specific risks in each operation or project update. These risks could have a material impact on our business in the near term.
We
recommend you also review our annual information form, which includes a discussion of other material risks that could have an impact on our business.
Regulatory risks
A significant part of our economic
value depends on our ability to:
| • |
|
obtain and renew the licences and other approvals we need to operate, to increase production at our mines and to develop new mines. If we do not receive the regulatory approvals we need, or do not receive them at the
right time, then we may have to delay, modify or cancel a project, which could increase our costs and delay or prevent us from generating revenue from the project. Regulatory review, including the review of environmental matters, is a long and
complex process. |
| • |
|
comply with the conditions in these licences and approvals. In a number of instances, our right to continue operating facilities, increase production at our mines and develop new mines depends on our compliance with
these conditions. |
| • |
|
comply with the extensive and complex laws and regulations that govern our activities, including our growth plans. Environmental legislation imposes strict standards and controls on almost every aspect of our operations
and the mines we plan to develop, and is not only introducing new requirements, but also becoming more stringent. For example: |
| |
• |
|
we must complete the environmental assessment process before we can begin developing a new mine or make any significant change to our operations |
| |
• |
|
we may need regulatory approval to make changes to our operational processes, which can take a significant amount of time because it may require an extensive review of supporting technical information. The complexity of
this process can be further compounded when regulatory approvals are required from multiple agencies. |
| |
• |
|
Environment Canada has brought forward a national recovery plan for woodland caribou that has the potential to impact economic and social development in northern Saskatchewan. Additional research work is being conducted
so that a determination can be made on the sustainability of the species within the region. The research could result in measures being taken to further limit habitat disturbance in order to improve the health of the woodland caribou population in
northern Saskatchewan, and it could have an impact on our Saskatchewan operations and projects under evaluation. |
| |
• |
|
Environment Canada has been reviewing the Metal Mining Effluent Regulations (MMER). This review could result in new limits for existing MMER substances and proposed limits for new substances that could impact our
Saskatchewan operations. |
| |
• |
|
The U.S. Environmental Protection Agency is proposing to add new health and environmental protection standards to regulate byproduct materials produced by uranium in situ recovery operations. The proposed rule includes
surface and subsurface standards, with a primary focus on groundwater protection, restoration and stability. Particularly concerning is the proposed requirement that groundwater must be monitored for 30 years after restoration. |
We use significant management and financial resources to manage our regulatory risks.
Environmental risks
We have the safety, health and
environmental risks associated with any mining and chemical processing company. Our uranium and fuel services segments also face unique risks associated with radiation.
52 CAMECO
CORPORATION
Laws to protect the environment are becoming more stringent for members of the nuclear energy industry and have
inter-jurisdictional aspects (both federal and provincial/state regimes are applicable). Once we have permanently stopped mining and processing activities at an operating site, we are required to decommission the site to the satisfaction of the
regulators. We have developed conceptual decommissioning plans for our operating sites and use them to estimate our decommissioning costs. Regulators review our conceptual decommissioning plans on a regular basis. As the site approaches or goes into
decommissioning, regulators review the detailed decommissioning plans. This can result in further regulatory process, as well as additional requirements, costs and financial assurances.
At the end of 2015, our estimate of total decommissioning and reclamation costs was $975 million. This is the undiscounted value of the obligation and is
based on our current operations. We had accounting provisions of $917 million at the end of 2015 (the present value of the $975 million). Since we expect to incur most of these expenditures at the end of the useful lives of the operations they
relate to, our expected costs for decommissioning and reclamation for the next five years are not material.
We provide financial assurances for
decommissioning and reclamation such as letters of credit to regulatory authorities, as required. We had a total of $1 billion in letters of credit supporting our reclamation liabilities at the end of 2015. All of our North American operations have
letters of credit in place that provide financial assurance in connection with our preliminary plans for decommissioning of the sites.
Some of the sites
we own or operate have been under ongoing investigation and/or remediation and planning as a result of historic soil and groundwater conditions. For example, we are addressing issues related to historic soil and groundwater contamination at Port
Hope.
We use significant management and financial resources to manage our environmental risks.
We manage environmental risks through our safety, health, environment and quality (SHEQ) management system. Our chief executive officer is responsible for
ensuring that our SHEQ management system is implemented. Our board’s safety, health and environment committee also oversees how we manage our environmental risks.
In 2015, we invested:
| • |
|
$77 million in environmental protection, monitoring and assessment programs, about the same as 2014 |
| • |
|
$31 million in health and safety programs, or 29% more than 2014 as a result of ventilation improvements at McArthur River |
Spending on environmental programs is expected to increase slightly in 2016, while spending on health and safety programs will decrease toward 2014 levels.
Operational risks
Other operational risks and
hazards include:
| • |
|
industrial and transportation accidents |
| • |
|
labour shortages, disputes or strikes |
| • |
|
cost increases for labour, contracted or purchased materials, supplies and services |
| • |
|
shortages of required materials, supplies and equipment |
| • |
|
transportation disruptions |
| • |
|
electrical power interruptions |
| • |
|
non-compliance with laws and licences
|
| • |
|
blockades or other acts of social or political activism |
| • |
|
natural phenomena, such as inclement weather conditions, floods and earthquakes |
| • |
|
unusual, unexpected or adverse mining or geological conditions |
| • |
|
ground movement or cave-ins |
| • |
|
tailings pipeline or dam failures |
| • |
|
technological failure of mining methods |
We have insurance to cover some of these
risks and hazards, but not all of them, and not to the full amount of losses or liabilities that could potentially arise.
MANAGEMENT’S
DISCUSSION AND ANALYSIS 53
Uranium – production overview
Production in our uranium segment in the fourth quarter was 9.6 million pounds, 17% higher compared to the same period in 2014 primarily due to the rampup
of production at Cigar Lake. Production for the year was 28.4 million pounds, 22% higher than in 2014. See Uranium - operating properties starting on page 55 for more information.
Uranium production
|
|
|
|
|
|
|
|
|
|
|
|
|
|
|
|
|
|
|
|
|
|
|
|
|
| CAMECO SHARE |
|
THREE MONTHS ENDED
DECEMBER 31 |
|
|
YEAR ENDED
DECEMBER 31 |
|
|
|
|
|
|
|
| (MILLION LBS) |
|
2015 |
|
|
2014 |
|
|
2015 |
|
|
2014 |
|
|
2015 PLAN1 |
|
|
2016 PLAN |
|
| McArthur River/Key Lake |
|
|
3.8 |
|
|
|
4.4 |
|
|
|
13.3 |
|
|
|
13.3 |
|
|
|
13.7 |
|
|
|
14.0 |
|
| Cigar Lake |
|
|
2.3 |
|
|
|
0.2 |
|
|
|
5.7 |
|
|
|
0.2 |
|
|
|
4.0 - 5.0 |
|
|
|
8.0 |
2 |
| Inkai |
|
|
1.1 |
|
|
|
0.7 |
|
|
|
3.4 |
|
|
|
2.9 |
|
|
|
3.0 |
|
|
|
3.0 |
|
| Rabbit Lake |
|
|
2.0 |
|
|
|
2.1 |
|
|
|
4.2 |
|
|
|
4.2 |
|
|
|
3.9 |
|
|
|
3.6 |
|
| Smith Ranch-Highland |
|
|
0.3 |
|
|
|
0.6 |
|
|
|
1.4 |
|
|
|
2.1 |
|
|
|
1.4 |
|
|
|
1.2 |
|
| Crow Butte |
|
|
0.1 |
|
|
|
0.2 |
|
|
|
0.4 |
|
|
|
0.6 |
|
|
|
0.3 |
|
|
|
0.2 |
|
|
|
|
|
|
|
|
|
|
|
|
|
|
|
|
|
|
|
|
|
|
|
|
|
|
| Total |
|
|
9.6 |
|
|
|
8.2 |
|
|
|
28.4 |
|
|
|
23.3 |
|
|
|
26.3 - 27.3 |
|
|
|
30.0 |
2 |
|
|
|
|
|
|
|
|
|
|
|
|
|
|
|
|
|
|
|
|
|
|
|
|
|
| 1 |
We updated our initial 2015 plan for Cigar Lake (to 5 million pounds, from between 3 and 4 million pounds) in our Q3 MD&A. |
| 2 |
Our 2016 plan for packaged production from Cigar Lake is subject to regulatory approval for an annual production limit increase at the McClean Lake mill. See Uranium – operating properties – Cigar Lake
starting on page 60 for more information. |
Production Outlook
We remain focused on taking advantage of the long-term growth we see coming in our industry, while maintaining the ability to respond to market conditions as
they evolve. Our strategy is to focus on our tier-one assets and profitably produce at a pace aligned with market signals in order to increase long-term shareholder value.
We plan to:
| • |
|
ensure continued safe, reliable, low-cost production from our tier-one assets – McArthur River/Key Lake, Cigar Lake and Inkai |
| • |
|
complete rampup of production at Cigar Lake |
| • |
|
seek to expand production at McArthur River/Key Lake in conjunction with market signals |
| • |
|
manage the rest of our sources of supply in a manner that retains the flexibility to respond to market signals and take advantage of value adding opportunities within our own portfolio and the uranium market
|
| • |
|
maintain our low-cost advantage by focusing on execution and operational excellence |
54 CAMECO
CORPORATION
Uranium – operating properties
McArthur River mine / Key Lake mill
|
|
|
|
|
|
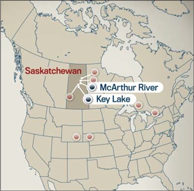
|
|
2015 Production (our share) 13.3M
lbs 2016 Production Outlook (our share) 14.0M
lbs Estimated Reserves (our share) 234.9M
lbs Estimated Mine Life 2033 |
|
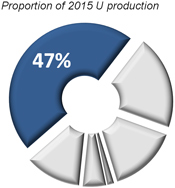
|
McArthur River is the world’s largest, high-grade uranium mine, and Key Lake is the world’s largest uranium mill.
Ore grades at the McArthur River mine are 100 times the world average, which means it can produce more than 19 million pounds per year by mining
only 150 to 200 tonnes of ore per day. We are the operator of both the mine and mill.
McArthur River is one of our three material uranium properties.
|
|
|
| Location |
|
Saskatchewan, Canada |
| Ownership |
|
McArthur River – 69.805% |
|
|
Key Lake – 83.33% |
| Mine type |
|
Underground |
| Mining methods |
|
Primary: raiseboring |
|
|
Secondary: blasthole stoping, boxhole boring |
| End product |
|
Uranium concentrates |
| Certification |
|
ISO 14001 certified |
| Estimated reserves |
|
234.9 million pounds (proven and probable), average grade U3O8: 10.94% |
| Estimated resources |
|
3.9 million pounds (measured and indicated), average grade U3O8: 3.77% |
|
|
40.9 million pounds (inferred), average grade U3O8: 7.72% |
| Licensed capacity |
|
Mine and mill: 25.0 million pounds per year |
| Licence term |
|
Through October, 2023 |
| Total production: 2000 to 2015 |
|
291.1 million pounds (McArthur River/Key Lake) (100% basis) |
|
1983 to 2002 |
|
209.8 million pounds (Key Lake) (100% basis) |
| 2015 production |
|
13.3 million pounds (19.1 million pounds on 100% basis) |
| 2016 production outlook |
|
14.0 million pounds (20.0 million pounds on 100% basis) |
| Estimated decommissioning cost |
|
$48 million – McArthur River (100% basis) |
|
|
$218 million – Key Lake (100% basis) |
All values shown, including reserves and resources, represent our share only, unless indicated.
BACKGROUND
Mining methods and techniques
We use a number of innovative methods to mine the McArthur River deposit:
Ground freezing
The sandstone that overlays the deposit
and basement rocks is water-bearing, with large volumes of water under significant pressure. We use ground freezing to form an impermeable wall around the area being mined. This prevents water from entering the mine, and helps stabilize weak rock
formations. To date, we have isolated six mining areas with freezewalls.
MANAGEMENT’S
DISCUSSION AND ANALYSIS 55
Raisebore mining
Raisebore mining is an innovative non-entry approach that we adapted to meet the unique challenges at McArthur River. It involves:
| • |
|
drilling a series of overlapping holes through the ore zone from a raisebore chamber in waste rock above the mineralization |
| • |
|
collecting the broken ore at the bottom of the raises using line-of-sight remote-controlled scoop trams, and transporting it to an underground grinding circuit |
| • |
|
once mining is complete, filling each raisebore hole with concrete |
| • |
|
when all the rows of raises in a chamber are complete, removing the equipment and filling the entire chamber with concrete |
| • |
|
starting the process again with the next raisebore chamber |
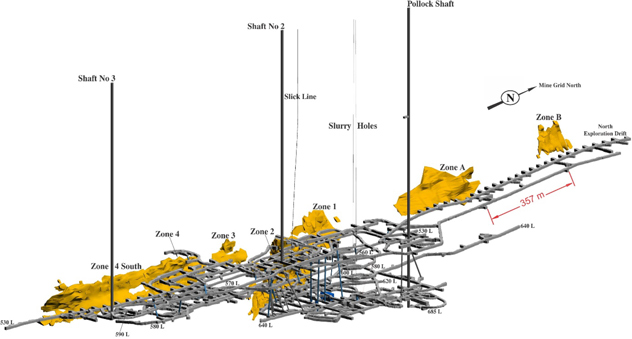
McArthur River currently has six areas with delineated mineral reserves and delineated mineral resources (zones 1 to 4,
zone 4 south and zone B) and two additional areas with delineated mineral resources (zone A, McArthur north). We are currently mining zone 2 and zone 4.
Zone 2 has been actively mined since production began. It is divided into four panels (panels 1, 2, 3 and 5) based on the configuration of the freezewall
around the ore. As the freezewall is expanded, the inner connecting freezewalls are decommissioned in order to recover the uranium that was inaccessible around the active freeze pipes. Panel 5 represents the upper portion of zone 2, overlying part
of the other panels. The majority of the remaining zone 2 proven mineral reserves are in panel 5.
Zone 4 is divided into three mining areas: central,
north and south. We are actively mining the central and north areas.
The Canadian Nuclear Safety Commission (CNSC) has granted approval for the use of
two secondary extraction methods: blasthole stoping and boxhole boring.
Our use of blasthole stoping as an ore extraction method has increased as a
result of the significant productivity improvements we have achieved with this method. The amount of ore extracted from a single stope can be equivalent to four to eight raisebore holes, resulting in more efficient mining, less waste rock handling,
less backfill placement and lower backfill dilution in the ore shipped to Key Lake.
We have used the approved mining methods to successfully extract over
290 million pounds (100% basis) since we began mining in 1999. Raisebore mining is scheduled to remain the primary extraction method over the life of mine, although we now expect to mine a significant portion of the remaining reserves with
blasthole stoping.
56 CAMECO
CORPORATION
Blasthole stoping
Similar to raiseboring, blasthole stoping requires establishing drill access above the mineralization and extraction access below the mineralization. We begin
each stope with a single raisebore hole (explained above). The stope is then formed by expanding the circumference of the raise by drilling longholes around the raisebore hole and blasting the ore. The blasted material funnels into the raisebore
hole and drops to the extraction level below. The broken rock is collected on the lower level and removed by line-of-sight remote-controlled scoop trams, then transported to the grinding circuit. Once a stope is mined out, it is backfilled with
concrete to maintain ground stability and allow the next stope and/or raise to be mined. This mining method has been used extensively in the mining industry, including uranium mining.
We continue to employ blasthole stoping only in areas where the longholes can be accurately drilled, and where stable stopes can be excavated without
jeopardizing the integrity of the freezewall.
Boxhole boring
Boxhole boring is similar to the raisebore method, but the drilling machine is located below the mineralization, so development is not required above the
mineralization. This method is currently being used at a few mines around the world, but had not been used for uranium mining prior to testing at McArthur River.
Test mining to date has identified this as a viable mining option; however, only a minor amount of ore is scheduled to be extracted using this method.
Initial processing
We carry out initial processing of
the extracted ore at McArthur River:
| • |
|
the underground circuit grinds the ore and mixes it with water to form a slurry |
| • |
|
the slurry is pumped 680 metres to the surface and stored in one of four ore slurry holding tanks |
| • |
|
it is blended and thickened, removing excess water |
| • |
|
the final slurry, at an average grade of 15% U3O8, is pumped into transport truck containers and shipped to
Key Lake mill on an 80 kilometre all-weather road |
Water from this process, including water from underground operations, is treated on the
surface. Any excess treated water is released into the environment.
2015 UPDATE
Production
Production from McArthur River/Key Lake was
19.1 million pounds; our share was 13.3 million pounds. This was 3% lower than our forecast for the year due to unplanned maintenance outages to repair the calciner at Key Lake. Annual production was unchanged from 2014.
Licensing and production capacity
In 2015, the CNSC
approved our application to increase McArthur River’s licensed annual production to 25 million pounds (100% basis) to allow flexibility to match the approved Key Lake mill capacity. The licence conditions handbooks for these operations now
allow both operations to produce up to 25 million pounds (100% basis) per year.
Key Lake extension and McArthur River production expansion
In support of our strategy to maintain the flexibility to respond to market conditions as they evolve, we continue to advance projects that are
necessary to sustain and increase production when the market signals that additional production is needed.
MANAGEMENT’S
DISCUSSION AND ANALYSIS 57
The Key Lake mill began operating in 1983 and we continue to upgrade circuits with new technology to simplify
operations and improve environmental performance. The extension project involved increasing our tailings capacity and the mill’s nominal annual production rate to closely follow production from the McArthur River mine. As part of the mill
upgrades, we continue to construct and commission a new calciner circuit, and expect to begin operating with the new calciner in 2016. The existing calciner circuit will remain in place until operational reliability of the new calciner is achieved.
The calciner replacement project was planned in a way that temporarily allows us to use either calciner, which will help to mitigate risks to our production rate during the commissioning phase. In order to increase production at Key Lake, we also
need to optimize and expand the solvent extraction and crystallization circuits in the mill (projects planned for 2017).
At McArthur River, we must
continue to successfully transition into new mine areas through mine development and investment in support infrastructure. We plan to:
| • |
|
improve our dewatering system and expand our water treatment capacity as required to mitigate capacity losses, should mine development increase background water volumes |
| • |
|
expand the concrete distribution systems and batch plant capacity |
New mining areas
New mining zones and increased mine production require increased freeze capacity and ventilation. In 2015, we continued to upgrade our electrical
infrastructure on surface as part of our plan to address these future needs. We advanced groundworks to prepare for the next freeze plant, which is scheduled to begin freezing the south end of the orebody (zone 4) in 2017.
We also made changes in shaft 2 to increase air flow, resulting in a 15% to 20% improvement in ventilation capacity. The improved ventilation eliminates the
need for a new ventilation shaft to support a higher production rate.
Tailings capacity
We expect to have sufficient tailings capacity to mill all the known McArthur River mineral reserves and resources, should they be converted to reserves, with
additional capacity to toll mill ore from other regional deposits.
PLANNING FOR THE FUTURE
Production
We plan to produce 20.0 million pounds in
2016; our share is 14.0 million pounds.
Expansion progress
As previously disclosed in our 2012 Technical Report, we plan to reach an annual capacity of 22 million pounds by 2018. The capital required to do so is
shown in our 2016 capital spending plan, and in our outlook for investing activities in 2017 and 2018, beginning on page 38.
As we increase to
22 million pounds per year, we will optimize the capacity of both the Key Lake mill and McArthur River mine with a view to further increasing production to 25 million pounds per year (100% basis), as market conditions improve. Using this
approach, we do not expect significant additional growth capital will be required to increase from annual production of 22 million pounds to an annual rate of 25 million pounds. We expect that this paced approach will allow us to extract
maximum value from the operation as the market transitions.
Exploration
In 2015, underground drilling further delineated the zone A mineral resources. Underground definition drilling of zone B will be conducted in 2016 and 2017 to
provide the information required for engineering work to develop more detailed mining plans.
MANAGING OUR RISKS
Production at McArthur River/Key Lake poses many challenges: control of groundwater, weak rock formations, radiation protection, water inflow, mine area
transitioning, and regulatory approvals. Operational experience gained since the start of production has resulted in a significant reduction in risk.
58 CAMECO
CORPORATION
Transition to new mining areas
In order to successfully achieve the planned production schedule, we must continue to successfully transition into new mining areas, which includes mine
development and investment in critical support infrastructure.
Water inflow risk
The greatest risk is production interruption from water inflows. A 2003 water inflow resulted in a three-month suspension of production. We also had a small
water inflow in 2008 that did not impact production.
The consequences of another water inflow at McArthur River would depend on its magnitude, location
and timing, but could include a significant interruption or reduction in production, a material increase in costs or a loss of mineral reserves.
We take
the following steps to reduce the risk of inflows, but there is no guarantee that these will be successful:
| • |
|
Ground freezing: Before mining, we drill freezeholes and freeze the ground to form an impermeable freezewall around the area being mined. Ground freezing reduces but does not eliminate the risk of water inflows.
|
| • |
|
Mine development: We plan for our mine development to take place away from known groundwater sources whenever possible. In addition, we assess all planned mine development for relative risk and apply extensive
additional technical and operating controls for all higher risk development. |
| • |
|
Pumping capacity and treatment limits: Our standard for this project is to secure pumping capacity of at least one and a half times the estimated maximum sustained inflow. We review our dewatering system and
requirements at least once a year and before beginning work on any new zone. |
We believe we have sufficient pumping, water treatment and
surface storage capacity to handle the estimated maximum sustained inflow.
We also manage the risks listed on pages 52 to 53.
MANAGEMENT’S
DISCUSSION AND ANALYSIS 59
Uranium – operating properties
Cigar Lake
|
|
|
|
|
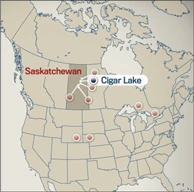
|
|
2015 Production (our share) 5.7M
lbs 2016 Production Outlook (our share) 8.0M
lbs1 Estimated Reserves (our share)
110.9M lbs Estimated Mine Life
2028 |
|

|
Cigar Lake is the world’s highest grade uranium mine, with grades that are 100 times the world average. We are a 50%
owner and the mine operator.
Cigar Lake is one of our three material uranium properties.
|
|
|
| Location |
|
Saskatchewan, Canada |
| Ownership |
|
50.025% |
| Mine type |
|
Underground |
| Mining method |
|
Jet boring system |
| End product |
|
Uranium concentrates |
| Certification |
|
ISO 14001 certified |
| Estimated reserves |
|
110.9 million pounds (proven and probable), average grade U3O8: 16.70% |
| Estimated resources |
|
1.6 million pounds (measured and indicated), average grade U3O8: 7.38% 51.6 million pounds (inferred), average grade
U3O8: 16.43% |
| Licensed capacity |
|
18.0 million pounds per year (our share 9.0 million pounds per year) |
| Licence term |
|
Through June, 2021 |
| Total production: 2014 to 2015 |
|
11.8 million pounds (100% basis) |
| 2015 production |
|
5.7 million pounds (11.3 million pounds on 100% basis) |
| 2016 production outlook |
|
8.0 million pounds (16.0 million pounds on 100% basis)1 |
| Estimated decommissioning cost |
|
$49 million (100% basis) |
| 1 |
Our 2016 production plan is subject to regulatory approval for a production increase at the McClean Lake mill. |
| All |
values shown, including reserves and resources, represent our share only, unless indicated. |
BACKGROUND
Development
We began developing the Cigar Lake
underground mine in 2005, but development was delayed due to water inflows. In October 2014, the McClean Lake mill produced first uranium concentrate from ore mined at the Cigar Lake operation. Commercial production was declared in May 2015.
Mining method and development techniques
Bulk
freezing
The sandstone that overlays the deposit and basement rocks is water-bearing, with large volumes of water under significant pressure. To
prevent water from entering the mine, help stabilize weak rock formations, and meet our production schedule, the ore zone and surrounding ground in the area to be mined must meet specific ground freezing requirements before we begin jet boring.
60 CAMECO
CORPORATION
During construction, development and remediation of the underground infrastructure, we employed a hybrid ground
freezing approach using a combination of underground and surface freezing. The costs related to each technique are similar; however, there are significant advantages to freezing the ground from the surface. With surface freezing, less mine
development is required, which results in less waste rock and greater ground stability, since freeze tunnels are not required between production tunnels. In addition, congestion is reduced and underground development for freeze infrastructure is no
longer a critical path mine activity. Based on these advantages, we have elected to proceed exclusively using surface freezing to mine current reserves at Cigar Lake.
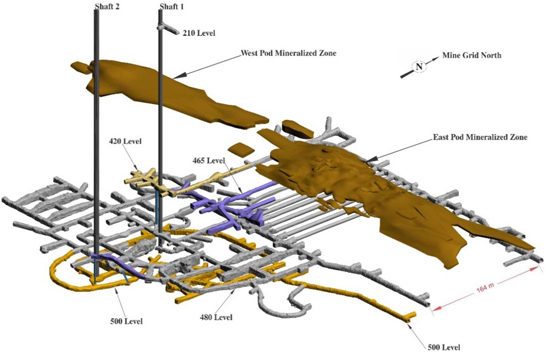
Jet boring
After many
years of test mining, we selected jet boring, a non-entry mining method, which we have developed and adapted specifically for this deposit. This method involves:
| • |
|
drilling a pilot hole into the frozen orebody, inserting a high pressure water jet and cutting a cavity out of the frozen ore |
| • |
|
collecting the ore and water mixture (slurry) from the cavity and pumping it to storage (sump storage), allowing it to settle |
| • |
|
using a clamshell, transporting the ore from the sump storage to a grinding and processing circuit, eventually loading a tanker truck with ore slurry for transport to the mill |
| • |
|
once mining is complete, filling each cavity in the orebody with concrete |
| • |
|
starting the process again with the next cavity |
Jet boring system (JBS) process
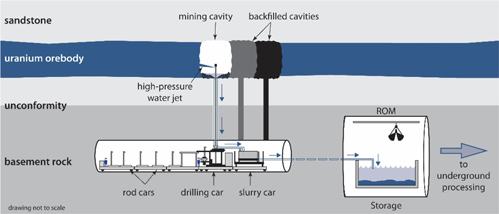
MANAGEMENT’S
DISCUSSION AND ANALYSIS 61
We have divided the orebody into production panels and at least three production panels need to be frozen at one
time to achieve the full annual production rate of 18 million pounds. One JBS machine will be located in each frozen panel and the three JBS machines required are currently in operation. Due to limitations on the availability of high pressure
water, two machines can be actively mining at any given time while the third is moving, setting up, or undergoing maintenance. Later in the mine plan, we may require a fourth JBS machine to sustain annual production of 18 million pounds.
Milling
All of Cigar Lake’s ore slurry is being
processed at the McClean Lake mill, operated by AREVA. The McClean Lake mill is undergoing modifications and expansion in order to:
| • |
|
operate at Cigar Lake’s targeted annual production level of 18 million pounds U3O8
|
| • |
|
process and package all of Cigar Lake’s current mineral reserves |
The Cigar Lake joint venture is paying
the capital costs for the modification and expansion.
2015 UPDATE
Production
Total packaged production from Cigar Lake was
11.3 million pounds U3O8; our share was 5.7 million pounds. The operation exceeded our forecast of 10 million pounds (100%
basis) as a result of higher productivity and our intention to adjust annual production as necessary, based on our operating experience during rampup.
During the year, we:
| • |
|
completed commissioning of the equipment required to operate three JBS units at a production scale |
| • |
|
brought on additional slurry haul trucks to ensure a sufficient quantity of ore slurry can be transported to the McClean Lake mill |
| • |
|
completed final commissioning of underground processing circuits and updated our production rampup plan based on commissioning experience |
| • |
|
modified mine and project plans to reflect our decision to exclusively freeze from surface |
| • |
|
declared commercial production |
Commercial production
Commercial production signals a transition in the accounting treatment for costs incurred at the mine. Cigar Lake met all of the criteria for commercial
production, including cycle time and process specifications, in the second quarter of 2015. Therefore, effective May 1, 2015, we began charging all production costs, including depreciation, to inventory and subsequently recognizing them in cost
of sales as the product is sold.
Underground development
As a result of our decision to exclusively use surface freezing going forward, and the resulting change in the mine plan, the bulk of the development and
freeze drilling required for mining in 2016 is already complete. We are continuing to plan for future expansion of surface freezing infrastructure in late 2016.
McClean Lake mill update
Additional estimated
expenditures of $50 million (100% basis, our share $25 million) are expected to be required at the McClean Lake mill in 2016, primarily to complete upgrades in the tailings neutralization area in support of the continued rampup to full production of
18 million pounds per year.
PLANNING FOR THE FUTURE
Production
In 2016, we expect to produce
16.0 million packaged pounds at Cigar Lake; our share is 8.0 million pounds.
62 CAMECO
CORPORATION
In 2016, we also expect to:
| • |
|
extend the current surface freeze pad and advance planning for freeze plant infrastructure expansion to support future production |
| • |
|
advance underground development according to the new mine plan and backfill drifts no longer required for underground freezing operations |
| • |
|
continue ramping up towards the planned full annual production rate of 18 million pounds (100% basis) in 2017 |
Exploration
We are planning to conduct delineation
drilling from surface to confirm and upgrade resources contained in the western portion of the deposit. Approximately 65,000 metres of diamond drilling is planned over a three-year period, starting in 2016, in order to complete a detailed geological
and geotechnical interpretation, a resource estimate, and a technical study for the western portion of the deposit.
Rampup schedule
In 2017, we expect to reach full annual production of 18 million pounds (100% basis, 9 million pounds our share).
The McClean Lake mill’s operating licence currently has an annual production limit of 13 million pounds. AREVA has submitted an application to the
CNSC to increase the mill’s licensed annual production limit; our 2016 and 2017 production outlook for Cigar Lake is therefore subject to AREVA securing the regulatory approvals necessary to increase mill production.
MANAGING OUR RISKS
Cigar Lake is a challenging deposit
to develop and mine. These challenges include control of groundwater, weak rock formations, radiation protection, water inflow, regulatory approvals, surface and underground fires and other mining-related challenges. To reduce this risk, we are
applying our operational experience and the lessons we have learned about water inflows at McArthur River and Cigar Lake.
Limited mining experience of
the deposit
Although we have now successfully mined a number of cavities, these may not be representative of the deposit as a whole. As we ramp up
production, there may be some technical challenges, which could affect our production plans, including, but not limited to, variable or unanticipated ground conditions, ground movement and cave-ins, water inflows and variable dilution, recovery
values, and mining productivity. There is a risk that the rampup to full production may take longer than planned and that the full production rate may not be achieved on a sustained and consistent basis. We are confident we will be able to solve
challenges that may arise, but failure to do so would have a significant impact on our business.
Ground freezing
To manage our risks and meet our production schedule, the areas being mined must meet specific ground freezing requirements before we begin jet boring. We have
identified greater variation of the freeze rates of different geological formations encountered in the mine, based on new information obtained through surface freeze drilling. As a mitigation measure, we have increased the site freeze capacity to
facilitate the extraction of ore cavities as planned.
Mill modifications
There is a risk to our plan to achieve the full production rate of 18 million pounds per year in 2017 if AREVA is unable to complete and commission the
required mill modification and expansion on schedule. We are working closely with AREVA to understand and help mitigate the risks to ensure that mine and mill production schedules are aligned.
Mill licence increase approval
The McClean Lake
mill’s current annual operating licence is limited to 13 million pounds. AREVA has submitted an application to the CNSC to increase the mill’s licensed annual production limit to 24 million pounds. There is a risk to our 2016
production plan, and to our plan to achieve the full production rate of 18 million pounds per year in 2017, if AREVA is unable to secure the regulatory approvals necessary to increase mill production.
MANAGEMENT’S
DISCUSSION AND ANALYSIS 63
Labour relations
The current collective agreement between AREVA and unionized employees at the McClean Lake operation expires in May 2016. There is risk to our 2016 and 2017
production outlook for Cigar Lake if AREVA is unable to reach an agreement and there is a labour dispute.
Water inflow risk
A significant risk to development and production is from water inflows. The 2006 and 2008 water inflows were significant setbacks.
The consequences of another water inflow at Cigar Lake would depend on its magnitude, location and timing, but could include a significant delay or disruption
in Cigar Lake production, a material increase in costs or a loss of mineral reserves.
We take the following steps to reduce the risk of inflows, but
there is no guarantee that these will be successful:
| • |
|
Bulk freezing: Two of the primary challenges in mining the deposit are control of groundwater and ground support. Bulk freezing reduces but does not completely eliminate the risk of water inflows. |
| • |
|
Mine development: We plan for our mine development to take place away from known groundwater sources whenever possible. In addition, we assess all planned mine development for relative risk and apply extensive
additional technical and operating controls for all higher risk development. |
| • |
|
Pumping capacity and treatment limits: We have pumping capacity to meet our standard for this project of at least one and a half times the estimated maximum inflow. |
We believe we have sufficient pumping, water treatment and surface storage capacity to handle the estimated maximum inflow.
We also manage the risks listed on pages 52 to 53.
64 CAMECO
CORPORATION
Uranium – operating properties
Inkai
|
|
|
|
|

|
|
2015 Production (our share) 3.4M
lbs 2016 Production Outlook (our share) 3.0M
lbs Estimated Reserves (our share) 43.1M
lbs Estimated Mine Life 2030 (based on
licence term) |
|
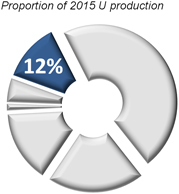
|
Inkai is a very significant uranium deposit, located in Kazakhstan. There are two production areas (blocks 1 and 2) and an
exploration area (block 3). The operator is joint venture Inkai limited liability partnership, which we jointly own (60%) with Kazatomprom (40%).
Inkai is one of our three material uranium properties.
|
|
|
| Location |
|
South Kazakhstan |
| Ownership |
|
60% |
| Mine type |
|
In situ recovery (ISR) |
| End product |
|
Uranium concentrates |
| Certifications |
|
BSI OHSAS 18001 ISO 14001
certified |
| Estimated reserves |
|
43.1 million pounds (proven and probable), average grade U3O8: 0.07% |
| Estimated resources |
|
30.3 million pounds (indicated), average grade U3O8: 0.08% 144.3 million pounds (inferred), average grade
U3O8: 0.05% |
| Licensed capacity (wellfields) |
|
5.2 million pounds per year (our share 3.0 million pounds per year) |
| Licence term |
|
Block 1: 2024, Block 2: 2030 |
| Total production: 2009 to 2015 |
|
31.8 million pounds (100% basis) |
| 2015 production |
|
3.4 million pounds (5.8 million pounds on 100% basis) |
| 2016 production outlook |
|
3.0 million pounds (5.2 million pounds on 100% basis) |
| Estimated decommissioning cost (100% basis) |
|
$9 million (US) (100% basis) |
All values shown, including reserves and resources, represent our share only, unless indicated.
2015 UPDATE
Production
Total production from Inkai was 5.8 million pounds; our share was 3.4 million pounds. Production was 17% higher than our production in 2014. During
2015, the subsoil use law in Kazakhstan was amended to allow producers to produce within 20% (above or below) their licensed capacity in a year. As a result, Inkai produced 5.8 million pounds in 2015, 11% higher than its licensed capacity. The
increase in production was the result of a higher head grade and an increase in wellfield development efficiency compared to 2014.
Project funding
As of December 31, 2015, Inkai had fully repaid the outstanding loan under our agreement to fund its project development costs related to blocks
1 and 2. In 2015, Inkai paid the remaining $0.8 million (US) in interest on the loan and repaid $55 million (US) of principal.
MANAGEMENT’S
DISCUSSION AND ANALYSIS 65
We are currently advancing funds for Inkai’s work on block 3 and, as of December 31, 2015, the
principal amounted to $148 million (US). Under the loan agreement, Inkai is to repay Cameco from the net sales proceeds from the sale of production from block 3.
Production expansion
In 2012, we entered into a binding
memorandum of agreement (2012 MOA) with our joint venture partner, Kazatomprom, setting out a framework to:
| • |
|
increase Inkai’s annual production from blocks 1 and 2 to 10.4 million pounds (our share 5.2 million pounds) and sustain it at that level |
| • |
|
extend the term of Inkai’s resource use contract through 2045 |
Kazatomprom is pursuing a strategic
objective to develop uranium processing capacity in Kazakhstan to complement its leading uranium mining operations. Their primary focus is now on uranium refining, which is an intermediate step in the uranium conversion process. A Nuclear
Co-operation Agreement between Canada and Kazakhstan is in place, providing the international framework necessary for applying to the two governments for the required licences and permits. We expect to pursue further expansion of production at Inkai
at a pace measured to market opportunities. Discussions continue with Kazatomprom.
Block 3 exploration
In 2015, Inkai completed construction of the test leach facility and began pilot production from test wellfields, as well as advancing work on a preliminary
appraisal of the mineral potential of block 3 according to Kazakhstan standards.
PLANNING FOR THE FUTURE
Production
We expect total production from blocks 1 and 2
to be 5.2 million pounds in 2016; our share is 3.0 million pounds. We expect to maintain production at this level until the potential growth plans are finalized with Kazatomprom.
Block 3 exploration
In 2016, Inkai expects to continue
with pilot production from the test leach facility and to continue working on a final appraisal of the mineral potential according to Kazakhstan standards.
MANAGING OUR RISKS
Block 3 licence extension
The block 3 test leach facility is now operational and state commissioning of the test wellfields was accomplished during 2015. Our application for an
extension of the block 3 evaluation period is still pending final approval from the Ministry of Energy of the Republic of Kazakhstan. Inkai continues working on the final appraisal of the mineral potential of block 3 according to Kazakhstan
standards. Although a number of extensions of the licence term have been granted by Kazakh regulatory authorities in the past, there is no assurance that a further extension will be granted. Without such extension, there is a risk we could lose our
rights to block 3, and a risk we will not be compensated for the funds we advanced to Inkai to fund block 3 activities.
Political risk
Kazakhstan declared itself independent in 1991 after the dissolution of the Soviet Union. Our Inkai investment and plans to increase production are subject to
the risks associated with doing business in developing countries, which have significant potential for social, economic, political, legal and fiscal instability. Kazakh laws and regulations are complex and still developing and their application can
be difficult to predict. To maintain and increase Inkai production, we need ongoing support, agreement and co-operation from our partner and the government.
The principal legislation governing subsoil exploration and mining activity in Kazakhstan is the Subsoil Use Law dated June 24, 2010, as amended (new
subsoil law). It replaces the Law on the Subsoil and Subsoil Use, dated January 27, 1996.
66 CAMECO
CORPORATION
In general, Inkai’s licences are governed by the version of the subsoil law that was in effect when the
licences were issued in April 1999, and new legislation applies to Inkai only if it does not worsen Inkai’s position. Changes to legislation related to national security, among other criteria, however, are exempt from the stabilization clause
in the resource use contract. The Kazakh government interprets the national security exemption broadly.
With the new subsoil law, the government
continues to weaken its stabilization guarantee. The government is broadly applying the national security exception to encompass security over strategic national resources.
The resource use contract contains significantly broader stabilization provisions than the new subsoil law, and these contract provisions currently apply to
us.
To date, the new subsoil law has not had a significant impact on Inkai. We continue to assess the impact. See our annual information form for an
overview of this change in law.
We also manage the risks listed on pages 52 to 53.
MANAGEMENT’S
DISCUSSION AND ANALYSIS 67
Uranium – operating properties
Rabbit Lake
|
|
|
|
|
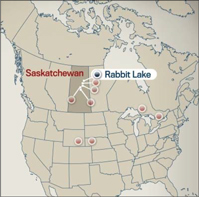
|
|
2015 Production 4.2M lbs
2016 Production Outlook 3.6M lbs
Estimated Reserves 11.9M lbs |
|
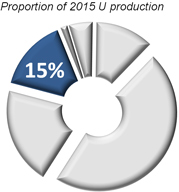
|
The Rabbit Lake operation, which opened in 1975, is the longest operating uranium production facility in North America, and
the second largest uranium mill in the world.
|
|
|
| Location |
|
Saskatchewan, Canada |
| Ownership |
|
100% |
| End product |
|
Uranium concentrates |
| ISO certification |
|
ISO 14001 certified |
| Mine type |
|
Underground |
| Estimated reserves |
|
11.9 million pounds (proven and probable), average grade U3O8: 0.59% |
| Estimated resources |
|
26.7 million pounds (indicated), average grade U3O8: 0.86% |
|
|
33.7 million pounds (inferred), average grade U3O8: 0.58% |
| Mining methods |
|
Vertical blasthole stoping |
| Licensed capacity |
|
Mill: maximum 16.9 million pounds per year; currently 11 million |
| Licence term |
|
Through October, 2023 |
| Total production: 1975 to 2015 |
|
202.2 million pounds |
| 2015 production |
|
4.2 million pounds |
| 2016 production outlook |
|
3.6 million pounds |
| Estimated decommissioning cost |
|
$203 million |
2015 UPDATE
Production
Production this year was unchanged from our
2014 production as a result of planned timing of production stopes, coupled with slightly improved ore grades.
Development and production continued at
the Eagle Point mine. At the mill, we continued to improve the efficiency of the mill operation schedule.
Temporary mining restrictions
On December 17, 2015, we announced that underground mining activities at Eagle Point were being restricted due to a rock fall in an inactive area of the
mine. As a precautionary measure, non-essential personnel were removed from the mine while the condition of the affected area was evaluated. Mine production was suspended, although milling of previously mined and transported ore continued through to
year end.
The assessment determined that repairs were necessary to support the ground in the affected area of the mine. The repairs were completed, along
with some further assessment of stability in other areas of the mine. The mine was reopened and normal operations resumed on February 3, 2016.
68 CAMECO
CORPORATION
Impairment
During the fourth quarter of 2015, we recognized a $210 million impairment charge related to our Rabbit Lake operation. The impairment was due to increased
uncertainty around future production sources for the Rabbit Lake mill as a result of the ongoing economic conditions. The amount of the charge was determined as the excess of carrying value over the recoverable amount. The recoverable amount of the
mill was determined to be $69 million.
PLANNING FOR THE FUTURE
Production
We expect to produce 3.6 million pounds
in 2016. The decrease compared to 2015 is the result of the restriction of mining activities at the end of 2015, which extended into 2016.
Tailings
capacity
Under our current licence, we expect to have sufficient tailings capacity to support milling of Eagle Point ore until about late 2017, based
upon expected ore tonnage, milling rates and tailings properties.
Our plan for fully utilizing the available tailings capacity of the Rabbit Lake In-Pit
Tailings Management facility requires regulatory approval in 2016 for which we have submitted the required applications. With these regulatory approvals and after we complete the necessary work on the existing pit, we expect to then have sufficient
tailings capacity to support milling of Eagle Point ore until at least 2021 based upon expected ore tonnage, milling rates, and tailings properties.
Exploration
We plan to continue our underground drilling
reserve replacement program in areas of interest north and northeast of the current mine workings in 2016. The drilling will be carried out from underground locations.
Reclamation
As part of our multi-year site-wide
reclamation plan, we spent over $0.7 million in 2015 to reclaim facilities that are no longer in use and plan to spend over $0.5 million in 2016.
MANAGING OUR RISKS
We manage the risks listed on pages
52 to 53.
MANAGEMENT’S
DISCUSSION AND ANALYSIS 69
Uranium – operating properties
Smith Ranch-Highland & Satellite Facilities
|
|
|
|
|
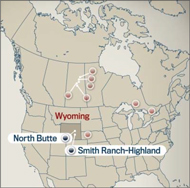
|
|
2015 Production 1.4M lbs
2016 Production Outlook 1.2M lbs
Estimated Reserves 8.0M lbs |
|
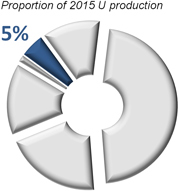
|
We operate Smith Ranch and Highland as a combined operation. Each has its own processing facility, but the
Smith Ranch central plant currently processes all the uranium, including uranium from satellite facilities. The Highland plant is currently idle. Together, they form the largest uranium production facility in the United States.
|
|
|
|
|
| Location |
|
|
|
Wyoming, US |
| Ownership |
|
|
|
100% |
| End product |
|
|
|
Uranium concentrates |
| ISO certification |
|
|
|
ISO 14001 certified |
| Estimated reserves |
|
Smith Ranch-Highland: |
|
6.2 million pounds (proven and probable), average grade U3O8: 0.09% |
| |
North Butte-Brown Ranch: |
|
1.8 million pounds (proven and probable), average grade U3O8: 0.08% |
| Estimated resources |
|
Smith Ranch-Highland: |
|
19.8 million pounds (measured and indicated), average grade U3O8: 0.06% |
|
|
|
|
7.7 million pounds (inferred), average grade U3O8: 0.05% |
|
|
North Butte-Brown Ranch |
|
8.8 million pounds (measured and indicated), average grade U3O8: 0.07% |
|
|
|
|
0.4 million pounds (inferred), average grade U3O8: 0.07% |
| Mining methods |
|
|
|
In situ recovery (ISR) |
| Licensed capacity |
|
|
|
Wellfields: 3 million pounds per year |
| |
|
|
Processing plants: 5.5 million pounds per year, including Highland mill |
| Licence term |
|
|
|
Pending renewal – see Production below |
| Total production: 2002 to 2015 |
|
21.8 million pounds |
| 2015 production |
|
|
|
1.4 million pounds |
| 2016 production outlook |
|
|
|
1.2 million pounds |
| Estimated decommissioning cost |
|
Smith Ranch-Highland: $206 million (US), North Butte: $22 million (US) |
2015 UPDATE
Production
We met our forecast for the year although, as
planned, production was 33% lower than in 2014, with new mine units and the North Butte satellite contributing to production at Smith Ranch-Highland in 2015.
The regulators continue to review our licence renewal application. We are allowed to continue with all previously approved activities during the licence
renewal process.
PLANNING FOR THE FUTURE
Production
In 2016, we expect to produce 1.2 million
pounds. The continued decrease is a result of market conditions, which led us to defer some wellfield development.
MANAGING OUR RISKS
We manage the risks listed on pages 52 to 53.
70 CAMECO
CORPORATION
Uranium – operating properties
Crow Butte
|
|
|
|
|
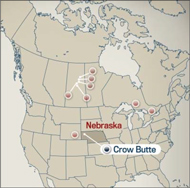
|
|
2015 Production 0.4M lbs
2016 Production Outlook 0.2M lbs
Estimated Reserves 0.7M lbs |
|
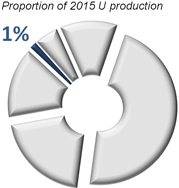
|
Crow Butte was discovered in 1980 and began production in 1991.
|
|
|
| Location |
|
Nebraska, US |
| Ownership |
|
100% |
| End product |
|
Uranium concentrates |
| ISO certification |
|
ISO 14001 certified |
| Estimated reserves |
|
0.7 million pounds (proven), average grade U3O8: 0.08% |
| Estimated resources |
|
15.2 million pounds (measured and indicated), average grade U3O8: 0.25% |
|
|
2.9 million pounds (inferred), average grade U3O8: 0.12% |
| Mining methods |
|
In situ recovery (ISR) |
| Licensed capacity
(processing plants and wellfields) |
|
2.0 million pounds per year |
| Licence term |
|
Through October, 2024 |
| Total production: 2002 to 2015 |
|
10.1 million pounds |
| 2015 production |
|
0.4 million pounds |
| 2016 production outlook |
|
0.2 million pounds |
| Estimated decommissioning cost |
|
$46 million (US) |
2015 UPDATE
Production
Production this year was higher than forecast,
but 33% lower than 2014 due to declining head grade.
PLANNING FOR THE FUTURE
Production
In 2016, we expect to produce 0.2 million
pounds. The head grade and overall production at Crow Butte is expected to continue to decline, as there are no new wellfields being developed under the current mine plan.
MANAGING OUR RISKS
We manage the risks listed on pages
52 to 53.
MANAGEMENT’S
DISCUSSION AND ANALYSIS 71
Uranium – projects under evaluation
Work on our projects under evaluation has been scaled back and will continue at a pace aligned with market signals.
Millennium
|
|
|
| Location |
|
Saskatchewan, Canada |
| Ownership |
|
69.9% |
| End product |
|
Uranium concentrates |
| Potential mine type |
|
Underground |
| Estimated resources (our share) |
|
53.0 million pounds (indicated), average grade U3O8: 2.39% |
|
|
20.2 million pounds (inferred), average grade U3O8: 3.19% |
BACKGROUND
The
Millennium deposit was discovered in 2000, and was delineated through geophysical survey and drilling work between 2000 and 2013. In 2012, we paid $150 million to acquire AREVA’s 27.94% interest in the project, bringing our interest in the
project to 69.9%. We are the operator.
Yeelirrie
|
|
|
| Location |
|
Western Australia |
| Ownership |
|
100% |
| End product |
|
Uranium concentrates |
| Potential mine type |
|
Open pit |
| Estimated resources |
|
127.3 million pounds (measured and indicated), average grade U3O8: 0.16% |
BACKGROUND
In 2012, we
paid $430 million (US) (as well as $22 million (US) in stamp duty) to acquire the Yeelirrie uranium deposit. The deposit was discovered in 1972 and is a near-surface calcrete-style deposit that is amenable to open pit mining techniques. It is one of
Australia’s largest undeveloped uranium deposits.
Kintyre
|
|
|
| Location |
|
Western Australia |
| Ownership |
|
70% |
| End product |
|
Uranium concentrates |
| Potential mine type |
|
Open pit |
| Estimated resources (our share) |
|
37.5 million pounds (indicated), average grade U3O8: 0.62% |
|
|
4.2 million pounds (inferred), average grade U3O8: 0.53% |
BACKGROUND
In 2008, we
paid $346 million (US) to acquire a 70% interest in Kintyre. In 2012, we recorded a $168 million write-down of the carrying value of our interest, due to a weakened uranium market. The Kintyre deposit is amenable to open pit mining techniques. We
are the operator.
2015 PROJECT UPDATES
We believe
that we have some of the best undeveloped uranium projects in the world. However, in the current market environment our primary focus is on uranium production and our tier-one assets. We continue to await a signal from the market that additional
production is needed prior to making any new development decisions.
This year, on our projects under evaluation we:
| • |
|
continued studies to assess the technical, environmental and financial aspects of each project |
| • |
|
at Kintyre and at other nearby regional exploration projects, we carried out further exploration work to test for potential satellite deposits. There were no significant results. |
| • |
|
we received environmental approval for Kintyre and continued to advance Yeelirrie through the environmental assessment process |
72 CAMECO
CORPORATION
PLANNING FOR THE FUTURE
2016 Planned activity
At Millennium, no work is planned,
as regulatory activity related to our final environmental impact statement continues to be on hold. Further progress towards a development decision is not expected until market conditions improve.
At Yeelirrie, we plan to further advance the project through the environmental assessment process and continue working on proposals required under the
Yeelirrie State Agreement. Under the State Agreement, the Western Australian Government provides a framework for the approval and development of the project. Detailed proposals for the development of a mine and related infrastructure must be
submitted to the government for approval by June 20, 2018, in order to retain the tenements and titles for the Yeelirrie project.
At Kintyre and
other nearby regional exploration projects, we expect to continue with further exploration work to test for potential satellite deposits.
MANAGING THE
RISKS
For all of our projects under evaluation, we manage the risks listed on pages 52 to 53.
MANAGEMENT’S
DISCUSSION AND ANALYSIS 73
Uranium – exploration and corporate development
Our exploration program is directed at replacing mineral reserves as they are depleted by our production, and ensuring our future growth. We have maintained an
active program even during periods of weak uranium prices, which has helped us secure land with exploration and development prospects that are among the best in the world, mainly in Canada, Australia, Kazakhstan and the US. Globally, our land
holdings total 1.6 million hectares (3.9 million acres). In northern Saskatchewan alone, we have direct interests in 600,000 hectares (1.5 million acres) of land covering many of the most prospective exploration areas of the Athabasca Basin.
Many of our prospects are located close to our existing operations where we have established infrastructure and capacity to expand.
For properties that
meet our investment criteria, we may partner with other companies through strategic alliances, equity holdings and traditional joint venture arrangements. Our leadership position and industry expertise in both exploration and corporate social
responsibility make us a partner of choice.
In 2015, we continued our exploration strategy of focusing on the most prospective projects in our portfolio.
Exploration is key to ensuring our long-term growth.

2015 UPDATE
Brownfield exploration
Brownfield exploration is uranium
exploration near our existing operations, and includes expenses for advanced exploration projects where uranium mineralization is being defined.
This
year, we spent $2 million on four brownfield exploration projects, $4 million on our projects under evaluation in Australia, and $2 million at Inkai and our US operations.
Regional exploration
We spent about $32 million on
regional exploration programs (including support costs), primarily in Saskatchewan and Australia.
PLANNING FOR THE FUTURE
We plan to maintain an active uranium exploration program and continue to focus on our core projects in Saskatchewan under our long-term exploration strategy.
Brownfield exploration
In 2016, we plan to spend
approximately $5 million on brownfield exploration and $4 million on projects under evaluation.
Regional exploration
We plan to spend about $36 million on 24 projects in Canada and Australia, the majority of which are at drill target stage. Among the larger expenditures
planned is $7 million on the Read Lake project, which is adjacent to McArthur River in Saskatchewan. We will also spend a total of $2 million at Inkai and in the US.
74 CAMECO
CORPORATION
ACQUISITION PROGRAM
We have a dedicated team looking for acquisition opportunities within the nuclear fuel cycle that could further add to our supply, support our sales
activities, and complement and enhance our business in the nuclear industry. We will invest when an opportunity is available at the right time and the right price. We strive to pursue corporate development initiatives that will leave us and our
shareholders in a fundamentally stronger position.
An acquisition opportunity is never assessed in isolation. Acquisitions must compete for investment
capital with our own internal growth opportunities. They are subject to our capital allocation process described in the strategy section, starting on page 14. Currently, given the conditions in the uranium market, and our extensive portfolio of
reserves and resources, our focus is on our tier-one assets. We expect that these assets will allow us to meet rising uranium demand with increased production from our best margin operations, and will help to mitigate risk in the event of prolonged
uncertainty.
MANAGEMENT’S
DISCUSSION AND ANALYSIS 75
Fuel services
Refining, conversion and fuel manufacturing
We control
about 20% of world UF6 conversion capacity and are a supplier of natural UO2. Our focus is on cost-competitiveness and operational
efficiency.
Our fuel services segment is strategically important because it helps support the growth of the uranium segment. Offering a range of products
and services to customers helps us broaden our business relationships and expand our uranium market share.
Blind River Refinery
|
|
|
|
|

|
|
Licensed Capacity 24.0M kgU of UO3 Licence renewal in
Feb, 2022 |
|
|
Blind River is the world’s largest commercial uranium refinery, refining uranium concentrates from mines around the world
into UO3.
|
|
|
| Location |
|
Ontario, Canada |
| Ownership |
|
100% |
| End product |
|
UO3 |
| ISO certification |
|
ISO 14001 certified |
| Licensed capacity |
|
18.0 million kgU as UO3 per year, approved to 24.0 million subject to completion of certain equipment upgrades (advancement depends on market conditions) |
| Licence term |
|
Through February, 2022 |
| Estimated decommissioning cost |
|
$39 million |
76 CAMECO
CORPORATION
Port Hope Conversion Services
|
|
|
|
|

|
|
Licensed Capacity 12.5M kgU of UF6 2.8M kgU of UO2
Licence renewal in Feb, 2017 |
|
|
Port Hope is the only uranium conversion facility in Canada and a supplier of UO2 for Canadian-made CANDU reactors.
|
|
|
| Location |
|
Ontario, Canada |
| Ownership |
|
100% |
| End product |
|
UF6, UO2 |
| ISO certification |
|
ISO 14001 certified |
| Licensed capacity |
|
12.5 million kgU as UF6 per year |
|
|
2.8 million kgU as UO2 per year |
| Licence term |
|
Through February, 2017 |
| Estimated decommissioning cost |
|
$102 million (an updated estimate is currently under regulatory review) |
Cameco Fuel Manufacturing Inc. (CFM)
CFM produces fuel bundles and reactor components for CANDU reactors.
|
|
|
| Location |
|
Ontario, Canada |
| Ownership |
|
100% |
| End product |
|
CANDU fuel bundles and components |
| ISO certification |
|
ISO 9001 certified, ISO 14001 certified |
| Licensed capacity |
|
1.2 million kgU as UO2 as finished bundles |
| Licence term |
|
Through February, 2022 |
| Estimated decommissioning cost |
|
$20 million |
2015 UPDATE
Production
Fuel services produced 9.7 million kgU,
16% lower than 2014. This was a result of our decision to decrease production in response to weak market conditions and the termination of our toll milling agreement with SFL in 2014.
Port Hope conversion facility cleanup and modernization (Vision in Motion)
The Vision in Motion project is currently in the feasibility stage and will continue with the CNSC licensing process in 2016, which is required to advance the
project.
Labour relations
Approximately 100
unionized employees at Cameco Fuel Manufacturing Inc.’s operations in Port Hope and Cobourg, Ontario accepted a new collective bargaining agreement in the second quarter of 2015. The employees, represented by the United Steelworkers local
14193, agreed to a three-year contract that includes a 7% wage increase over the term of the agreement. The previous contract expired on June 1, 2015.
MANAGEMENT’S
DISCUSSION AND ANALYSIS 77
PLANNING FOR THE FUTURE
Production
We have decreased our production target for
2016 to between 8 million and 9 million kgU in response to the continued weak market conditions.
Labour relations
The current collective bargaining agreement for our unionized employees at the Port Hope conversion facility expires on June 30, 2016. We will commence
the bargaining process in early 2016.
Regulatory
The current operating licence for the Port Hope conversion facility expires in February 2017. The CNSC relicensing process will take place in 2016.
MANAGING OUR RISKS
We also manage the risks listed on
pages 52 to 53.
78 CAMECO
CORPORATION
NUKEM GmbH
|
|
|
| Offices |
|
Alzenau, Germany (Headquarters, NUKEM GmbH) |
|
|
Connecticut, US (Subsidiary, NUKEM Inc.) |
| Ownership |
|
100% |
| Activity |
|
Trading of uranium and uranium-related products |
| 2015 sales1 |
|
10.7 million pounds U3O8 |
| 2016 forecast sales |
|
9 to 10 million pounds U3O8 |
| 1 |
Includes sales of 0.9 million pounds and revenue of $19.3 million between our uranium, fuel services and NUKEM segments. |
BACKGROUND
In 2013, we acquired NUKEM, one of the
world’s leading traders of uranium and uranium-related products. On closing, we paid €107 million ($140 million (US)) and assumed NUKEM’s net debt of about €84 million ($111 million (US)).
NUKEM has access to contracted volumes and inventories in diverse geographic locations as well as scope for opportunistic trading of uranium and
uranium-related products. This enables NUKEM to provide a wide range of solutions to its customers that may fall outside the scope of typical uranium sourcing and selling arrangements. Its trading strategy is nonspeculative and seeks to match
quantities and pricing structures of its long-term supply and delivery contracts, minimizing exposure to commodity price fluctuations and locking in profit margins.
NUKEM’s main customers are commercial nuclear power plants using enriched uranium fuel, typically large utilities that are either government owned, or
large-scale utilities with multibillion-dollar market capitalizations and strong credit ratings. NUKEM also trades with converters, enrichers, other traders and investors.
NUKEM’s business model
NUKEM’s purchase
contracts are with long-standing supply partners and its sales contracts are with blue-chip utilities which have strong credit ratings.
MANAGING OUR
RISKS
NUKEM manages the risks associated with trading and brokering nuclear fuels and services. It participates in the uranium spot market, making
purchases to place material in higher price contracts. There are risks associated with these spot market purchases, including the risk of losses. NUKEM is also subject to counterparty risk of suppliers not meeting their delivery commitments and
purchasers not paying for the product delivered. If a counterparty defaults on a payment or other obligation or becomes insolvent, this could significantly affect NUKEM’s contribution to our earnings, cash flows, financial condition or results
of operations.
MANAGEMENT’S
DISCUSSION AND ANALYSIS 79
Mineral reserves and resources
Our mineral reserves and resources are the foundation of our company and fundamental to our success.
We have interests in a number of uranium properties. The tables in this section show our estimates of the proven and probable reserves, and measured,
indicated, and inferred resources at those properties. However, only three of the properties listed in those tables are material uranium properties for us: McArthur River/Key Lake, Cigar Lake and Inkai.
We estimate and disclose mineral reserves and resources in five categories, using the definitions adopted by the Canadian Institute of Mining, Metallurgy and
Petroleum, and in accordance with Canadian National Instrument 43-101 – Standards of Disclosure for Mineral Projects (NI 43-101), developed by the Canadian Securities Administrators. You can find out more about these categories at
www.cim.org.
About mineral resources
Mineral
resources do not have demonstrated economic viability, but have reasonable prospects for eventual economic extraction. They fall into three categories: measured, indicated and inferred. Our reported mineral resources are exclusive of mineral
reserves.
| • |
|
Measured and indicated mineral resources can be estimated with sufficient confidence to allow the appropriate application of technical, economic, marketing, legal, environmental, social and governmental factors to
support evaluation of the economic viability of the deposit. |
| |
• |
|
measured resources: we can confirm both geological and grade continuity to support detailed mine planning |
| |
• |
|
indicated resources: we can reasonably assume geological and grade continuity to support mine planning |
| • |
|
Inferred mineral resources are estimated using limited information. We do not have enough confidence to evaluate their economic viability in a meaningful way. You should not assume that all or any part of an
inferred mineral resource will be upgraded to an indicated or measured mineral resource, but it is reasonably expected that the majority of inferred mineral resources could be upgraded to indicated mineral resources with continued exploration.
|
Our share of uranium in the following mineral resource tables is based on our respective ownership interests, except for Inkai which is
based on our interest in potential production (57.5%), which differs from our ownership interest (60%). Mineral resources that are not mineral reserves have no demonstrated economic viability.
About mineral reserves
Mineral reserves are the
economically mineable part of measured and/or indicated mineral resources demonstrated by at least a preliminary feasibility study. The reference point at which mineral reserves are defined is the point where the ore is delivered to the processing
plant. Mineral reserves fall into two categories:
| • |
|
proven reserves: the economically mineable part of a measured resource for which at least a preliminary feasibility study demonstrates that economic extraction is justified |
| • |
|
probable reserves: the economically mineable part of a measured and/or indicated resource for which at least a preliminary feasibility study demonstrates that economic extraction is justified |
We use current geological models, constant dollar average uranium prices of $57 to $59 (US) per pound
U3O8, and current or projected operating costs and mine plans to estimate our mineral reserves, allowing for dilution and mining losses.
We apply our standard data verification process for every estimate.
Our share of uranium in the mineral reserves table below is based on our respective
ownership interests, except for Inkai which is based on our interest in planned production (57.5%) assuming an annual production rate of 5.2 million pounds, which differs from our ownership interest (60%).
80 CAMECO
CORPORATION
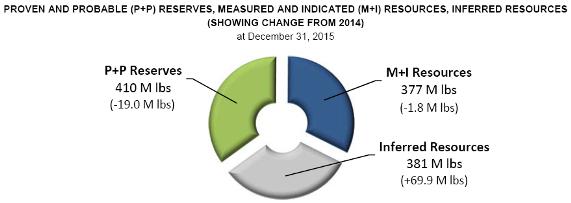
Changes this year
Our
share of proven and probable mineral reserves decreased from 429 million pounds U3O8 at the end of 2014, to 410 million pounds
at the end of 2015. The change was primarily the result of production, which removed 30 million pounds from our mineral inventory. However, the decrease was partially offset due to the replacement of raiseboring with blasthole stoping in some
areas of McArthur River, as well as additional information from drilling surface freeze holes at Cigar Lake, which both resulted in higher reserves when the related probable reserves were converted to proven reserves.
Measured and indicated mineral resources decreased from 379 million pounds U3O8 at the end of 2014, to 377 million pounds at the end of 2015. Our share of inferred mineral resources is 380 million pounds U3O8, an increase of 68 million pounds from the end of 2014. The variance in mineral resources was mainly the result of:
| • |
|
the addition of 4.5 million pounds U3O8 to indicated resources and 8 million pounds to inferred
resources at Rabbit Lake from additional drilling, and from a revision to the equivalent grade formula |
| • |
|
first time reporting for the Fox Lake deposit, on the Read Lake property near McArthur River, adding 53 million pounds U3O8 to inferred resources |
| • |
|
the addition of 13 million pounds U3O8 of inferred resources from the Gryphon deposit on the Wheeler
River property |
| • |
|
a revised pit shell defining the mineral resources at Kintyre |
Qualified persons
The technical and scientific information discussed in this MD&A for our material properties (McArthur River/Key Lake, Cigar Lake and Inkai) was approved by
the following individuals who are qualified persons for the purposes of NI 43-101:
MCARTHUR RIVER/KEY LAKE
| • |
|
Alain G. Mainville, director, mineral resources management, Cameco |
| • |
|
David Bronkhorst, vice-president, mining and technology, Cameco |
| • |
|
Baoyao Tang, technical superintendent, McArthur River, Cameco |
CIGAR LAKE
| • |
|
Alain G. Mainville, director, mineral resources management, Cameco |
| • |
|
Leslie Yesnik, general manager, Cigar Lake, Cameco |
| • |
|
Scott Bishop, manager, technical services, Cameco
|
INKAI
| • |
|
Alain G. Mainville, director, mineral resources management, Cameco |
| • |
|
Darryl Clark, general manager, JV Inkai |
| • |
|
Lawrence Reimann, manager, technical services, Cameco Resources |
| • |
|
Bryan Soliz, principal geologist, mineral resources management, Cameco |
MANAGEMENT’S
DISCUSSION AND ANALYSIS 81
Important information about mineral reserve and resource estimates
Although we have carefully prepared and verified the mineral reserve and resource figures in this document, the figures are estimates, based in part on
forward-looking information.
Estimates are based on our knowledge, mining experience, analysis of drilling results, the quality of available data and
management’s best judgment. They are, however, imprecise by nature, may change over time, and include many variables and assumptions, including:
| • |
|
geological interpretation |
| • |
|
commodity prices and currency exchange rates |
| • |
|
operating and capital costs |
There is no assurance that the indicated levels of uranium will be produced, and
we may have to re-estimate our mineral reserves based on actual production experience. Changes in the price of uranium, production costs or recovery rates could make it unprofitable for us to operate or develop a particular site or sites for a
period of time. See page 2 for information about forward-looking information.
Please see our mineral reserves and resources section of our annual
information form for the specific assumptions, parameters and methods used for McArthur River, Inkai and Cigar Lake mineral reserve and resource estimates.
Important information for US investors
While the terms
measured, indicated and inferred mineral resources are recognized and required by Canadian securities regulatory authorities, the US Securities and Exchange Commission (SEC) does not recognize them. Under US standards, mineralization may not be
classified as a ‘reserve’ unless it has been determined at the time of reporting that the mineralization could be economically and legally produced or extracted. US investors should not assume that:
| • |
|
any or all of a measured or indicated mineral resource will ever be converted into proven or probable mineral reserves |
| • |
|
any or all of an inferred mineral resource exists or is economically or legally mineable, or will ever be upgraded to a higher category. Under Canadian securities regulations, estimates of inferred resources may not
form the basis of feasibility or pre-feasibility studies. Inferred resources have a great amount of uncertainty as to their existence and economic and legal feasibility. |
The requirements of Canadian securities regulators for identification of ‘reserves’ are also not the same as those of the SEC, and mineral reserves
reported by us in accordance with Canadian requirements may not qualify as reserves under SEC standards.
Other information concerning descriptions of
mineralization, mineral reserves and resources may not be comparable to information made public by companies that comply with the SEC’s reporting and disclosure requirements for US domestic mining companies, including Industry Guide 7.
82 CAMECO
CORPORATION
Mineral reserves
As at December 31, 2015 (100% basis – only the shaded column shows our share)
PROVEN AND PROBABLE
(tonnes in thousands; pounds in
millions)
|
|
|
|
|
|
|
|
|
|
|
|
|
|
|
|
|
|
|
|
|
|
|
|
|
|
|
|
|
|
|
|
|
|
|
|
|
|
|
|
|
|
|
|
|
|
|
| |
|
|
|
PROVEN |
|
|
PROBABLE |
|
|
TOTAL MINERAL RESERVES |
|
|
OUR
RESERVES
CONTENT
(LBS
U3O8) |
|
|
METALLURGICAL
RECOVERY (%) |
|
| PROPERTY |
|
MINING
METHOD |
|
TONNES |
|
|
GRADE
% U3O8 |
|
|
CONTENT
(LBS U3O8) |
|
|
TONNES |
|
|
GRADE
% U3O8 |
|
|
CONTENT
(LBS U3O8) |
|
|
TONNES |
|
|
GRADE
% U3O8 |
|
|
CONTENT
(LBS U3O8) |
|
|
|
| McArthur River |
|
UG |
|
|
1,195.3 |
|
|
|
9.62 |
|
|
|
253.5 |
|
|
|
199.8 |
|
|
|
18.84 |
|
|
|
83.0 |
|
|
|
1,395.1 |
|
|
|
10.94 |
|
|
|
336.5 |
|
|
|
234.9 |
|
|
|
98.7 |
|
| Cigar Lake |
|
UG |
|
|
226.1 |
|
|
|
21.93 |
|
|
|
109.3 |
|
|
|
375.7 |
|
|
|
13.55 |
|
|
|
112.3 |
|
|
|
601.8 |
|
|
|
16.70 |
|
|
|
221.6 |
|
|
|
110.9 |
|
|
|
98.5 |
|
| Rabbit Lake |
|
UG |
|
|
10.6 |
|
|
|
0.34 |
|
|
|
0.1 |
|
|
|
902.9 |
|
|
|
0.59 |
|
|
|
11.8 |
|
|
|
913.5 |
|
|
|
0.59 |
|
|
|
11.9 |
|
|
|
11.9 |
|
|
|
97.0 |
|
| Key Lake |
|
OP |
|
|
61.1 |
|
|
|
0.52 |
|
|
|
0.7 |
|
|
|
— |
|
|
|
— |
|
|
|
— |
|
|
|
61.1 |
|
|
|
0.52 |
|
|
|
0.7 |
|
|
|
0.6 |
|
|
|
98.7 |
|
| Inkai |
|
ISR |
|
|
1,139.5 |
|
|
|
0.08 |
|
|
|
2.1 |
|
|
|
50,476.4 |
|
|
|
0.07 |
|
|
|
72.9 |
|
|
|
51,615.9 |
|
|
|
0.07 |
|
|
|
75.0 |
|
|
|
43.1 |
|
|
|
85.0 |
|
| Smith Ranch-Highland |
|
ISR |
|
|
1,127.8 |
|
|
|
0.10 |
|
|
|
2.5 |
|
|
|
1,871.0 |
|
|
|
0.09 |
|
|
|
3.8 |
|
|
|
2,998.8 |
|
|
|
0.09 |
|
|
|
6.2 |
|
|
|
6.2 |
|
|
|
80.0 |
|
| North Butte-Brown Ranch |
|
ISR |
|
|
644.2 |
|
|
|
0.08 |
|
|
|
1.2 |
|
|
|
373.8 |
|
|
|
0.08 |
|
|
|
0.7 |
|
|
|
1,018.0 |
|
|
|
0.08 |
|
|
|
1.8 |
|
|
|
1.8 |
|
|
|
60.0 |
|
| Crow Butte |
|
ISR |
|
|
412.5 |
|
|
|
0.08 |
|
|
|
0.7 |
|
|
|
— |
|
|
|
— |
|
|
|
— |
|
|
|
412.5 |
|
|
|
0.08 |
|
|
|
0.7 |
|
|
|
0.7 |
|
|
|
85.0 |
|
|
|
|
|
|
|
|
|
|
|
|
|
|
|
|
|
|
|
|
|
|
|
|
|
|
|
|
|
|
|
|
|
|
|
|
|
|
|
|
|
|
|
|
|
|
|
|
| Total |
|
|
|
|
4,817.2 |
|
|
|
— |
|
|
|
370.1 |
|
|
|
54,199.5 |
|
|
|
— |
|
|
|
284.4 |
|
|
|
59,016.7 |
|
|
|
— |
|
|
|
654.5 |
|
|
|
410.2 |
|
|
|
— |
|
|
|
|
|
|
|
|
|
|
|
|
|
|
|
|
|
|
|
|
|
|
|
|
|
|
|
|
|
|
|
|
|
|
|
|
|
|
|
|
|
|
|
|
|
|
|
|
(UG – underground, OP – open pit, ISR – in situ recovery, totals may not add up due to rounding.
Note that the estimates in the above table:
| • |
|
use constant dollar average uranium prices of $57 to $59 (US)/lb U3O8 |
| • |
|
are based on an average exchange rate of $1.00 US=$1.15 to $1.25 Cdn |
We do not expect these mineral reserve
estimates to be materially affected by metallurgical, environmental, permitting, legal, taxation, socio-economic, political, marketing or other relevant issues.
Metallurgical recovery
We report mineral reserves as the
quantity of contained ore supporting our mining plans, and provide an estimate of the metallurgical recovery for each uranium property. The estimate of the amount of valuable product that can be physically recovered by the metallurgical extraction
process is obtained by multiplying quantity of contained metal (content) by the planned metallurgical recovery percentage. The content and our share of uranium in the table above are before accounting for estimated metallurgical recovery.
MANAGEMENT’S
DISCUSSION AND ANALYSIS 83
Mineral resources
As at December 31, 2015 (100% – only the shaded columns show our share)
MEASURED, INDICATED AND INFERRED
(tonnes in thousands;
pounds in millions)
|
|
|
|
|
|
|
|
|
|
|
|
|
|
|
|
|
|
|
|
|
|
|
|
|
|
|
|
|
|
|
|
|
|
|
|
|
|
|
|
|
|
|
|
|
|
|
|
|
| |
|
MEASURED RESOURCES (M) |
|
|
INDICATED RESOURCES (I) |
|
|
|
|
|
OUR
SHARE
TOTAL M+I
CONTENT
(LBS U3O8) |
|
|
INFERRED RESOURCES |
|
|
OUR
SHARE
INFERRED
CONTENT
(LBS U3O8) |
|
| PROPERTY |
|
TONNES |
|
|
GRADE
% U3O8 |
|
|
CONTENT
(LBS U3O8) |
|
|
TONNES |
|
|
GRADE
% U3O8 |
|
|
CONTENT
(LBS U3O8) |
|
|
TOTAL M+I
CONTENT
(LBS U3O8) |
|
|
|
TONNES |
|
|
GRADE
% U3O8 |
|
|
CONTENT
(LBS U3O8) |
|
|
| McArthur River |
|
|
62.0 |
|
|
|
3.83 |
|
|
|
5.2 |
|
|
|
4.8 |
|
|
|
3.02 |
|
|
|
0.3 |
|
|
|
5.6 |
|
|
|
3.9 |
|
|
|
344.2 |
|
|
|
7.72 |
|
|
|
58.6 |
|
|
|
40.9 |
|
| Cigar Lake |
|
|
2.7 |
|
|
|
6.06 |
|
|
|
0.4 |
|
|
|
17.5 |
|
|
|
7.59 |
|
|
|
2.9 |
|
|
|
3.3 |
|
|
|
1.6 |
|
|
|
284.7 |
|
|
|
16.43 |
|
|
|
103.1 |
|
|
|
51.6 |
|
| Rabbit Lake |
|
|
— |
|
|
|
— |
|
|
|
— |
|
|
|
1,402.7 |
|
|
|
0.86 |
|
|
|
26.7 |
|
|
|
26.7 |
|
|
|
26.7 |
|
|
|
2,645.6 |
|
|
|
0.58 |
|
|
|
33.7 |
|
|
|
33.7 |
|
| Millennium |
|
|
— |
|
|
|
— |
|
|
|
— |
|
|
|
1,442.6 |
|
|
|
2.39 |
|
|
|
75.9 |
|
|
|
75.9 |
|
|
|
53.0 |
|
|
|
412.4 |
|
|
|
3.19 |
|
|
|
29.0 |
|
|
|
20.2 |
|
| Wheeler River |
|
|
— |
|
|
|
— |
|
|
|
— |
|
|
|
166.4 |
|
|
|
19.13 |
|
|
|
70.2 |
|
|
|
70.2 |
|
|
|
21.1 |
|
|
|
842.5 |
|
|
|
2.38 |
|
|
|
44.1 |
|
|
|
13.2 |
|
| Fox Lake |
|
|
— |
|
|
|
— |
|
|
|
— |
|
|
|
— |
|
|
|
— |
|
|
|
— |
|
|
|
— |
|
|
|
— |
|
|
|
386.7 |
|
|
|
7.99 |
|
|
|
68.1 |
|
|
|
53.3 |
|
| Tamarack |
|
|
— |
|
|
|
— |
|
|
|
— |
|
|
|
183.8 |
|
|
|
4.42 |
|
|
|
17.9 |
|
|
|
17.9 |
|
|
|
10.3 |
|
|
|
45.6 |
|
|
|
1.02 |
|
|
|
1.0 |
|
|
|
0.6 |
|
| Kintyre |
|
|
— |
|
|
|
— |
|
|
|
— |
|
|
|
3,897.7 |
|
|
|
0.62 |
|
|
|
53.5 |
|
|
|
53.5 |
|
|
|
37.5 |
|
|
|
517.1 |
|
|
|
0.53 |
|
|
|
6.0 |
|
|
|
4.2 |
|
| Yeelirrie |
|
|
24,013.5 |
|
|
|
0.17 |
|
|
|
92.4 |
|
|
|
12,626.5 |
|
|
|
0.13 |
|
|
|
34.9 |
|
|
|
127.3 |
|
|
|
127.3 |
|
|
|
— |
|
|
|
— |
|
|
|
— |
|
|
|
— |
|
| Inkai |
|
|
— |
|
|
|
— |
|
|
|
— |
|
|
|
31,366.1 |
|
|
|
0.08 |
|
|
|
52.6 |
|
|
|
52.6 |
|
|
|
30.3 |
|
|
|
250,958.6 |
|
|
|
0.05 |
|
|
|
251.0 |
|
|
|
144.3 |
|
|
|
|
|
|
|
|
|
|
|
|
|
|
| Smith Ranch-Highland |
|
|
1,241.9 |
|
|
|
0.11 |
|
|
|
2.9 |
|
|
|
14,338.1 |
|
|
|
0.05 |
|
|
|
16.9 |
|
|
|
19.8 |
|
|
|
19.8 |
|
|
|
6,861.0 |
|
|
|
0.05 |
|
|
|
7.7 |
|
|
|
7.7 |
|
| North Butte-Brown Ranch |
|
|
232.6 |
|
|
|
0.08 |
|
|
|
0.4 |
|
|
|
5,530.3 |
|
|
|
0.07 |
|
|
|
8.4 |
|
|
|
8.8 |
|
|
|
8.8 |
|
|
|
294.5 |
|
|
|
0.07 |
|
|
|
0.4 |
|
|
|
0.4 |
|
| Gas Hills-Peach |
|
|
687.2 |
|
|
|
0.11 |
|
|
|
1.7 |
|
|
|
3,626.1 |
|
|
|
0.15 |
|
|
|
11.6 |
|
|
|
13.3 |
|
|
|
13.3 |
|
|
|
3,307.5 |
|
|
|
0.08 |
|
|
|
6.0 |
|
|
|
6.0 |
|
| Crow Butte |
|
|
1,418.2 |
|
|
|
0.21 |
|
|
|
6.6 |
|
|
|
1,354.9 |
|
|
|
0.29 |
|
|
|
8.6 |
|
|
|
15.2 |
|
|
|
15.2 |
|
|
|
1,135.2 |
|
|
|
0.12 |
|
|
|
2.9 |
|
|
|
2.9 |
|
| Ruby Ranch |
|
|
— |
|
|
|
— |
|
|
|
— |
|
|
|
2,215.3 |
|
|
|
0.08 |
|
|
|
4.1 |
|
|
|
4.1 |
|
|
|
4.1 |
|
|
|
56.2 |
|
|
|
0.14 |
|
|
|
0.2 |
|
|
|
0.2 |
|
| Shirley Basin |
|
|
89.2 |
|
|
|
0.16 |
|
|
|
0.3 |
|
|
|
1,638.2 |
|
|
|
0.11 |
|
|
|
4.1 |
|
|
|
4.4 |
|
|
|
4.4 |
|
|
|
508.0 |
|
|
|
0.10 |
|
|
|
1.1 |
|
|
|
1.1 |
|
|
|
|
|
|
|
|
|
|
|
|
|
|
|
|
|
|
|
|
|
|
|
|
|
|
|
|
|
|
|
|
|
|
|
|
|
|
|
|
|
|
|
|
|
|
|
|
|
|
| Total |
|
|
27,747.4 |
|
|
|
— |
|
|
|
109.9 |
|
|
|
79,811.2 |
|
|
|
— |
|
|
|
388.7 |
|
|
|
498.5 |
|
|
|
377.2 |
|
|
|
268,599.9 |
|
|
|
— |
|
|
|
613.0 |
|
|
|
380.5 |
|
|
|
|
|
|
|
|
|
|
|
|
|
|
|
|
|
|
|
|
|
|
|
|
|
|
|
|
|
|
|
|
|
|
|
|
|
|
|
|
|
|
|
|
|
|
|
|
|
|
Totals may not add up due to rounding.
Note that mineral resources:
| • |
|
do not include amounts that have been identified as mineral reserves |
| • |
|
do not have demonstrated economic viability |
84 CAMECO
CORPORATION
Additional information
Due to the nature of our business, we are required to make estimates that affect the amount of assets and liabilities, revenues and expenses, commitments and
contingencies we report. We base our estimates on our experience, our best judgment, guidelines established by the Canadian Institute of Mining, Metallurgy and Petroleum and on assumptions we believe are reasonable.
We believe the following critical accounting estimates reflect the more significant judgments used in the preparation of our financial statements. These
estimates affect all of our segments, unless otherwise noted.
Decommissioning and reclamation
In our uranium and fuel services segments, we are required to estimate the cost of decommissioning and reclamation for each operation, but we normally do not
incur these costs until an asset is nearing the end of its useful life. Regulatory requirements and decommissioning methods could change during that time, making our actual costs different from our estimates. A significant change in these costs or
in our mineral reserves could have a material impact on our net earnings and financial position. See note 17 to the financial statements.
Property,
plant and equipment
We depreciate property, plant and equipment primarily using the unit-of-production method, where the carrying value is reduced as
resources are depleted. A change in our mineral reserves would change our depreciation expenses, and such a change could have a material impact on amounts charged to earnings.
We assess the carrying values of property, plant and equipment and goodwill every year, or more often if necessary. If we determine that we cannot recover the
carrying value of an asset or goodwill, we write off the unrecoverable amount against current earnings. We base our assessment of recoverability on assumptions and judgments we make about future prices, production costs, our requirements for
sustaining capital and our ability to economically recover mineral reserves. A material change in any of these assumptions could have a significant impact on the potential impairment of these assets.
In performing impairment assessments of long-lived assets, assets that cannot be assessed individually are grouped together into the smallest group of assets
that generates cash inflows that are largely independent of the cash inflows from other assets or groups of assets. Management is required to exercise judgment in identifying these cash generating units.
Taxes
When we are preparing our financial statements, we
estimate taxes in each jurisdiction we operate in, taking into consideration different tax rates, non-deductible expenses, valuation of deferred tax assets, changes in tax laws and our expectations for future results.
We base our estimates of deferred income taxes on temporary differences between the assets and liabilities we report in our financial statements, and the
assets and liabilities determined by the tax laws in the various countries we operate in. We record deferred income taxes in our financial statements based on our estimated future cash flows, which includes estimates of non-deductible expenses. If
these estimates are not accurate, there could be a material impact on our net earnings and financial position.
Commencement of production stage
When we determine that a mining property has reached the production stage, capitalization of development ceases, and depreciation of the mining
property begins and is charged to earnings. Production is reached when management determines that the mine is able to produce at a consistent or sustainably increasing level. This determination is a matter of judgment. See note 2 to the financial
statements for further information on the criteria that we used to make this assessment.
MANAGEMENT’S
DISCUSSION AND ANALYSIS 85
Purchase price allocations
The purchase price related to a business combination or asset acquisition is allocated to the underlying acquired assets and liabilities based on their
estimated fair values at the time of acquisition. The determination of fair value requires us to make assumptions, estimates and judgments regarding future events. The allocation process is inherently subjective and impacts the amounts assigned to
individually identifiable assets and liabilities. As a result, the purchase price allocation impacts our reported assets and liabilities and future net earnings due to the impact on future depreciation and amortization expense and impairment tests.
Determination of joint control
We conduct certain
operations through joint ownership interests. Judgment is required in assessing whether we have joint control over the investee, which involves determining the relevant activities of the arrangement and whether decisions around relevant activities
require unanimous consent. Judgment is also required to determine whether a joint arrangement should be classified as a joint venture or joint operation. Classifying the arrangement requires us to assess our rights and obligations arising from the
arrangement. Specifically, management considers the structure of the joint arrangement and whether it is structured through a separate vehicle. When structured through a separate vehicle, we also consider the rights and obligations arising from the
legal form of the separate vehicle, the terms of the contractual arrangements and other facts and circumstances, when relevant. This judgment influences whether we equity account or proportionately consolidate our interest in the arrangement.
Controls and procedures
We have evaluated the
effectiveness of our disclosure controls and procedures and internal control over financial reporting as of December 31, 2015, as required by the rules of the US Securities and Exchange Commission and the Canadian Securities Administrators.
Management, including our Chief Executive Officer (CEO) and our Chief Financial Officer (CFO), supervised and participated in the evaluation, and
concluded that our disclosure controls and procedures are effective to provide a reasonable level of assurance that the information we are required to disclose in reports we file or submit under securities laws is recorded, processed, summarized and
reported accurately, and within the time periods specified. It should be noted that, while the CEO and CFO believe that our disclosure controls and procedures provide a reasonable level of assurance that they are effective, they do not expect the
disclosure controls and procedures or internal control over financial reporting to be capable of preventing all errors and fraud. A control system, no matter how well conceived or operated, can provide only reasonable, not absolute, assurance that
the objectives of the control system are met.
Management, including our CEO and our CFO, is responsible for establishing and maintaining internal control
over financial reporting and conducted an evaluation of the effectiveness of our internal control over financial reporting based on the Internal Control — Integrated Framework (2013) issued by the Committee of Sponsoring Organizations of
the Treadway Commission (COSO). Based on this evaluation, management concluded that our internal control over financial reporting was effective as of December 31, 2015. We have not made any change to our internal control over financial
reporting during the 2015 fiscal year that has materially affected, or is reasonably likely to materially affect, our internal control over financial reporting.
New standards and interpretations not yet adopted
A
number of new standards and amendments to existing standards are not yet effective for the year ended December 31, 2015, and have not been applied in preparing these consolidated financial statements. Cameco does not intend to early adopt any
of the following amendments to existing standards and does not expect the amendments to have a material impact on the financial statements, unless otherwise noted.
IFRS 15, Revenue from Contracts with Customers (IFRS 15) – In May 2014, the IASB issued IFRS 15 which is effective for periods beginning on
or after January 1, 2018 and is to be applied retrospectively. IFRS 15 clarifies the principles for recognizing revenue from contracts with customers. The extent of the impact of adoption of IFRS 15 has not yet been determined.
86 CAMECO
CORPORATION
IFRS 9, Financial Instruments (IFRS 9) – In July 2014, the IASB issued IFRS 9. IFRS 9 replaces the
existing guidance in IAS 39, Financial Instruments: Recognition and Measurement (IAS 39). IFRS 9 includes revised guidance on the classification and measurement of financial assets, a new expected credit loss model for calculating impairment
on financial assets and new hedge accounting requirements. It also carries forward, from IAS 39, guidance on recognition and derecognition of financial instruments.
IFRS 9 is effective for annual periods beginning on or after January 1, 2018, with early adoption of the new standard permitted. Cameco does not intend
to early adopt IFRS 9. The extent of the impact of adoption of IFRS 9 has not yet been determined.
IFRS 16, Leases (IFRS 16) – In January
2016, the IASB issued IFRS 16 which is effective for periods beginning on or after January 1, 2019, with early adoption permitted. IFRS 16 eliminates the current dual model for lessees, which distinguishes between on-balance sheet finance
leases and off-balance sheet operating leases. Instead, there is a single, on-balance sheet accounting model that is similar to current finance lease accounting. The extent of the impact of adoption of IFRS 16 has not yet been determined.
MANAGEMENT’S
DISCUSSION AND ANALYSIS 87
Cameco (NYSE:CCJ)
Historical Stock Chart
From Mar 2024 to Apr 2024

Cameco (NYSE:CCJ)
Historical Stock Chart
From Apr 2023 to Apr 2024
