UNITED STATES
SECURITIES AND EXCHANGE COMMISSION
Washington, D.C. 20549
_________________
FORM 6-K
REPORT OF FOREIGN PRIVATE ISSUER
PURSUANT TO RULE 13a-16 OR 15d-16 UNDER
THE SECURITIES EXCHANGE ACT OF 1934
Date: February 2, 2016
UBS Group AG
Commission File Number: 1-36764
UBS AG
Commission File Number: 1-15060
(Registrants' Names)
Bahnhofstrasse 45, Zurich, Switzerland, and
Aeschenvorstadt 1, Basel, Switzerland
(Address of principal executive office)
Indicate by check mark whether the registrant files or
will file annual reports under cover of Form 20‑F or Form 40-F.
Form 20-F x
Form 40-F o
This Form 6-K consists of the presentation
materials related to the Fourth Quarter 2015 Results of UBS Group AG and UBS
AG, and the related speaker notes, which appear immediately following this
page.


UBS
Fourth Quarter 2015 Earnings Call Remarks
February
2, 2016
Sergio P. Ermotti (Group CEO): Opening
remarks
SLIDE 2 – 2015 – Strong results and execution
Thank
you, Caroline. Good morning everyone.
2015
was another year of disciplined execution, where once again, we showed that we
can deliver sound advice to clients and strong returns to our shareholders in a
variety of market conditions.
For
the full year, we reported a net profit attributable to shareholders of 6.2
billion Swiss francs, a 79% increase over 2014. Adjusted profit before tax more
than doubled to 5.6 billion, and we delivered a return on tangible equity of
almost 14%, above our 2015 target of about 10%. Diluted earnings per share totaled
1.64 francs.
As
we expected, we were faced with exceptional levels of volatility, a challenging
macroeconomic outlook, escalating geopolitical tensions and a continued
deterioration in the risk appetite of our clients. It is no surprise that the
turbulent markets continue to impact investor sentiment. And our clients'
reluctance to remain fully invested has not changed. Our response is simple and
consistent, we stay close to our clients, and maintain our strong risk
discipline while carefully managing resources.
We
made excellent progress meeting future regulatory requirements in 2015. We
created UBS Switzerland AG, established our Group service company as a
subsidiary of UBS Group AG, and we successfully issued our first TLAC and AT1
instruments from our holding company.
In
addition, we delivered a net cost reduction in the Corporate Center of 1.1
billion francs compared to the full year 2013. While we are slightly behind
schedule on cost reduction, we are picking up the pace of execution and I am
confident we can deliver on our 2.1 billion net cost reduction target by the
end of next year as previously communicated.
In Non-core and Legacy Portfolio, we continued to
successfully reduce resource utilization by taking down risk-weighted assets by
14% and LRD by 47 billion.
Maintaining
a strong capital position remains a key competitive advantage for UBS, and we
continue to have the best Basel 3 CET1 basis among large global banks, with a
fully applied CET1 ratio of 14.5%. Our fully applied Swiss SRB leverage ratio
increased to 5.3%, and we believe we are well positioned to comply with future
Swiss TBTF requirements.
As
a consequence of our strong financial performance last year, and in line with
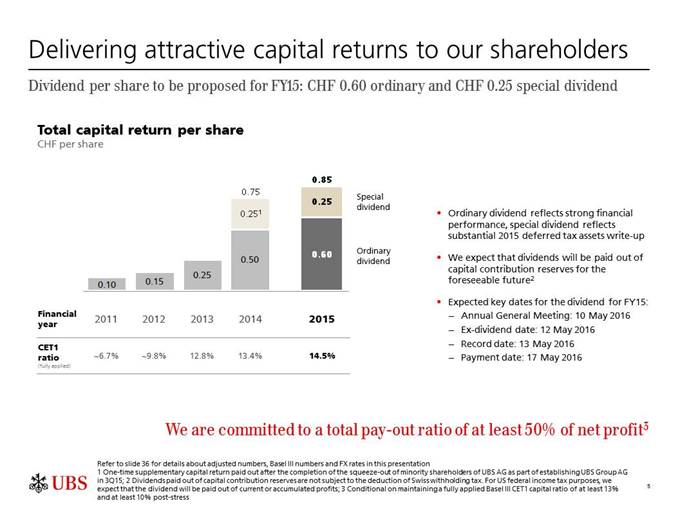
our capital returns policy, the Board of Directors intends to propose for
shareholder approval, an ordinary dividend of 60 Rappen per share, up 20%
compared to 2014 and a special dividend of 25 Rappen per share.
SLIDE 3 – The world's leading wealth
management franchise
UBS
is the world's largest wealth manager and the only large-scale player with a
truly global wealth management franchise at the center of its strategy.
Our
wealth management businesses' number one focus is to stay close to its clients
and guide them in achieving their wealth objectives, and we lead the industry
in doing this. In better markets the businesses puts clients' money to work,
and that happened in the first half of the year. In more challenging markets,
they advise clients to ensure they remain positioned to achieve their long term
objectives, including reducing risk when appropriate.
In
the past three years, we have grown invested assets in our wealth management
businesses at 8% per year on average, due both to strong markets and
significant net new money, taking our invested asset base to around 2 trillion
francs.
Most
importantly, profits have grown at nearly twice the rate of revenue, which is a
testament to the success of our strategic initiatives to grow higher margin
products and services like our banking, lending and mandate offerings, as well
as careful management of pricing and good cost control.
While
markets have not been kind so far this year, as the world's leading wealth
manager, we will not be distracted from our objective to deliver 10-15% annual
adjusted pre-tax profit growth in these businesses over the cycle.
SLIDE 4 - 2015 – Strong progress in all our
businesses
All
of our business divisions delivered strong results in 2015.
Wealth
Management delivered its highest adjusted pre-tax profit since 2008, and also
made good progress on one of its most critical strategic objectives, growing
mandate penetration by 200 basis points. Net new money was solid in aggregate,
despite the effects of our balance sheet optimization exercise and elevated
client deleveraging. We remain focused on attracting high quality assets, which
will drive long term growth rather than short term headlines. That means we are
seeking assets that will be invested over time and accretive to our results.
Wealth
Management Americas delivered record operating income and record net interest
income, as we saw continued growth in our banking and lending products. Net new
money was driven by advisors who have been with the firm for over a year and by
very strong recruiting in the fourth quarter.
Personal
& Corporate Banking recorded another excellent performance, posting its
best full year pre-tax profit since 2010 and attracting a record number of new
clients, while managing significant interest-rate headwinds.
Asset
Management progressed towards its medium-term goal, growing pre-tax profit by
20% compared with 2014. In the second half, net new money was affected by money
market outflows and material withdrawals by institutional clients to support
their liquidity needs. While overall net new money for the year was negative,
the inflows we saw were materially higher in margin, and thus we expect a
positive net effect on our revenues in 2016, another example where quality is
much more important to us than quantity.
Our
Investment Bank delivered an adjusted return on attributed equity of 31%,
substantially above its target of greater than 15%. The IB achieved excellent
financial returns and stayed close to its institutional and corporate clients,
helping them to manage through volatile markets.
We
saw strong growth in revenues in FRC and Equities, with continued efficient and
disciplined resource utilization, in line with client activity levels. We
advised on several of the year's landmark transactions, including the two deals
named "Equity Issues of the Year" by IFR. UBS acted as joint
bookrunner on the Santander capital increase and in North America, we were sole
global coordinator and lead left bookrunner on the 1 billion dollar listing of
Ferrari.
For the first time ever, International Financing
Review named the Investment Bank "Bank of the Year", highlighting the
recognition our innovative and sustainable operating model has attracted from
the industry. This is yet another example of the remarkable turnaround of our
investment bank. A few years ago it would have been inconceivable for UBS to
win an award like this, and it is a credit to our employees and our clients who
allowed us to deliver such an achievement.
Slide 5 - Delivering attractive returns to
our shareholders
As
I mentioned earlier, our Board intends to recommend an ordinary dividend of 60
Rappen per share and a special dividend of 25 Rappen per share, which will be
paid in May following approval at our AGM. We will pay the ordinary dividend as
a reflection of our strong operating performance, while the special dividend
reflects the substantial upward revaluation of our deferred tax assets in 2015.
Going
forward, we remain committed to our policy of returning at least 50% of net
profits to shareholders. Although it's still very early in the year, our aim is
to continue to grow our ordinary dividend, while building the capital needed to
address regulatory requirements and to support our growth.
I
would like to add a few comments about our fourth quarter results before I hand
over to Kirt.
SLIDE 6 – 4Q15 results
The
last quarter of 2015 was the most challenging we have experienced in several
years and the risk-off sentiment among our clients intensified. Having said
that, one can't overlook that on an adjusted basis, fourth quarter results were
up 47% to 754 million. No matter how you look at it, risk aversion is still
very high. Clients know they should invest more, but cash helps them sleep
better at night. And while the long-term outlook remains sound, they are
questioning the predictability of tomorrow.
Underlying
results in WMA, Personal and Corporate and Asset Management were strong, while
our largest businesses were most affected by market volatility and client risk
aversion. Despite this, we were not tempted to deploy more risk or buy
unprofitable net new money to flatter our results. Instead we stayed close to
our clients, took risk off and continue to focus on our efficiency measures.
Driving sustainable performance and growth are our main priorities, and, as in
the past, short term vagaries of the market will not distract us from our
goals.
Kirt Gardner: speaker notes for 4Q15 results, 2
February 2016
Thank
you, Sergio. Good morning everyone.
Slide 7 - UBS Group AG results (consolidated)
My
commentary will reference adjusted results unless otherwise stated.
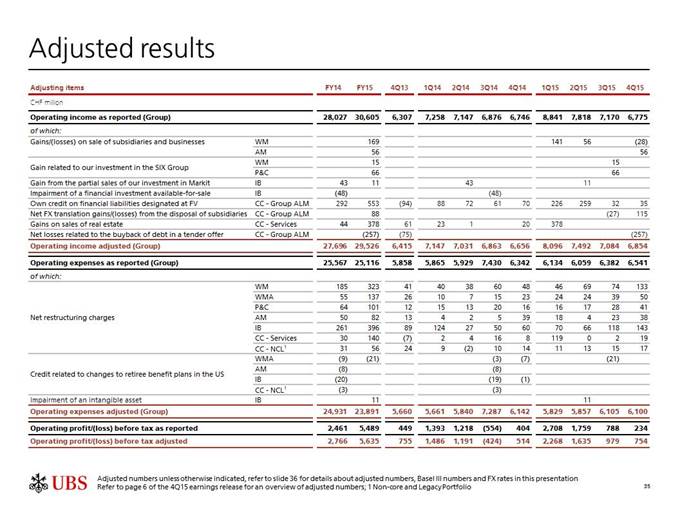
This
quarter, we excluded 28 million Swiss francs of net gains and a 115 million net
foreign currency translation gain from the sales of subsidiaries and
businesses, an own credit gain of 35 million, a charge of 257 million for a
debt buyback, and net restructuring charges of 441 million.
Reported
net profit attributable to UBS Group AG shareholders was 949 million, up 11%
year-over-year, and profit before tax was 754 million, up 47% year-over-year.
We had a reported net tax benefit of 715 million, which included a 794 million
benefit with respect to DTAs, partially offset by current tax expenses.
The
annualized return on tangible equity was 11.4% for the quarter.
Slide 8 - Wealth Management
Wealth
Management performance reflected very challenging market conditions, with the
lowest client activity levels seen since the financial crisis.
Profit
before tax was 505 million, and included 79 million in charges for provisions
for litigation, regulatory and similar matters. Excluding these charges, profit
before tax was 584 million.
Operating
income was 1.9 billion, down 2% sequentially, driven by lower recurring net fee
income, mainly due to the ongoing effects of cross-border outflows.
Net
interest income was stable, as higher revenues from deposits were more than
offset by lower lending revenues, reflecting deleveraging and disciplined
lending practices.
Transaction-based
income was 364 million and included a 45 million fee received from Personal
& Corporate Banking. Excluding this fee, transaction-based income decreased
on significantly lower client activity, primarily in Asia Pacific and emerging
markets.
Operating expenses increased to 1.4 billion, largely
due to provisions, as well as the annual UK bank levy and other regulatory
charges, which totaled 102 million.
In
addition, allocations from Corporate Center increased, due to higher charges
from Group Technology, as we continued to invest in our platform.
Slide 9 - Wealth Management
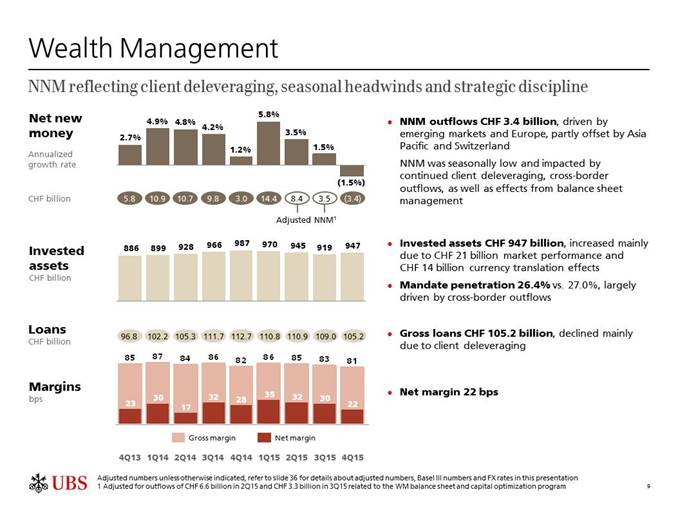
Net
new money outflows of 3.4 billion reflects both the challenging environment and
wealth management's consistent disciplined approach to managing its business.
Net outflows were driven by continued deleveraging, as clients reduced risk in
response to extreme uncertainty, as well as cross-border outflows, and
proactive and disciplined balance sheet management.
Invested
assets increased to 947 billion, on positive market performance and currency
effects.
Mandate
penetration decreased by 60 basis points to 26.4%, largely driven by
cross-border outflows.
Monthly
gross margin was 79 basis points in October, decreasing to 77 basis points in
November, and picked up slightly to 82 basis points in December.
For
the last two quarters, gross margin from transaction-based revenues has been 16
basis points, the lowest since the crisis, while margins from recurring net
fees and net interest income have held up.
Slide 10 - Wealth Management
Net
new money was positive in APAC, despite continued client deleveraging, and
together with net inflows in Switzerland was more than offset by net outflows
in emerging markets and Europe.
We
expect to meet our 3-5% net new money growth target while absorbing
cross-border related outflows and maintaining our quality standards.
Slide 11
- Wealth Management
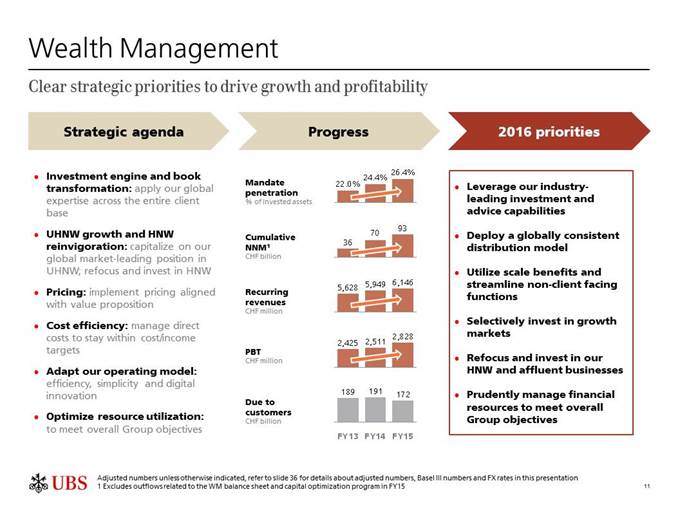
Despite
a challenging quarter, the trends over the past three years underline the
business's success in delivering its strategic agenda.
Since
the end of 2013, mandate penetration has increased by 440 basis points to
26.4%, and we continue to strive to increase this further to 40%.
The
business has attracted nearly 100 billion in adjusted net new money over the
past three years, which is more than double the prior three year period. This
strong performance was driven by our ultra high net worth segment. We'll build
on this success, and look to capture additional growth opportunities,
particularly in high net worth.
Pricing
discipline has added almost 300 million to annual revenues over the last two
years, helping offset the effects of cross-border outflows.
Growth
in top line revenues has been complemented by successful management of costs,
and we have met our cost/income ratio target for the last three years.
The
balance sheet and capital optimization program resulted in a 9 billion
reduction in LRD.
Looking
ahead, we see additional opportunity to improve both our client offering and
our efficiency. We intend to further optimize the delivery of content, by
deploying a globally consistent distribution model to capture synergies, as we
believe this provides the most value for our clients and shareholders. We will
also focus on capitalizing on our scale benefits, by streamlining non-client
facing functions.
We
are investing in select growth markets and remain committed to a balanced
onshore and offshore model.
And,
we will continue to optimize our financial resource usage and focus on net new
money quality to drive growth.
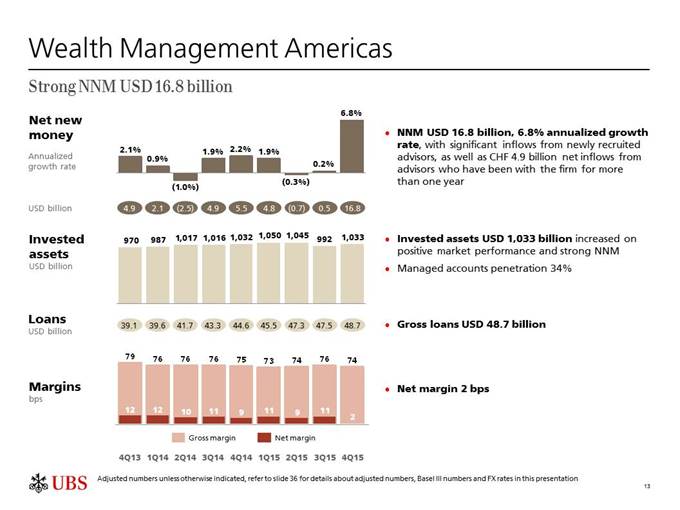
Slide 12 - Wealth Management Americas
UBS
is the only wealth management franchise that is truly global, which benefits
both clients and shareholders. These benefits were evident in the fourth
quarter, as US markets were less challenged than the rest of the world, and WMA
delivered excellent underlying results, with record net interest income and
16.8 billion dollars of net new money.
Profit
before tax was 63 million, and included 233 million of litigation provisions.
Excluding these charges, PBT was nearly 300 million.
Operating
income decreased by 3% as recurring net fee income was impacted by lower
invested assets at the end of the prior quarter, and as transaction-based
income decreased on lower client activity. This more than offset higher net
interest income, which increased by 5% to a record 326 million, as lending and
deposit volumes continued to grow.
Excluding
provisions, operating expenses decreased on lower personnel costs and charges
from other business divisions and Corporate Center.
Slide 13 - Wealth Management Americas
Net
new money was 16.8 billion, a 6.8% annualized growth rate, mainly reflecting
significant inflows from newly recruited experienced advisors, as well as 4.9
billion from advisors who have been with the firm for more than one year.
Invested
assets increased by 4% to over a trillion dollars. Managed account assets were
up 3% to 351 billion, and were 34% of total invested assets.
Slide 14 - Wealth Management Americas
Annualized
revenue per FA remained industry-leading. We had a very successful recruiting
quarter, increasing the number of FAs by 151, with 76% of recruits ranked in
the top two quintiles.
Loan
balances continued to grow, increasing by 3%.
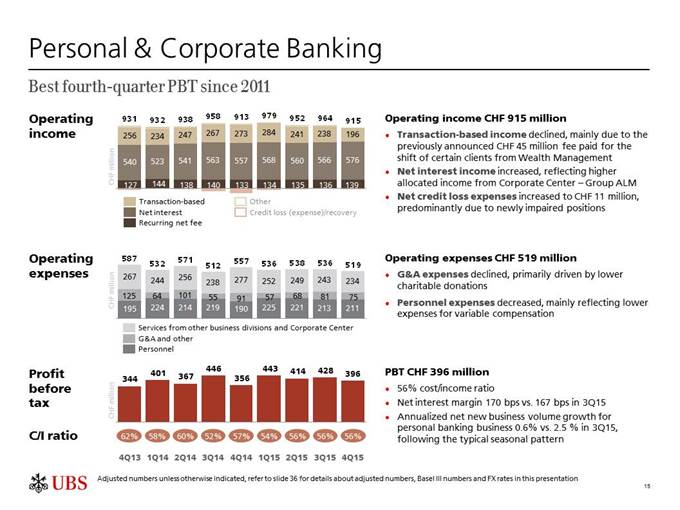
Slide 15 – Personal & Corporate Banking
Personal
and Corporate Banking delivered a profit before tax of 396 million, its
strongest fourth quarter since 2011.
Operating
income was 915 million, down 5% as higher net interest income was more than
offset by lower transaction-based income, which included the 45 million client
shift fee paid from P&C to WM.
Net
credit loss expense remained at historically low levels.
Operating
expenses decreased by 3%, and the cost/income ratio was stable at 56%,
comfortably within our target range.
Annualized
net new business volume growth for our personal banking business was seasonally
slower at 0.6%.
Slide 16 – Personal & Corporate Banking
Personal
& Corporate Banking closed another very strong year, further enhancing our
leadership position in Switzerland. We were recognized as the "Best Bank
in Switzerland" by Euromoney for the fourth consecutive year.
We
achieved the highest level of full-year profit before tax since 2010, as we
successfully offset headwinds with management actions to drive revenues, reduce
costs, and increase new business volume growth in our Personal Banking
business. Our Swiss franchise is an integral part of our business portfolio,
and it underpins the strength of our global brand.
Slide 17 - Asset Management
Asset
Management delivered a solid quarter, with profit before tax up 12%.
Operating
income was up 2%, on higher performance fees, mainly in Traditional Investments
and Global Real Estate.
Net management fees decreased by 2%, as higher fees in
Global Real Estate were more than offset by lower fees in other segments.
Net
new money outflows excluding money markets was 8.9 billion, driven by a small
number of institutional clients with liquidity needs. Excluding these outflows,
net new money was over 6 billion.
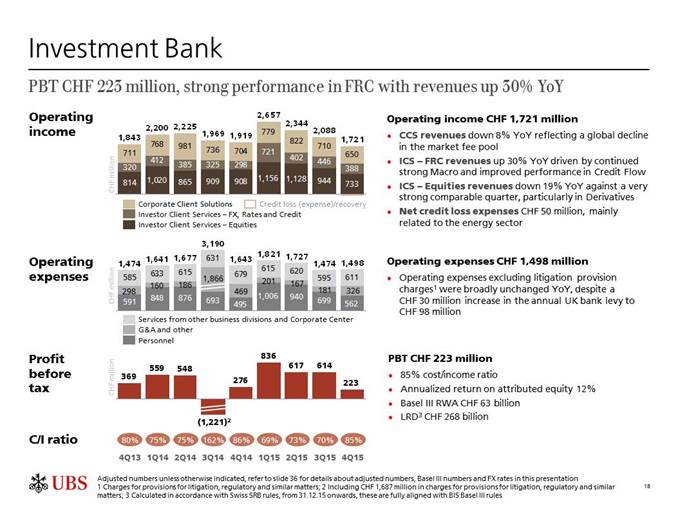
Slide 18 - Investment Bank
The
Investment Bank delivered a profit before tax of 223 million, which included a
98 million charge for the annual UK bank levy.
As
clients were less active, the business demonstrated disciplined resource
utilization, with balance sheet, RWA and average VaR decreasing
quarter-over-quarter and year-over-year.
FX,
Rates and Credit performance was strong, as revenues increased by 30%
year-over-year, on a strong result in Flow Rates and Macro options and improved
performance in Credit Flow.
In
Equities, revenues were down 19% year-over-year from a strong fourth quarter
2014. The decrease was largely driven by derivatives, as we saw lower client
activity and a challenging trading environment for structured products,
particularly in Asia Pacific and EMEA, where we have a significant presence.
This, along with lower revenues in Cash, more than offset a strong performance
from Financing Services, which delivered its best fourth quarter performance in
the last five years.
Corporate
Client Solutions delivered 650 million in revenues, down 8% year-over-year,
less than the decline in the global fee pool. Revenues in ECM were down from a
strong fourth quarter last year. In Advisory, revenues were down, but to a
lesser extent than the market fee pool, while DCM revenues were relatively
flat.
Net credit loss expense
was 50 million and mainly related to the energy sector. As of year-end, our
total net lending exposure to the oil and gas sector was 6.1 billion,
predominantly in North America. The majority of this exposure was investment
grade, and about half of this exposure was to the integrated and mid-stream
segments that we expect are less affected by the currently low energy price
levels. Exposures potentially vulnerable to low energy prices are closely
monitored and macro hedges are in place. Nevertheless, a sustained period of
depressed energy prices could result in increased credit loss expense for this
sub-segment of our portfolio.
Operating
expenses decreased 9% year-over-year to 1.5 billion, driven by lower G&A
expenses, primarily reflecting lower litigation provisions.
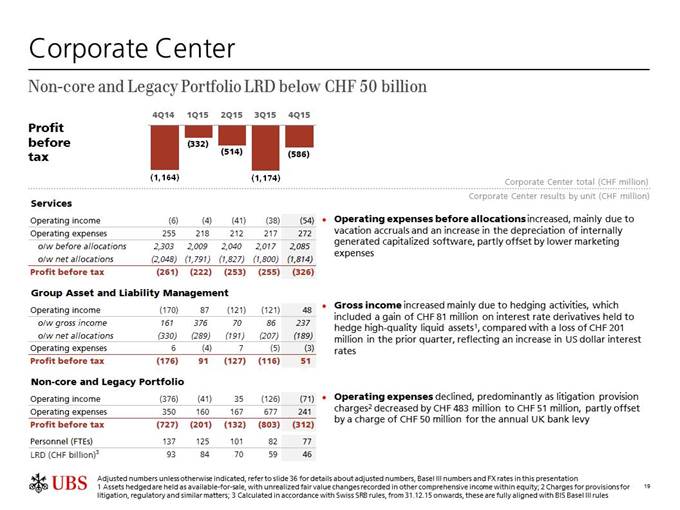
Slide 19 - Corporate Center
Profit
before tax in Corporate Center Services was negative 326 million, down 71
million, as full-year costs incurred by Corporate Center – Services exceeded
the cost allocations to the business divisions and Non-core and Legacy
Portfolio.
Expenses
before allocations increased, mainly due to vacation accruals and higher
depreciation charges.
Profit
before tax in Group ALM was 51 million, compared with negative 116 million in
the prior quarter. We saw a gain of 81 million from interest rate derivatives
used to hedge our high-quality liquid asset portfolio, compared with a loss of
201 million in the prior quarter.
Gross
funding costs increased by 91 million to 292 million, mostly due to higher fair
value gains on internal funding transactions in the prior quarter, but also
higher costs following the recent issuances of AT1 instruments and
TLAC-eligible debt.
We
expect the bond buyback from December and 2016 maturities, to generate a
benefit to funding costs of around 170 million in 2016.
Profit
before tax in Non-core and Legacy Portfolio was negative 312 million. Operating
income was negative 71 million, driven by losses from novation and unwind
activities, as well as valuation losses on financial assets designated at fair
value.
Operating expenses decreased by 436 million, as costs
decreased mainly due to lower litigation provisions, partially offset by a 50
million charge for the annual UK bank levy.
The
Non-core and Legacy Portfolio LRD was 46 billion, or 5% of the Group's total
LRD. Excluding operational risk RWA, Non-core and Legacy portfolio RWA is down
over 40% year-over-year to less than 10 billion.
Slide 20 - Corporate Center cost reductions
Delivering
on our cost reduction initiatives continues to be one of our key priorities and
is a top priority for me as Group CFO.
We
achieved an additional 100 million of annualized net cost reduction in the
Corporate Center during the quarter, bringing the total to 1.1 billion. Savings
in the quarter were largely driven by lower personnel expenses in Group
Operations.
Full-year
restructuring charges were 1.2 billion. We still expect to incur the full three
billion we've guided for between 2015 and 2017.
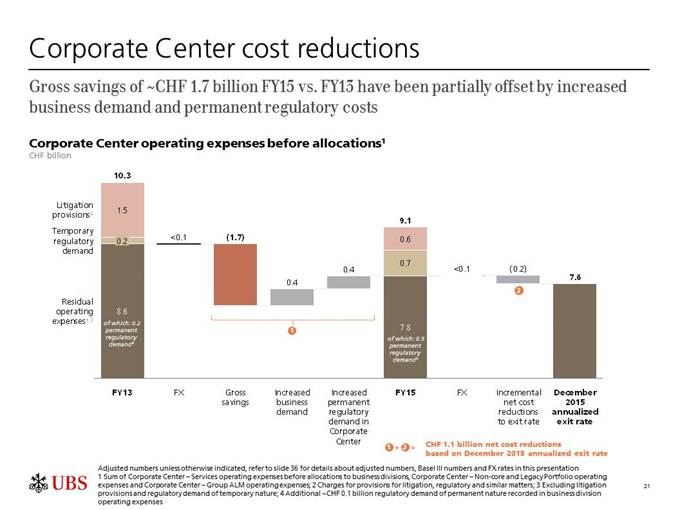
Slide 21 – Corporate Center cost reductions
We've
encountered higher permanent regulatory costs and business demand, than was
originally anticipated.
Over
the past two years, we've generated 1.7 billion of gross saves, which have been
partially offset by a 400 million increase related to higher permanent
regulatory costs and a 400 million increase related to higher business demand.
Despite these headwinds, we are fully committed to our net cost reduction
targets. We currently expect to achieve 1.4 billion of net savings by around
the middle of this year, and we continue to target 2.1 billion by year-end
2017.
Slide 22 – Corporate Center Services cost
reductions
To
deliver on our cost targets, we continue to focus our efforts on the strategic
levers described in previous quarters. The majority of savings can be
categorized into one of three areas: workforce and footprint, organization and
process optimization, and technology.
Today, 27% of employees and contractors are in
offshore or near shore locations, compared with 18% only two years ago. In
addition to lower future personnel expenses, this is allowing us to realize
efficiencies in high-cost real estate.
Through
organization and process optimization, we look to increase effectiveness and
efficiency by leveraging common capabilities and creating centralized
functions. To give one example, we've created a Reporting and Analytics
Services unit, adopting common reporting processes and leading edge technology
to provide a better quality and lower-cost service to the business.
Within
Group Technology, we continue to modernize our infrastructure and simplify our
portfolio of applications.
For
example, we are migrating databases and servers to shared internal cloud
services, which are less costly to run, and more responsive to our business
needs.
We
are also rolling out our virtual desktop platform, which helps our employees to
become more efficient, while also reducing costs. In time, the platform will
also lead to reduced real estate costs as more of our employees can work
flexibly, both in the office and from home.
We
invested around 300 million in 2015 in our application portfolio to significantly
reduce the number of applications, simplify and modernize our technology, and
reduce operational risk.
The
savings associated with our technology initiatives require more lead time, but
by the completion of our program, we expect technology to contribute to a
sizeable portion of our cost savings.
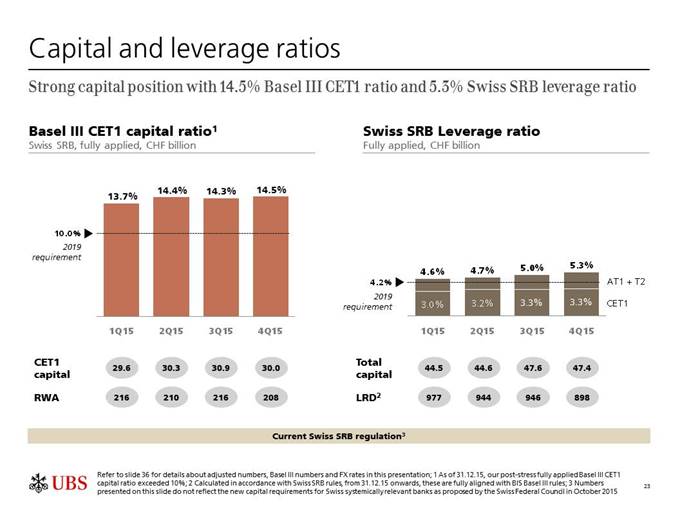
Slide 23 - Capital and leverage ratios
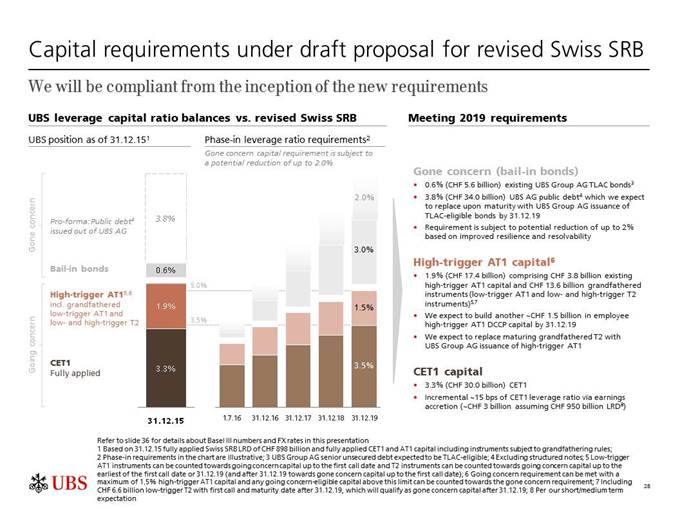
Our
capital position improved from already strong levels, with our fully applied
Basel III CET1 capital ratio increasing to 14.5% and a fully applied Swiss SRB
leverage ratio at 5.3%.
Our
CET1 capital ratio increased by 20 basis points as we reduced RWA by 9 billion,
mainly reflecting book size reductions, partially offset by currency effects
and methodology changes. This more than offset the impact of lower CET1
capital, which decreased as we accrued for dividends to shareholders and due to
tax effects.
We issued 1.4 billion of TLAC eligible debt in the
fourth quarter, which will contribute to the proposed gone-concern capital
ratios. AT1 capital increased by 0.6 billion, mainly due to deferred contingent
capital awards, to be granted to employees for the 2015 performance year.
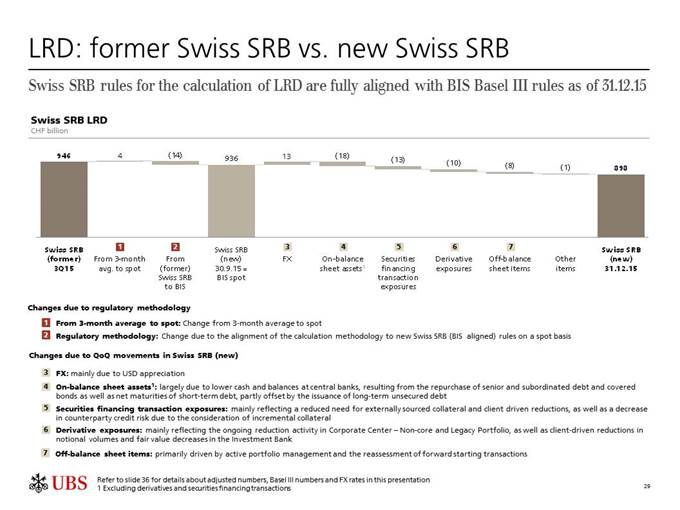
Our
fully applied BIS Basel III leverage ratio denominator was 898 billion, and
we've provided further details on LRD movements in the appendix of this
presentation.
From
December 2015, the Swiss SRB LRD calculation is fully aligned to the BIS Basel
III rules.
It
is worthwhile highlighting that, given our balance sheet composition, our LRD
is sensitive to foreign exchange as well as other market moves. For example,
currently, a 1% appreciation of the US Dollar against the Swiss Franc would
cause approximately a 4 billion increase in our LRD.
Thank
you, and with that, I will now hand it back over to Sergio.
Sergio P.
Ermotti (Group CEO): Closing remarks
CLOSING (SLIDE 24)
Thank
you, Kirt. Before we open up for questions, I would like to close with a few
remarks.
While
dovish tones from the FED and ECB have helped stabilize markets in the last few
days, uncertainties around energy prices and the outlook for China are still
driving a very cautious sentiment.
We
have begun a year that clearly looks very challenging, and our outlook remains
in line with our previous guidance. So what does that mean for us? By focusing
on our strengths, including capital and the clarity of our strategy, we believe
we have the ability to gain share of wallet and market share. We need to
maintain our global perspective on the trends driving long term wealth
accumulation. That is the reason we are keen to invest in those businesses and
geographies that will sustain growth over the long-term. Opportunities exist,
particularly in the US and Asia.
We
must also keep our focus on execution, including our cost reduction program.
Our goal is to deliver sustainable costs savings that improve our long-term
effectiveness. As we do that, we will free up resources which enables us to
selectively invest for growth.
Most
importantly, in the current environment, staying close to our clients and
delivering on our commitments remains paramount.
These
factors will underpin our ability to deliver value to shareholders and I have
every confidence in the future success of UBS.
Thank
you. And now Kirt and I will take your questions.
This Form 6-K is hereby incorporated by reference into each of
(1) the registration statement of UBS AG on Form F-3 (Registration
Number 333-204908) and (2) the registration statements of UBS Group AG on Form S-8
(Registration Numbers 333-200634; 333-200635; 333-200641; and 333-200665), and
into each prospectus outstanding under any of the foregoing registration
statements; and also into (3) any outstanding offering circular or similar
document issued or authorized by UBS AG that incorporates by reference any
Form 6-K’s of UBS AG that are incorporated into its registration
statements filed with the SEC, and (4) the base prospectus of Corporate
Asset Backed Corporation (“CABCO”) dated June 23, 2004 (Registration
Number 333-111572), the Form 8-K of CABCO filed and dated
June 23, 2004 (SEC File Number 001-13444), and the Prospectus
Supplements relating to the CABCO Series 2004-101 Trust dated May 10,
2004 and May 17, 2004 (Registration Number 033-91744 and
033-91744-05).
SIGNATURES
Pursuant to the requirements of the Securities
Exchange Act of 1934, the registrant has duly caused this report to be signed
on its behalf by the undersigned, thereunto duly authorized.
UBS Group AG
By: _/s/ David Kelly______________
Name: David Kelly
Title: Managing Director
By: _/s/ Sarah M. Starkweather______
Name: Sarah M. Starkweather
Title: Executive Director
UBS AG
By: _/s/ David Kelly______________
Name: David Kelly
Title: Managing Director
By: _/s/ Sarah M. Starkweather______
Name: Sarah M. Starkweather
Title: Executive Director
Date: February 2,
2016
UBS (NYSE:UBS)
Historical Stock Chart
From Mar 2024 to Apr 2024

UBS (NYSE:UBS)
Historical Stock Chart
From Apr 2023 to Apr 2024
