SECURITIES AND EXCHANGE COMMISSION
Washington, D.C. 20549
FORM 6-K
Report of Foreign Issuer
Pursuant to Rule 13a-16 or 15d-16
of the Securities Exchange Act of 1934
For the Month of November 2015
Commission File Number: 001-32294

TATA MOTORS LIMITED
(Translation of registrant’s name into English)
BOMBAY HOUSE
24, HOMI MODY STREET,
MUMBAI 400 001, MAHARASHTRA, INDIA
Telephone # 91 22 6665 8282 Fax # 91 22 6665 7799
(Address of principal executive office)
Indicate by check mark whether
the registrant files or will file annual reports under cover Form 20-F or Form 40-F.
Form 20-F x Form 40-F ¨
Indicate by check mark if the registrant is submitting the Form 6-K in paper as permitted by Regulation S-T Rule 101(b)(1):
Yes ¨ No
x
Indicate by check mark if the registrant is submitting the Form 6-K in paper as permitted by
Regulation S-T Rule 101(b)(7):
Yes ¨ No
x
Indicate by check mark whether by furnishing the information contained in this Form, the
Registrant is also thereby furnishing theinformation to the Commission pursuant to Rule 12g3-2(b) under the Securities Exchange Act of 1934:
Yes ¨ No
x
If “Yes” is marked, indicate below the file number assigned to the registrant in
connection with Rule 12g 3-2(b): Not Applicable
TABLE OF CONTENTS
SIGNATURE
Pursuant to the requirements of the Securities Exchange Act of 1934, the registrant has duly caused this report to be signed on its behalf by the undersigned,
thereunto duly authorised.
|
|
|
| Tata Motors Limited |
|
|
| By: |
|
/s/ Hoshang K Sethna |
| Name: |
|
Hoshang K Sethna |
| Title: |
|
Company Secretary |
Dated: November 9, 2015
JAGUAR LAND ROVER
Jaguar Land Rover Automotive PLC
Interim Report
For the three and six month period ended
30 September 2015
Company registered number: 06477691
Contents
This report uses:
Group,
Company, Jaguar Land Rover and JLR to refer to Jaguar Land Rover Automotive plc and its subsidiaries.
|
|
|
| EBITDA |
|
measured as earnings before tax and adding back depreciation, amortisation, finance income, finance expense, foreign exchange gains/(losses) on financing and unrealised derivatives, commodity gains/(losses) on unrealised
derivatives, exceptional items and share of gains/(losses) from joint ventures. |
|
|
| EBITDA margin |
|
measured as EBITDA as a percentage of revenue. |
|
|
| PBT |
|
profit before tax. |
|
|
| PAT |
|
profit after tax. |
|
|
| Net cash |
|
measured as cash and cash equivalents and short term deposits less total borrowings (including secured and unsecured borrowings and factoring facilities, but excluding finance leases). |
|
|
| Free cash flow |
|
measured as the net change in cash and cash equivalents, less net cash in financing activities, less movement in short term deposits. |
|
|
| Product and other investment |
|
measured as cash outflows relating to tangible assets, intangible assets, expensed R&D and investment in joint ventures. |
|
|
| FY16 |
|
Year ending 31 March 2016. |
|
|
| FY15 |
|
Year ended 31 March 2015. |
|
|
| Q2 |
|
3 months ended 30 September. |
|
|
| China JV |
|
Chery Jaguar Land Rover Joint Venture. |
Management’s discussion and analysis of financial condition and results of
operations
Retail sales in Q2 FY16 were broadly in line with the prior year’s record second quarter. Strong demand in the UK (up 9%
year-on-year), mainland Europe (up 34%) and North America (up 23%) – particularly for the new Land Rover Discovery Sport and Jaguar XE – helped offset weaker sales in China and emerging markets. However profitability was down primarily as
a result of weaker China sales and mix and foreign exchange revaluation as well as an exceptional charge for the inventory impacted by the Tianjin Port explosion.
Key metrics for Q2 FY16, compared to Q2 FY15, are as follows:
| • |
|
Retail volumes (including China JV) were 110,200 units, down 0.5%. |
| • |
|
Wholesale volumes (excluding China JV) were 111,160 units, up 6.9%. |
| • |
|
Revenues of £4,831 million, up £23 million. |
| • |
|
EBITDA of £589 million, down £344 million. EBITDA margin of 12.2%, down 7.2 ppt. |
| • |
|
PBT of £88 million before exceptional item, down £521 million. |
| • |
|
Exceptional charge of £245 million for the inventory impacted by the Tianjin Port explosion. |
| • |
|
After the exceptional item of £245 million, loss after tax was £92 million. |
| • |
|
Negative free cash flow: £225 million before financing costs and after Investment spending of £775 million. |
| • |
|
Cash and financial deposits: £2,960 million and an undrawn long-term 5 year credit facility of £1,870 million. |
Market environment
Macroeconomic
conditions remained mixed during the quarter. The economies of the UK and US continue to exhibit solid growth with low inflation whilst the European economy is picking up. The economic environment in China continues to be softer as GDP slipped below
the government’s growth target and market conditions in developing economies, notably Russia and Brazil, remain weak.
The US Dollar strengthened
against the Pound, despite the US Federal Reserve holding off on increasing interest rates, and the Chinese RMB strengthened against the Pound, to a lesser extent, following policy action which saw the RMB depreciate against the US Dollar. The Euro
also strengthened against the Pound over the quarter reflecting the gradual economic recovery in the Eurozone and emerging market currencies, such as the Russian Rouble and Brazilian Real weakened. Commodity prices also softened during Q2 FY16
primarily reflecting weaker industrial demand from China.
Total automotive industry car volumes (units)
|
|
|
|
|
|
|
|
|
|
|
|
|
| |
|
Q2 FY16 |
|
|
Q2 FY15 |
|
|
Change (%) |
|
| China |
|
|
4,438,300 |
|
|
|
4,522,100 |
|
|
|
(1.9 |
)% |
| Europe (excluding UK) |
|
|
1,742,376 |
|
|
|
1,587,015 |
|
|
|
9.8 |
% |
| UK |
|
|
719,997 |
|
|
|
670,931 |
|
|
|
7.3 |
% |
| US |
|
|
4,509,500 |
|
|
|
4,245,300 |
|
|
|
6.2 |
% |
| All other markets |
|
|
3,422,914 |
|
|
|
3,705,572 |
|
|
|
(7.6 |
)% |
The total industry car volume data above has been compiled using relevant data available at the time of publishing this
interim report, compiled from national automotive associations such as the Society of Motor Manufacturers and Traders in the UK and the ACEA in Europe, according to their segment definitions, which may differ from those used by JLR.
2
Jaguar Land Rover retail volume performance
Total retail volumes were 110,200 units for the quarter, a decrease of 0.5% compared to Q2 FY15. Higher retail sales in the UK, North America and Europe were
offset by lower sales in China and Other Overseas markets (which includes Russia and Brazil). The lower sales in China reflect continued softening demand and the timing of new model launches, such as the Jaguar XE which only went on sale in
September 2015, and the new XJ and XF models available in early 2016, as well as the transition to localised production first with the Evoque, followed by the Discovery Sport from November 2015.
By brand, Land Rover retailed 87,554 units in Q2 FY16, down 3.9% compared to the same quarter last year, whilst Jaguar retailed 22,646 units, up 15.3%. Retail
sales of the Discovery Sport continue to grow with Q2 FY16 volumes up 26.6% compared to sales of the Freelander (which it replaced) in the same period last year. Discovery, Range Rover Sport and Range Rover retail sales remained robust, albeit down
slightly when compared to strong sales in the same quarter of last year. Evoque retail sales were down in the quarter, reflecting the transition to localised production in China and the start of production of the refreshed 16 Model Year Evoque
(starting from August 2015).
Jaguar retail volumes grew significantly, up 15.3%, due to strong XE sales, offset partially by lower sales of the XF and
XJ, ahead of the all new Jaguar XF (from August 2015) and a refreshed 16 Model Year Jaguar XJ (coming soon).
Wholesale volumes totalled 111,160 units
(excluding China JV) in Q2 FY16, up 6.9% compared to Q2 FY15. This comprised 89,473 units for Land Rover (down 3.8%) and 21,687 units for Jaguar (up 22.0% reflecting the ramp up of the Jaguar XE).
Jaguar Land Rover retail volume performance in key regions and by model for Q2 FY16 compared to Q2 FY15 is detailed in the following tables (figures in
units, and include China JV volumes).
|
|
|
|
|
|
|
|
|
|
|
|
|
| |
|
Q2 FY16 |
|
|
Q2 FY15 |
|
|
Change (%) |
|
| China |
|
|
20,149 |
|
|
|
29,786 |
|
|
|
(32.4 |
)% |
| Europe (excluding UK) |
|
|
23,113 |
|
|
|
17,227 |
|
|
|
34.2 |
% |
| UK |
|
|
24,180 |
|
|
|
22,151 |
|
|
|
9.2 |
% |
| North America |
|
|
21,743 |
|
|
|
17,616 |
|
|
|
23.4 |
% |
| All Other Markets |
|
|
21,015 |
|
|
|
24,001 |
|
|
|
(12.4 |
)% |
|
|
|
|
|
|
|
|
|
|
|
|
|
| Total JLR |
|
|
110,200 |
|
|
|
110,781 |
|
|
|
(0.5 |
)% |
|
|
|
|
|
|
|
|
|
|
|
|
|
|
|
|
|
| XE |
|
|
9,310 |
|
|
|
— |
|
|
|
n/a |
|
| XF |
|
|
7,598 |
|
|
|
11,217 |
|
|
|
(32.3 |
)% |
| XJ |
|
|
2,715 |
|
|
|
4,365 |
|
|
|
(37.8 |
)% |
| XK |
|
|
77 |
|
|
|
871 |
|
|
|
(91.2 |
)% |
| F-TYPE |
|
|
2,946 |
|
|
|
3,194 |
|
|
|
(7.8 |
)% |
|
|
|
|
|
|
|
|
|
|
|
|
|
| Jaguar |
|
|
22,646 |
|
|
|
19,647 |
|
|
|
15.3 |
% |
|
|
|
|
|
|
|
|
|
|
|
|
|
| Defender |
|
|
5,619 |
|
|
|
4,038 |
|
|
|
39.2 |
% |
| Freelander |
|
|
41 |
|
|
|
14,235 |
|
|
|
(99.7 |
)% |
| Discovery Sport |
|
|
18,021 |
|
|
|
— |
|
|
|
n/a |
|
| Discovery |
|
|
10,344 |
|
|
|
10,717 |
|
|
|
(3.5 |
)% |
| Range Rover Evoque |
|
|
21,744 |
|
|
|
29,224 |
|
|
|
(25.6 |
)% |
| Range Rover Sport |
|
|
19,234 |
|
|
|
19,447 |
|
|
|
(1.1 |
)% |
| Range Rover |
|
|
12,551 |
|
|
|
13,473 |
|
|
|
(6.8 |
)% |
|
|
|
|
|
|
|
|
|
|
|
|
|
| Land Rover |
|
|
87,554 |
|
|
|
91,134 |
|
|
|
(3.9 |
)% |
|
|
|
|
|
|
|
|
|
|
|
|
|
| Total JLR |
|
|
110,200 |
|
|
|
110,781 |
|
|
|
(0.5 |
)% |
|
|
|
|
|
|
|
|
|
|
|
|
|
3
Revenue and profits
The Company generated revenue of £4,831 million in the three months to 30 September 2015, up £23 million, compared to revenue of
£4,808 million earned in the same three month period last year. Revenue for the 6 months to 30 September 2015 was £9,833 million, down £328 million compared to the same period a year ago.
EBITDA decreased by £344 million to £589 million in Q2 FY16 compared to £933 million in Q2 FY15 due to lower China sales and
mix, unfavourable revaluation of current assets and liabilities (primarily EUR payables) compared to a gain a year ago, and launch and other costs. EBITDA for the 6 months to 30 September 2015 was £1,410 million, down
£610 million compared to the same 6 month period last year.
PBT for Q2 FY16 before exceptional items was £88 million, down
£521 million from £609 million in Q2 FY15. The decrease in PBT was primarily driven by the lower EBITDA as well as higher depreciation and amortisation (£121 million higher), unfavourable revaluation of foreign currency
debt and unrealised hedges as well as higher net finance expense. An exceptional charge of £245 million has been recognised for about 5,800 vehicles involved in the August Tianjin Port explosion. After this exceptional charge, losses
before tax were £157 million. An insurance adjusting process is underway and insurance and any other recoveries will only be realised future periods.
PBT before exceptional items for the 6 months to 30 September 2015 was £726 million, down £807 million compared to the 6 months to
30 September 2014. PBT after the exceptional charge for the first half of the year was £481 million, down £1,052 million compared to the first half of the prior year.
Losses after tax for Q2 FY16 were £92 million, down £542 million compared to Q2 FY15. PAT for the 6 months to 30 September 2015 was
£400 million, down £743 million compared to the same 6 month period a year ago.
EBITDA reconciliation
|
|
|
|
|
|
|
|
|
| Three months ended 30 September (£ millions) |
|
2015 |
|
|
2014 |
|
| EBITDA margin |
|
|
12.2 |
% |
|
|
19.4 |
% |
| EBITDA |
|
|
589 |
|
|
|
933 |
|
| Adjustments: |
|
|
|
|
|
|
|
|
| Depreciation and amortisation |
|
|
(365 |
) |
|
|
(244 |
) |
| Foreign exchange losses – financing |
|
|
(59 |
) |
|
|
(53 |
) |
| Foreign exchange losses – unrealised derivatives |
|
|
(20 |
) |
|
|
(24 |
) |
| Commodity losses - unrealised derivatives |
|
|
(35 |
) |
|
|
(8 |
) |
| Finance income |
|
|
8 |
|
|
|
12 |
|
| Finance expense (net) |
|
|
(29 |
) |
|
|
(1 |
) |
| Share of loss from joint ventures |
|
|
(1 |
) |
|
|
(4 |
) |
| Other |
|
|
— |
|
|
|
(2 |
) |
|
|
|
|
|
|
|
|
|
| Profit before tax (excluding exceptional charge) |
|
|
88 |
|
|
|
609 |
|
|
|
|
|
|
|
|
|
|
| Exceptional charge |
|
|
(245 |
) |
|
|
— |
|
|
|
|
|
|
|
|
|
|
| (Loss)/profit before tax |
|
|
(157 |
) |
|
|
609 |
|
|
|
|
|
|
|
|
|
|
| Income tax credit/(expense) |
|
|
65 |
|
|
|
(159 |
) |
|
|
|
|
|
|
|
|
|
| (Loss)/profit after tax |
|
|
(92 |
) |
|
|
450 |
|
|
|
|
|
|
|
|
|
|
Cash flow, liquidity and capital resources
Free cash flow before financing for Q2 FY16 was negative £225 million, primarily reflecting capitalised investment spending of
£700 million exceeding EBITDA of £589m and higher working capital. Total investment spending was £775 million including £75 million expensed in EBITDA.
After the negative free cash flow of £225 million and finance expense of £50 million, cash and financial deposits stood at
£2,960 million as at 30 September 2015 (split £2,104 million of cash and cash equivalents and £856 million of bank deposits with maturities greater than 3 months). This includes an amount of
£531 million held in subsidiaries of Jaguar Land Rover outside of the United Kingdom. The cash in some of these jurisdictions is subject to impediments to remitting cash to the UK other than through annual dividends.
As at 30 September 2015, the Company also has undrawn committed credit facilities totalling £1,870 million all maturing in July 2020. Jaguar
Land Rover also had £95 million of undrawn shorter-term committed credit facilities.
4
Material events
On 12 August 2015 a series of explosions caused widespread damage at the Port of Tianjin in China. Tianjin Port is one of three major locations in China
through which Jaguar Land Rover imports vehicles and at the time of the explosion, approximately 5,800 vehicles were stored at various locations in Tianjin. Many of these vehicles were destroyed or damaged in the explosion and as a result an
exceptional charge of £245 million has been recognised in the financial statements of the Company for Q2 FY16. The process for finalising an insurance claim may take some months to conclude, so insurance and other potential recoveries
will only be recognised in future periods when paid or confirmed and have not been recognised in this period.
Borrowings
The following table shows details of the Company’s financing arrangements as at 30 September 2015.
|
|
|
|
|
|
|
|
|
|
|
|
|
|
|
|
|
| (£ millions) |
|
Facility
amount |
|
|
Outstanding |
|
|
Undrawn |
|
|
First call
date |
|
| Committed |
|
|
|
|
|
|
|
|
|
|
|
|
|
|
|
|
| £500m 8.250% Senior Notes due 2020* |
|
|
58 |
|
|
|
58 |
|
|
|
— |
|
|
|
Mar-2016 |
|
| £400m 5.000% Senior Notes due 2022** |
|
|
400 |
|
|
|
400 |
|
|
|
— |
|
|
|
n/a |
|
| £400m 3.875% Senior Notes due 2023** |
|
|
400 |
|
|
|
400 |
|
|
|
|
|
|
|
n/a |
|
| $410m 8.125% Senior Notes due 2021* |
|
|
55 |
|
|
|
55 |
|
|
|
— |
|
|
|
May-2016 |
|
| $500m 5.625% Senior Notes due 2023* |
|
|
330 |
|
|
|
330 |
|
|
|
— |
|
|
|
Feb-2018 |
|
| $700m 4.125% Senior Notes due 2018** |
|
|
462 |
|
|
|
462 |
|
|
|
— |
|
|
|
n/a |
|
| $500m 4.250% Senior Notes due 2019** |
|
|
330 |
|
|
|
330 |
|
|
|
— |
|
|
|
n/a |
|
| $500m 3.500% Senior Notes due 2020** |
|
|
330 |
|
|
|
330 |
|
|
|
— |
|
|
|
n/a |
|
| Revolving 5 year credit facility |
|
|
1,870 |
|
|
|
— |
|
|
|
1,870 |
|
|
|
n/a |
|
| Receivable factoring facilities*** |
|
|
231 |
|
|
|
136 |
|
|
|
95 |
|
|
|
n/a |
|
|
|
|
|
|
|
|
|
|
|
|
|
|
|
|
|
|
| Subtotal |
|
|
4,466 |
|
|
|
2,501 |
|
|
|
1,965 |
|
|
|
|
|
|
|
|
|
|
|
|
|
|
|
|
|
|
|
|
|
|
| Prepaid costs |
|
|
— |
|
|
|
(22 |
) |
|
|
— |
|
|
|
|
|
|
|
|
|
|
|
|
|
|
|
|
|
|
|
|
|
|
| Total |
|
|
4,466 |
|
|
|
2,479 |
|
|
|
1,965 |
|
|
|
|
|
|
|
|
|
|
|
|
|
|
|
|
|
|
|
|
|
|
| * |
The Notes are guaranteed on a senior unsecured basis by the guarantors Jaguar Land Rover Limited, Jaguar Land Rover Holdings Limited, Land Rover Exports Limited, JLR Nominee Company Limited and Jaguar Land Rover North
America LLC. |
| ** |
The Notes are guaranteed on a senior unsecured basis by the guarantors Jaguar Land Rover Limited and Jaguar Land Rover Holdings Limited. |
| *** |
The $350 million committed facility is drawn by Jaguar Land Rover Limited and guaranteed by Jaguar Land Rover Holdings Limited. |
A bilateral $200 million uncommitted receivables factoring facility is also available which remained undrawn as at 30 September 2015.
Acquisitions and disposals
There
were no material acquisitions or disposals in the period.
Off-balance sheet financial arrangements
The Company has no off-balance sheet financial arrangements other than commitments disclosed in the condensed consolidated financial statements.
Business risks and mitigating factors
As discussed on pages 76-81, and elsewhere, of the Annual Report 2014-15 of the Company, Jaguar Land Rover is exposed to various business risks including but
not limited to the uncertainty of global economic conditions, fluctuations of currency exchange rates and raw material prices.
Employees
At the end of Q2
FY16, Jaguar Land Rover employed 36,960 people worldwide including agency personnel. This compared to 31,826 at the end of Q2 FY15.
5
Board of Directors
The following table provides information with respect to members of the Board of Directors of Jaguar Land Rover:
|
|
|
|
|
| Name |
|
Position |
|
Year appointed as Director,
Chief Executive Officer |
| Cyrus P Mistry |
|
Chairman and Director |
|
2012 |
| Andrew M. Robb |
|
Director |
|
2009 |
| Dr. Ralf D. Speth |
|
Chief Executive Officer and Director |
|
2010 |
| Nasser Mukhtar Munjee |
|
Director |
|
2012 |
| Chandrasekaran Ramakrishnan |
|
Director |
|
2013 |
6
Condensed Consolidated Income Statement
For the three and six months ended 30 September 2015 (unaudited)
|
|
|
|
|
|
|
|
|
|
|
|
|
|
|
|
|
|
|
| |
|
|
|
Three months ended |
|
|
Six months ended |
|
| |
|
|
|
30 September |
|
|
30 September |
|
|
30 September |
|
|
30 September |
|
| |
|
|
|
2015 |
|
|
2014 |
|
|
2015 |
|
|
2014 |
|
| (£ millions) |
|
Note |
|
(unaudited) |
|
|
(unaudited) |
|
|
(unaudited) |
|
|
(unaudited) |
|
| Revenue |
|
|
|
|
4,831 |
|
|
|
4,808 |
|
|
|
9,833 |
|
|
|
10,161 |
|
| Material cost of sales excluding exceptional item |
|
|
|
|
(2,916 |
) |
|
|
(2,904 |
) |
|
|
(5,822 |
) |
|
|
(6,203 |
) |
| Exceptional item |
|
2 |
|
|
(245 |
) |
|
|
— |
|
|
|
(245 |
) |
|
|
— |
|
| Material and other cost of sales |
|
|
|
|
(3,161 |
) |
|
|
(2,904 |
) |
|
|
(6,067 |
) |
|
|
(6,203 |
) |
| Employee cost |
|
|
|
|
(539 |
) |
|
|
(463 |
) |
|
|
(1,091 |
) |
|
|
(892 |
) |
| Other expenses |
|
|
|
|
(1,052 |
) |
|
|
(939 |
) |
|
|
(2,088 |
) |
|
|
(1,866 |
) |
| Net impact of commodity derivatives |
|
|
|
|
(46 |
) |
|
|
(7 |
) |
|
|
(73 |
) |
|
|
8 |
|
| Development costs capitalised |
|
3 |
|
|
306 |
|
|
|
274 |
|
|
|
621 |
|
|
|
547 |
|
| Other income |
|
|
|
|
33 |
|
|
|
32 |
|
|
|
129 |
|
|
|
56 |
|
| Depreciation and amortisation |
|
|
|
|
(365 |
) |
|
|
(244 |
) |
|
|
(683 |
) |
|
|
(478 |
) |
| Foreign exchange (loss)/gain |
|
|
|
|
(142 |
) |
|
|
45 |
|
|
|
(64 |
) |
|
|
192 |
|
| Finance income |
|
4 |
|
|
8 |
|
|
|
12 |
|
|
|
18 |
|
|
|
23 |
|
| Finance expense (net) |
|
4 |
|
|
(29 |
) |
|
|
(1 |
) |
|
|
(47 |
) |
|
|
(5 |
) |
| Share of loss from equity accounted investees |
|
|
|
|
(1 |
) |
|
|
(4 |
) |
|
|
(7 |
) |
|
|
(10 |
) |
|
|
|
|
|
|
|
|
|
|
|
|
|
|
|
|
|
|
|
| (Loss)/profit before tax |
|
|
|
|
(157 |
) |
|
|
609 |
|
|
|
481 |
|
|
|
1,533 |
|
| Income tax credit/ (expense) excluding tax on exceptional item |
|
|
|
|
4 |
|
|
|
(159 |
) |
|
|
(142 |
) |
|
|
(390 |
) |
| Tax on exceptional item |
|
9 |
|
|
61 |
|
|
|
— |
|
|
|
61 |
|
|
|
— |
|
| Income tax credit/(expense) |
|
9 |
|
|
65 |
|
|
|
(159 |
) |
|
|
(81 |
) |
|
|
(390 |
) |
|
|
|
|
|
|
|
|
|
|
|
|
|
|
|
|
|
|
|
| (Loss)/profit for the period |
|
|
|
|
(92 |
) |
|
|
450 |
|
|
|
400 |
|
|
|
1,143 |
|
|
|
|
|
|
|
|
|
|
|
|
|
|
|
|
|
|
|
|
Condensed Consolidated Statement of Comprehensive Income
For the three and six months ended 30 September 2015 (unaudited)
|
|
|
|
|
|
|
|
|
|
|
|
|
|
|
|
|
| |
|
Three months ended |
|
|
Six months ended |
|
| |
|
30 September |
|
|
30 September |
|
|
30 September |
|
|
30 September |
|
| |
|
2015 |
|
|
2014 |
|
|
2015 |
|
|
2014 |
|
| (£ millions) |
|
(unaudited) |
|
|
(unaudited) |
|
|
(unaudited) |
|
|
(unaudited) |
|
| (Loss)/profit for the period |
|
|
(92 |
) |
|
|
450 |
|
|
|
400 |
|
|
|
1,143 |
|
| Items that will not be reclassified subsequently to profit or loss: |
|
|
|
|
|
|
|
|
|
|
|
|
|
|
|
|
| Remeasurement of defined benefit obligation |
|
|
261 |
|
|
|
(80 |
) |
|
|
435 |
|
|
|
(194 |
) |
| Income tax related to items that will not be reclassified |
|
|
(52 |
) |
|
|
16 |
|
|
|
(87 |
) |
|
|
39 |
|
|
|
|
|
|
|
|
|
|
|
|
|
|
|
|
|
|
|
|
|
209 |
|
|
|
(64 |
) |
|
|
348 |
|
|
|
(155 |
) |
|
|
|
|
|
|
|
|
|
|
|
|
|
|
|
|
|
| Items that may be reclassified subsequently to profit or loss: |
|
|
|
|
|
|
|
|
|
|
|
|
|
|
|
|
| (Loss)/gain on effective cash flow hedges |
|
|
(136 |
) |
|
|
(475 |
) |
|
|
669 |
|
|
|
(412 |
) |
| Cash flow hedges reclassified to foreign exchange gain in profit or loss |
|
|
15 |
|
|
|
(69 |
) |
|
|
118 |
|
|
|
(158 |
) |
| Currency translation differences |
|
|
2 |
|
|
|
11 |
|
|
|
(14 |
) |
|
|
— |
|
| Income tax related to items that may be reclassified |
|
|
25 |
|
|
|
109 |
|
|
|
(157 |
) |
|
|
114 |
|
|
|
|
|
|
|
|
|
|
|
|
|
|
|
|
|
|
|
|
|
(94 |
) |
|
|
(424 |
) |
|
|
616 |
|
|
|
(456 |
) |
|
|
|
|
|
|
|
|
|
|
|
|
|
|
|
|
|
| Other comprehensive income / (expense) net of tax |
|
|
115 |
|
|
|
(488 |
) |
|
|
964 |
|
|
|
(611 |
) |
|
|
|
|
|
|
|
|
|
|
|
|
|
|
|
|
|
| Total comprehensive income / (expense) attributable to shareholders |
|
|
23 |
|
|
|
(38 |
) |
|
|
1,364 |
|
|
|
532 |
|
|
|
|
|
|
|
|
|
|
|
|
|
|
|
|
|
|
7
Condensed Consolidated Balance Sheet
|
|
|
|
|
|
|
|
|
|
|
| |
|
|
|
30 September 2015 |
|
|
31 March 2015 |
|
| As at (£ millions) |
|
Note |
|
(unaudited) |
|
|
(audited) |
|
| Non-current assets |
|
|
|
|
|
|
|
|
|
|
| Equity accounted investees |
|
|
|
|
259 |
|
|
|
280 |
|
| Other financial assets |
|
|
|
|
127 |
|
|
|
49 |
|
| Property, plant and equipment |
|
|
|
|
4,878 |
|
|
|
4,474 |
|
| Intangible assets |
|
|
|
|
5,239 |
|
|
|
4,952 |
|
| Other assets |
|
|
|
|
71 |
|
|
|
26 |
|
| Deferred tax assets |
|
|
|
|
407 |
|
|
|
372 |
|
|
|
|
|
|
|
|
|
|
|
|
| Total non-current assets |
|
|
|
|
10,981 |
|
|
|
10,153 |
|
|
|
|
|
|
|
|
|
|
|
|
| Current assets |
|
|
|
|
|
|
|
|
|
|
| Cash and cash equivalents |
|
|
|
|
2,104 |
|
|
|
3,208 |
|
| Short term deposits |
|
|
|
|
856 |
|
|
|
1,055 |
|
| Trade receivables |
|
|
|
|
974 |
|
|
|
1,112 |
|
| Other financial assets |
|
6 |
|
|
245 |
|
|
|
214 |
|
| Inventories |
|
7 |
|
|
2,799 |
|
|
|
2,416 |
|
| Other current assets |
|
8 |
|
|
393 |
|
|
|
396 |
|
| Current tax assets |
|
|
|
|
60 |
|
|
|
9 |
|
|
|
|
|
|
|
|
|
|
|
|
| Total current assets |
|
|
|
|
7,431 |
|
|
|
8,410 |
|
|
|
|
|
|
|
|
|
|
|
|
| Total assets |
|
|
|
|
18,412 |
|
|
|
18,563 |
|
|
|
|
|
|
|
|
|
|
|
|
| Current liabilities |
|
|
|
|
|
|
|
|
|
|
| Accounts payable |
|
|
|
|
4,785 |
|
|
|
5,450 |
|
| Short term borrowings |
|
14 |
|
|
136 |
|
|
|
156 |
|
| Other financial liabilities |
|
11 |
|
|
696 |
|
|
|
923 |
|
| Provisions |
|
12 |
|
|
471 |
|
|
|
485 |
|
| Other current liabilities |
|
13 |
|
|
351 |
|
|
|
374 |
|
| Current tax liabilities |
|
|
|
|
36 |
|
|
|
69 |
|
|
|
|
|
|
|
|
|
|
|
|
| Total current liabilities |
|
|
|
|
6,475 |
|
|
|
7,457 |
|
|
|
|
|
|
|
|
|
|
|
|
| Non-current liabilities |
|
|
|
|
|
|
|
|
|
|
| Long term debt |
|
14 |
|
|
2,345 |
|
|
|
2,381 |
|
| Other financial liabilities |
|
11 |
|
|
470 |
|
|
|
842 |
|
| Provisions |
|
12 |
|
|
615 |
|
|
|
639 |
|
| Retirement benefit obligation |
|
17 |
|
|
572 |
|
|
|
887 |
|
| Other non-current liabilities |
|
|
|
|
139 |
|
|
|
118 |
|
| Deferred tax liabilities |
|
|
|
|
542 |
|
|
|
199 |
|
|
|
|
|
|
|
|
|
|
|
|
| Total non-current liabilities |
|
|
|
|
4,683 |
|
|
|
5,066 |
|
|
|
|
|
|
|
|
|
|
|
|
| Total liabilities |
|
|
|
|
11,158 |
|
|
|
12,523 |
|
|
|
|
|
|
|
|
|
|
|
|
| Equity attributable to shareholders |
|
|
|
|
|
|
|
|
|
|
| Ordinary shares |
|
|
|
|
1,501 |
|
|
|
1,501 |
|
| Capital redemption reserve |
|
|
|
|
167 |
|
|
|
167 |
|
| Reserves |
|
15 |
|
|
5,586 |
|
|
|
4,372 |
|
|
|
|
|
|
|
|
|
|
|
|
| Equity attributable to shareholders |
|
|
|
|
7,254 |
|
|
|
6,040 |
|
|
|
|
|
|
|
|
|
|
|
|
| Total liabilities and equity |
|
|
|
|
18,412 |
|
|
|
18,563 |
|
|
|
|
|
|
|
|
|
|
|
|
These condensed consolidated interim financial statements were approved by the board of directors.
Company registered number: 6477691
8
Condensed Consolidated Statement of Changes in Equity
|
|
|
|
|
|
|
|
|
|
|
|
|
|
|
|
|
| (£ millions) |
|
Ordinary share
capital |
|
|
Capital redemption
reserve |
|
|
Other reserves |
|
|
Total equity |
|
| Balance at 1 April 2015 (audited) |
|
|
1,501 |
|
|
|
167 |
|
|
|
4,372 |
|
|
|
6,040 |
|
| Profit for the period |
|
|
— |
|
|
|
— |
|
|
|
400 |
|
|
|
400 |
|
| Other comprehensive income for the period |
|
|
— |
|
|
|
— |
|
|
|
964 |
|
|
|
964 |
|
|
|
|
|
|
|
|
|
|
|
|
|
|
|
|
|
|
| Total comprehensive income |
|
|
— |
|
|
|
— |
|
|
|
1,364 |
|
|
|
1,364 |
|
|
|
|
|
|
|
|
|
|
|
|
|
|
|
|
|
|
| Dividend paid |
|
|
— |
|
|
|
— |
|
|
|
(150 |
) |
|
|
(150 |
) |
|
|
|
|
|
|
|
|
|
|
|
|
|
|
|
|
|
| Balance at 30 September 2015 (unaudited) |
|
|
1,501 |
|
|
|
167 |
|
|
|
5,586 |
|
|
|
7,254 |
|
|
|
|
|
|
|
|
|
|
|
|
|
|
|
|
|
|
|
|
|
|
|
| (£ millions) |
|
Ordinary share
capital |
|
|
Capital redemption
reserve |
|
|
Other reserves |
|
|
Total equity |
|
| Balance at 1 April 2014 (audited) |
|
|
1,501 |
|
|
|
167 |
|
|
|
4,196 |
|
|
|
5,864 |
|
| Profit for the period |
|
|
— |
|
|
|
— |
|
|
|
1,143 |
|
|
|
1,143 |
|
| Other comprehensive expense for the period |
|
|
— |
|
|
|
— |
|
|
|
(611 |
) |
|
|
(611 |
) |
|
|
|
|
|
|
|
|
|
|
|
|
|
|
|
|
|
| Total comprehensive income |
|
|
— |
|
|
|
— |
|
|
|
532 |
|
|
|
532 |
|
|
|
|
|
|
|
|
|
|
|
|
|
|
|
|
|
|
| Dividend paid |
|
|
— |
|
|
|
— |
|
|
|
(150 |
) |
|
|
(150 |
) |
|
|
|
|
|
|
|
|
|
|
|
|
|
|
|
|
|
| Balance at 30 September 2014 (unaudited) |
|
|
1,501 |
|
|
|
167 |
|
|
|
4,578 |
|
|
|
6,246 |
|
|
|
|
|
|
|
|
|
|
|
|
|
|
|
|
|
|
9
Condensed Consolidated Cash Flow Statement
For the three and six months ended 30 September 2015 (unaudited)
|
|
|
|
|
|
|
|
|
|
|
|
|
|
|
|
|
| |
|
Three months ended |
|
|
Six months ended |
|
| |
|
30 September |
|
|
30 September |
|
|
30 September |
|
|
30 September |
|
| |
|
2015 |
|
|
2014 |
|
|
2015 |
|
|
2014 |
|
| (£ millions) |
|
(unaudited) |
|
|
(unaudited) |
|
|
(unaudited) |
|
|
(unaudited) |
|
| Cash flows from operating activities |
|
|
|
|
|
|
|
|
|
|
|
|
|
|
|
|
| (Loss)/profit for the period |
|
|
(92 |
) |
|
|
450 |
|
|
|
400 |
|
|
|
1,143 |
|
| Adjustments for: |
|
|
|
|
|
|
|
|
|
|
|
|
|
|
|
|
| Depreciation and amortisation |
|
|
365 |
|
|
|
244 |
|
|
|
683 |
|
|
|
478 |
|
| Loss on sale of assets |
|
|
— |
|
|
|
— |
|
|
|
3 |
|
|
|
1 |
|
| Foreign exchange gain on loans |
|
|
59 |
|
|
|
53 |
|
|
|
(40 |
) |
|
|
26 |
|
| Income tax (credit)/expense |
|
|
(65 |
) |
|
|
159 |
|
|
|
81 |
|
|
|
390 |
|
| Finance expense (net) |
|
|
29 |
|
|
|
1 |
|
|
|
47 |
|
|
|
5 |
|
| Finance income |
|
|
(8 |
) |
|
|
(12 |
) |
|
|
(18 |
) |
|
|
(23 |
) |
| Foreign exchange loss/(gain) on derivatives |
|
|
20 |
|
|
|
24 |
|
|
|
(51 |
) |
|
|
— |
|
| Foreign exchange loss/(gain) on short term deposits |
|
|
(5 |
) |
|
|
(11 |
) |
|
|
13 |
|
|
|
(20 |
) |
| Share of loss from equity accounted investees |
|
|
1 |
|
|
|
4 |
|
|
|
7 |
|
|
|
10 |
|
| Exceptional item |
|
|
245 |
|
|
|
— |
|
|
|
245 |
|
|
|
— |
|
| Other non-cash adjustments |
|
|
(1 |
) |
|
|
— |
|
|
|
— |
|
|
|
— |
|
|
|
|
|
|
|
|
|
|
|
|
|
|
|
|
|
|
| Cash flows from operating activities before changes in assets and liabilities |
|
|
548 |
|
|
|
912 |
|
|
|
1,370 |
|
|
|
2,010 |
|
|
|
|
|
|
|
|
|
|
|
|
|
|
|
|
|
|
| Trade receivables |
|
|
(68 |
) |
|
|
61 |
|
|
|
138 |
|
|
|
84 |
|
| Other financial assets |
|
|
9 |
|
|
|
— |
|
|
|
7 |
|
|
|
(12 |
) |
| Other current assets |
|
|
14 |
|
|
|
153 |
|
|
|
(2 |
) |
|
|
119 |
|
| Inventories |
|
|
(50 |
) |
|
|
(148 |
) |
|
|
(628 |
) |
|
|
(102 |
) |
| Other non-current assets |
|
|
(12 |
) |
|
|
(9 |
) |
|
|
(14 |
) |
|
|
(9 |
) |
| Accounts payable |
|
|
(61 |
) |
|
|
160 |
|
|
|
(613 |
) |
|
|
(254 |
) |
| Other current liabilities |
|
|
18 |
|
|
|
98 |
|
|
|
(18 |
) |
|
|
31 |
|
| Other financial liabilities |
|
|
59 |
|
|
|
7 |
|
|
|
118 |
|
|
|
(4 |
) |
| Other non-current liabilities and retirement benefit obligations |
|
|
78 |
|
|
|
34 |
|
|
|
141 |
|
|
|
80 |
|
| Provisions |
|
|
(21 |
) |
|
|
(8 |
) |
|
|
(49 |
) |
|
|
38 |
|
|
|
|
|
|
|
|
|
|
|
|
|
|
|
|
|
|
| Cash generated from operations |
|
|
514 |
|
|
|
1,260 |
|
|
|
450 |
|
|
|
1,981 |
|
|
|
|
|
|
|
|
|
|
|
|
|
|
|
|
|
|
| Income tax paid |
|
|
(48 |
) |
|
|
(71 |
) |
|
|
(105 |
) |
|
|
(172 |
) |
|
|
|
|
|
|
|
|
|
|
|
|
|
|
|
|
|
| Net cash generated from operating activities |
|
|
466 |
|
|
|
1,189 |
|
|
|
345 |
|
|
|
1,809 |
|
|
|
|
|
|
|
|
|
|
|
|
|
|
|
|
|
|
| Cash flows used in investing activities |
|
|
|
|
|
|
|
|
|
|
|
|
|
|
|
|
| Investment in joint ventures |
|
|
— |
|
|
|
— |
|
|
|
— |
|
|
|
(72 |
) |
| Movements in other restricted deposits |
|
|
— |
|
|
|
(1 |
) |
|
|
4 |
|
|
|
1 |
|
| Investment in short term deposits |
|
|
(680 |
) |
|
|
(789 |
) |
|
|
(1,488 |
) |
|
|
(1,505 |
) |
| Redemption of short term deposits |
|
|
1,065 |
|
|
|
741 |
|
|
|
1,674 |
|
|
|
1,232 |
|
| Movements in short term deposits |
|
|
385 |
|
|
|
(48 |
) |
|
|
186 |
|
|
|
(273 |
) |
| Purchases of property, plant and equipment |
|
|
(378 |
) |
|
|
(367 |
) |
|
|
(727 |
) |
|
|
(655 |
) |
| Proceeds from sale of property, plant and equipment |
|
|
— |
|
|
|
1 |
|
|
|
— |
|
|
|
1 |
|
| Cash paid for intangible assets |
|
|
(322 |
) |
|
|
(335 |
) |
|
|
(685 |
) |
|
|
(604 |
) |
| Finance income received |
|
|
9 |
|
|
|
10 |
|
|
|
20 |
|
|
|
22 |
|
|
|
|
|
|
|
|
|
|
|
|
|
|
|
|
|
|
| Net cash used in investing activities |
|
|
(306 |
) |
|
|
(740 |
) |
|
|
(1,202 |
) |
|
|
(1,580 |
) |
|
|
|
|
|
|
|
|
|
|
|
|
|
|
|
|
|
| Cash flows from financing activities |
|
|
|
|
|
|
|
|
|
|
|
|
|
|
|
|
| Finance expenses and fees paid |
|
|
(50 |
) |
|
|
(41 |
) |
|
|
(75 |
) |
|
|
(67 |
) |
| Proceeds from issuance of short term borrowings |
|
|
— |
|
|
|
— |
|
|
|
6 |
|
|
|
— |
|
| Repayment of short term borrowings |
|
|
(25 |
) |
|
|
(11 |
) |
|
|
(25 |
) |
|
|
(6 |
) |
| Payments of lease obligations |
|
|
(2 |
) |
|
|
(2 |
) |
|
|
(3 |
) |
|
|
(3 |
) |
| Dividends paid |
|
|
— |
|
|
|
— |
|
|
|
(150 |
) |
|
|
(150 |
) |
|
|
|
|
|
|
|
|
|
|
|
|
|
|
|
|
|
| Net cash used in financing activities |
|
|
(77 |
) |
|
|
(54 |
) |
|
|
(247 |
) |
|
|
(226 |
) |
|
|
|
|
|
|
|
|
|
|
|
|
|
|
|
|
|
| Net change in cash and cash equivalents |
|
|
83 |
|
|
|
395 |
|
|
|
(1,104 |
) |
|
|
3 |
|
| Cash and cash equivalents at beginning of period |
|
|
2,021 |
|
|
|
1,868 |
|
|
|
3,208 |
|
|
|
2,260 |
|
|
|
|
|
|
|
|
|
|
|
|
|
|
|
|
|
|
| Cash and cash equivalents at end of period |
|
|
2,104 |
|
|
|
2,263 |
|
|
|
2,104 |
|
|
|
2,263 |
|
|
|
|
|
|
|
|
|
|
|
|
|
|
|
|
|
|
10
Notes (forming part of the condensed consolidated financial statements)
Basis of preparation
The information for the three and six months ended 30 September 2015 is unaudited and does not constitute statutory accounts as defined in
Section 435 of the Companies Act 2006. The condensed consolidated interim financial statements of Jaguar Land Rover Automotive plc have been prepared in accordance with International Accounting Standard 34, “Interim Financial
Reporting” under IFRS as adopted by the European Union (‘EU’).
The condensed consolidated interim financial statements have been prepared
on a historical cost basis except for certain financial instruments held at fair value. These financial instrument valuations are classified as level 2 fair value measurements, as defined by IFRS 13, being those derived from inputs other than quoted
prices which are observable. There have been no changes in the valuation techniques used or transfers between fair value levels from those set out in the annual consolidated financial statements for the year ended 31 March 2015.
The condensed consolidated interim financial statements should be read in conjunction with the annual consolidated financial statements for the year ended
31 March 2015, which were prepared in accordance with IFRS as adopted by the EU. There were no differences between those financial statements and the financial statements for the group prepared under IFRS as adopted by the International
Accounting Standards Board.
The condensed consolidated interim financial statements have been prepared on the going concern basis as set out within the
directors’ statement of responsibilities section of the group’s annual report for the year ended 31 March 2015.
The accounting policies
applied are consistent with those of the annual consolidated financial statements for the year ended 31 March 2015, as described in those financial statements.
A provision against the carrying value of inventory of £245 million has
been recorded following the group’s assessment of the physical condition of the vehicles involved in the Tianjin explosion in August 2015. The process for finalising an insurance claim may take some months to conclude, so insurance and other
potential recoveries will only be recognised in future periods when paid or confirmed and have not been recognised in this period.
Due to the size of the
provision recorded the charge together with the associated tax impact has been disclosed as an exceptional item.
| 3 |
Research and development |
|
|
|
|
|
|
|
|
|
|
|
|
|
|
|
|
|
| |
|
Three months ended |
|
|
Six months ended |
|
| |
|
30 September |
|
|
30 September |
|
|
30 September |
|
|
30 September |
|
| |
|
2015 |
|
|
2014 |
|
|
2015 |
|
|
2014 |
|
| (£ millions) |
|
(unaudited) |
|
|
(unaudited) |
|
|
(unaudited) |
|
|
(unaudited) |
|
| Total research and development costs incurred |
|
|
381 |
|
|
|
336 |
|
|
|
760 |
|
|
|
662 |
|
| Research and development expensed |
|
|
(75 |
) |
|
|
(62 |
) |
|
|
(139 |
) |
|
|
(115 |
) |
|
|
|
|
|
|
|
|
|
|
|
|
|
|
|
|
|
| Development costs capitalised |
|
|
306 |
|
|
|
274 |
|
|
|
621 |
|
|
|
547 |
|
|
|
|
|
|
|
|
|
|
|
|
|
|
|
|
|
|
| Interest capitalised |
|
|
16 |
|
|
|
29 |
|
|
|
36 |
|
|
|
59 |
|
| Research and development expenditure credit |
|
|
(18 |
) |
|
|
(13 |
) |
|
|
(36 |
) |
|
|
(26 |
) |
|
|
|
|
|
|
|
|
|
|
|
|
|
|
|
|
|
| Total internally developed intangible additions |
|
|
304 |
|
|
|
290 |
|
|
|
621 |
|
|
|
580 |
|
|
|
|
|
|
|
|
|
|
|
|
|
|
|
|
|
|
11
Notes (continued)
| 4 |
Finance income and expense |
Recognised in net income
|
|
|
|
|
|
|
|
|
|
|
|
|
|
|
|
|
| |
|
Three months ended |
|
|
Six months ended |
|
| |
|
30 September |
|
|
30 September |
|
|
30 September |
|
|
30 September |
|
| |
|
2015 |
|
|
2014 |
|
|
2015 |
|
|
2014 |
|
| (£ millions) |
|
(unaudited) |
|
|
(unaudited) |
|
|
(unaudited) |
|
|
(unaudited) |
|
| Finance income |
|
|
8 |
|
|
|
12 |
|
|
|
18 |
|
|
|
23 |
|
|
|
|
|
|
|
|
|
|
|
|
|
|
|
|
|
|
| Total finance income |
|
|
8 |
|
|
|
12 |
|
|
|
18 |
|
|
|
23 |
|
|
|
|
|
|
|
|
|
|
|
|
|
|
|
|
|
|
| Total interest expense on financial liabilities measured at amortised cost |
|
|
(40 |
) |
|
|
(33 |
) |
|
|
(74 |
) |
|
|
(71 |
) |
| Unwind of discount on provisions |
|
|
(5 |
) |
|
|
2 |
|
|
|
(10 |
) |
|
|
6 |
|
| Interest capitalised |
|
|
16 |
|
|
|
30 |
|
|
|
37 |
|
|
|
60 |
|
|
|
|
|
|
|
|
|
|
|
|
|
|
|
|
|
|
| Total finance expense (net) |
|
|
(29 |
) |
|
|
(1 |
) |
|
|
(47 |
) |
|
|
(5 |
) |
|
|
|
|
|
|
|
|
|
|
|
|
|
|
|
|
|
The capitalisation rate used to calculate borrowing costs eligible for capitalisation was 4.6% (six months ended
30 September 2014: 6.0%).
| 5 |
Allowances for trade and other receivables |
Changes in the allowances for trade and other receivables
are as follows:
|
|
|
|
|
|
|
|
|
| |
|
30 September 2015 |
|
|
31 March 2015 |
|
| As at (£ millions) |
|
(unaudited) |
|
|
(audited) |
|
| At beginning of period |
|
|
11 |
|
|
|
8 |
|
| Change in allowance during the period |
|
|
— |
|
|
|
3 |
|
| Written off |
|
|
(1 |
) |
|
|
— |
|
|
|
|
|
|
|
|
|
|
| At end of period |
|
|
10 |
|
|
|
11 |
|
|
|
|
|
|
|
|
|
|
| 6 |
Other financial assets - current |
|
|
|
|
|
|
|
|
|
| |
|
30 September 2015 |
|
|
31 March 2015 |
|
| As at (£ millions) |
|
(unaudited) |
|
|
(audited) |
|
| Advances and other receivables recoverable in cash |
|
|
7 |
|
|
|
19 |
|
| Derivative financial instruments |
|
|
214 |
|
|
|
176 |
|
| Accrued income |
|
|
9 |
|
|
|
5 |
|
| Other |
|
|
15 |
|
|
|
14 |
|
|
|
|
|
|
|
|
|
|
| Total current other financial assets |
|
|
245 |
|
|
|
214 |
|
|
|
|
|
|
|
|
|
|
|
|
|
|
|
|
|
|
|
| |
|
30 September 2015 |
|
|
31 March 2015 |
|
| As at (£ millions) |
|
(unaudited) |
|
|
(audited) |
|
| Raw materials and consumables |
|
|
89 |
|
|
|
80 |
|
| Work in progress |
|
|
379 |
|
|
|
298 |
|
| Finished goods |
|
|
2,331 |
|
|
|
2,038 |
|
|
|
|
|
|
|
|
|
|
| Total inventories |
|
|
2,799 |
|
|
|
2,416 |
|
|
|
|
|
|
|
|
|
|
|
|
|
|
|
|
|
|
|
| |
|
30 September 2015 |
|
|
31 March 2015 |
|
| As at (£ millions) |
|
(unaudited) |
|
|
(audited) |
|
| Recoverable VAT |
|
|
205 |
|
|
|
221 |
|
| Prepaid expenses |
|
|
120 |
|
|
|
106 |
|
| Other |
|
|
68 |
|
|
|
69 |
|
|
|
|
|
|
|
|
|
|
| Total current other assets |
|
|
393 |
|
|
|
396 |
|
|
|
|
|
|
|
|
|
|
12
Notes (continued)
Recognised in the income statement
The income tax for the three and six month periods ended 30 September 2015 and 30 September 2014 is charged at the estimated effective tax rate
expected to apply for the applicable financial year ends.
The income tax credit/(expense) for the three and six month periods ended 30 September
2015 includes a tax credit on the exceptional item as highlighted in note 2 of £61 million.
Capital expenditure in the period was £704 million (6 month period to
30 September 2014: £755 million) on fixed assets and £705 million (6 month period to 30 September 2014: £641 million) was capitalised as intangible engineering assets (excluding the R&D tax credit). There were no
impairments, material disposals or changes in use of assets.
| 11 |
Other financial liabilities |
|
|
|
|
|
|
|
|
|
| |
|
30 September 2015 |
|
|
31 March 2015 |
|
| As at (£ millions) |
|
(unaudited) |
|
|
(audited) |
|
| Current |
|
|
|
|
|
|
|
|
| Finance lease obligations |
|
|
6 |
|
|
|
4 |
|
| Interest accrued |
|
|
22 |
|
|
|
25 |
|
| Derivative financial instruments |
|
|
402 |
|
|
|
697 |
|
| Liability for vehicles sold under a repurchase arrangement |
|
|
260 |
|
|
|
197 |
|
| Other payables |
|
|
6 |
|
|
|
— |
|
|
|
|
|
|
|
|
|
|
|
|
|
696 |
|
|
|
923 |
|
|
|
|
|
|
|
|
|
|
| Non-current |
|
|
|
|
|
|
|
|
| Finance lease obligations |
|
|
4 |
|
|
|
9 |
|
| Derivative financial instruments |
|
|
465 |
|
|
|
832 |
|
| Other payables |
|
|
1 |
|
|
|
1 |
|
|
|
|
|
|
|
|
|
|
|
|
|
470 |
|
|
|
842 |
|
|
|
|
|
|
|
|
|
|
|
|
|
|
|
|
|
|
|
| |
|
30 September 2015 |
|
|
31 March 2015 |
|
| As at (£ millions) |
|
(unaudited) |
|
|
(audited) |
|
| Current |
|
|
|
|
|
|
|
|
| Product warranty |
|
|
409 |
|
|
|
426 |
|
| Legal and product liability |
|
|
52 |
|
|
|
50 |
|
| Provisions for residual risk |
|
|
5 |
|
|
|
4 |
|
| Provision for environmental liability |
|
|
5 |
|
|
|
5 |
|
|
|
|
|
|
|
|
|
|
| Total current provisions |
|
|
471 |
|
|
|
485 |
|
|
|
|
|
|
|
|
|
|
| Non-current |
|
|
|
|
|
|
|
|
| Product warranty |
|
|
572 |
|
|
|
585 |
|
| Provision for residual risk |
|
|
12 |
|
|
|
16 |
|
| Provision for environmental liability |
|
|
26 |
|
|
|
26 |
|
| Other employee benefits obligations |
|
|
5 |
|
|
|
12 |
|
|
|
|
|
|
|
|
|
|
| Total non-current provisions |
|
|
615 |
|
|
|
639 |
|
|
|
|
|
|
|
|
|
|
13
Notes (continued)
| 12 |
Provisions (continued) |
|
|
|
|
|
|
|
|
|
| |
|
Six months ended |
|
|
Year ended |
|
| |
|
30 September 2015 |
|
|
31 March 2015 |
|
| (£ millions) |
|
(unaudited) |
|
|
(audited) |
|
| Product warranty |
|
|
|
|
|
|
|
|
| Opening balance |
|
|
1,011 |
|
|
|
881 |
|
| Provision made during the period |
|
|
200 |
|
|
|
562 |
|
| Provision used during the period |
|
|
(237 |
) |
|
|
(430 |
) |
| Impact of discounting |
|
|
10 |
|
|
|
17 |
|
| Foreign currency translation |
|
|
(3 |
) |
|
|
(19 |
) |
|
|
|
|
|
|
|
|
|
| Closing balance |
|
|
981 |
|
|
|
1,011 |
|
|
|
|
|
|
|
|
|
|
| Legal and product liability |
|
|
|
|
|
|
|
|
| Opening balance |
|
|
50 |
|
|
|
49 |
|
| Provision made during the period |
|
|
18 |
|
|
|
18 |
|
| Provision used during the period |
|
|
(15 |
) |
|
|
(17 |
) |
| Foreign currency translation |
|
|
(1 |
) |
|
|
— |
|
|
|
|
|
|
|
|
|
|
| Closing balance |
|
|
52 |
|
|
|
50 |
|
|
|
|
|
|
|
|
|
|
| Residual risk |
|
|
|
|
|
|
|
|
| Opening balance |
|
|
20 |
|
|
|
15 |
|
| Provision made during the period |
|
|
2 |
|
|
|
5 |
|
| Provision used during the period |
|
|
(5 |
) |
|
|
— |
|
| Foreign currency translation |
|
|
— |
|
|
|
— |
|
|
|
|
|
|
|
|
|
|
| Closing balance |
|
|
17 |
|
|
|
20 |
|
|
|
|
|
|
|
|
|
|
| Environmental liability |
|
|
|
|
|
|
|
|
| Opening balance |
|
|
31 |
|
|
|
21 |
|
| Provision made during the period |
|
|
1 |
|
|
|
10 |
|
| Provision used during the period |
|
|
(1 |
) |
|
|
— |
|
|
|
|
|
|
|
|
|
|
| Closing balance |
|
|
31 |
|
|
|
31 |
|
|
|
|
|
|
|
|
|
|
Product warranty provision
The group offers warranty cover in respect of manufacturing defects, which become apparent within one to five years after purchase, dependent on the market in
which the purchase occurred.
Legal and product liability provision
A legal and product liability provision is maintained in respect of known litigation which impacts the group. The provision primarily relates to motor accident
claims, consumer complaints, dealer terminations, employment cases and personal injury claims.
Residual risk provision
In certain markets, the group is responsible for the residual risk arising on vehicles sold by dealers on leasing arrangements. The provision is based on the
latest available market expectations of future residual value trends. The timing of the outflows will be at the end of the lease arrangements – being typically up to three years.
Environmental risk provision
This provision relates to
various environmental remediation costs such as asbestos removal and land clean up. The timing of when these costs will be incurred is not known with certainty.
| 13 |
Other current liabilities |
|
|
|
|
|
|
|
|
|
| |
|
30 September 2015 |
|
|
31 March 2015 |
|
| As at (£ millions) |
|
(unaudited) |
|
|
(audited) |
|
| Liabilities for advances received |
|
|
164 |
|
|
|
183 |
|
| Deferred revenue |
|
|
65 |
|
|
|
54 |
|
| VAT |
|
|
71 |
|
|
|
88 |
|
| Others |
|
|
51 |
|
|
|
49 |
|
|
|
|
|
|
|
|
|
|
| Total current other liabilities |
|
|
351 |
|
|
|
374 |
|
|
|
|
|
|
|
|
|
|
14
Notes (continued)
| 14 |
Interest bearing loans and borrowings |
|
|
|
|
|
|
|
|
|
| |
|
30 September 2015 |
|
|
31 March 2015 |
|
| As at (£ millions) |
|
(unaudited) |
|
|
(audited) |
|
| Short term borrowings |
|
|
|
|
|
|
|
|
| Bank loans |
|
|
136 |
|
|
|
156 |
|
|
|
|
|
|
|
|
|
|
| Short term borrowings |
|
|
136 |
|
|
|
156 |
|
|
|
|
|
|
|
|
|
|
| Long term borrowings |
|
|
|
|
|
|
|
|
| EURO MTF listed debt |
|
|
2,345 |
|
|
|
2,381 |
|
|
|
|
|
|
|
|
|
|
| Long term borrowings |
|
|
2,345 |
|
|
|
2,381 |
|
|
|
|
|
|
|
|
|
|
| Finance lease obligations |
|
|
10 |
|
|
|
13 |
|
|
|
|
|
|
|
|
|
|
| Total debt |
|
|
2,491 |
|
|
|
2,550 |
|
|
|
|
|
|
|
|
|
|
The movement of reserves is as follows:
|
|
|
|
|
|
|
|
|
|
|
|
|
|
|
|
|
| (£ millions) |
|
Translation
reserve |
|
|
Hedging
reserve |
|
|
Retained
earnings |
|
|
Total reserves |
|
| Balance at 1 April 2015 (audited) |
|
|
(362 |
) |
|
|
(910 |
) |
|
|
5,644 |
|
|
|
4,372 |
|
| Profit for the period |
|
|
— |
|
|
|
— |
|
|
|
400 |
|
|
|
400 |
|
| Remeasurement of defined benefit obligation |
|
|
— |
|
|
|
— |
|
|
|
435 |
|
|
|
435 |
|
| Gain on effective cash flow hedges |
|
|
— |
|
|
|
669 |
|
|
|
— |
|
|
|
669 |
|
| Currency translation differences |
|
|
(14 |
) |
|
|
— |
|
|
|
— |
|
|
|
(14 |
) |
| Income tax related to items recognised in other comprehensive income |
|
|
— |
|
|
|
(133 |
) |
|
|
(87 |
) |
|
|
(220 |
) |
| Cash flow hedges reclassified to foreign exchange in profit or loss |
|
|
— |
|
|
|
118 |
|
|
|
— |
|
|
|
118 |
|
| Income tax related to items reclassified to profit or loss |
|
|
— |
|
|
|
(24 |
) |
|
|
— |
|
|
|
(24 |
) |
| Dividend paid |
|
|
— |
|
|
|
— |
|
|
|
(150 |
) |
|
|
(150 |
) |
|
|
|
|
|
|
|
|
|
|
|
|
|
|
|
|
|
| Balance at 30 September 2015 (unaudited) |
|
|
(376 |
) |
|
|
(280 |
) |
|
|
6,242 |
|
|
|
5,586 |
|
|
|
|
|
|
|
|
|
|
|
|
|
|
|
|
|
|
|
|
|
|
|
| (£ millions) |
|
Translation
reserve |
|
|
Hedging
reserve |
|
|
Retained
earnings |
|
|
Total reserves |
|
| Balance at 1 April 2014 (audited) |
|
|
(383 |
) |
|
|
539 |
|
|
|
4,040 |
|
|
|
4,196 |
|
| Profit for the period |
|
|
— |
|
|
|
— |
|
|
|
1,143 |
|
|
|
1,143 |
|
| Remeasurement of defined benefit obligation |
|
|
— |
|
|
|
— |
|
|
|
(194 |
) |
|
|
(194 |
) |
| Gain on effective cash flow hedges |
|
|
— |
|
|
|
(412 |
) |
|
|
— |
|
|
|
(412 |
) |
| Currency translation differences |
|
|
— |
|
|
|
— |
|
|
|
— |
|
|
|
— |
|
| Income tax related to items recognised in other comprehensive income |
|
|
— |
|
|
|
81 |
|
|
|
39 |
|
|
|
120 |
|
| Cash flow hedges reclassified to foreign exchange in profit or loss |
|
|
— |
|
|
|
(158 |
) |
|
|
— |
|
|
|
(158 |
) |
| Income tax related to items reclassified to profit or loss |
|
|
— |
|
|
|
33 |
|
|
|
— |
|
|
|
33 |
|
| Dividend paid |
|
|
— |
|
|
|
— |
|
|
|
(150 |
) |
|
|
(150 |
) |
|
|
|
|
|
|
|
|
|
|
|
|
|
|
|
|
|
| Balance at 30 September 2014 (unaudited) |
|
|
(383 |
) |
|
|
83 |
|
|
|
4,878 |
|
|
|
4,578 |
|
|
|
|
|
|
|
|
|
|
|
|
|
|
|
|
|
|
15
Notes (continued)
During the three months ended 30 September 2015, no ordinary share dividend was proposed
and paid (three months to 30 September 2014: £nil).
During the six months ended 30 September 2015, an ordinary share dividend of
£150 million was proposed and paid (six months to 30 September 2014: £150 million).
Jaguar Land Rover Limited has pension arrangements providing employees with defined
benefits related to pay and service as set out in the rules of each fund. The following table sets out the disclosure pertaining to employee benefits of Jaguar Land Rover Limited and overseas subsidiaries which operate defined benefit pension plans.
|
|
|
|
|
|
|
|
|
| |
|
Six months ended |
|
|
Year ended |
|
| |
|
30 September 2015 |
|
|
31 March 2015 |
|
| (£ millions) |
|
(unaudited) |
|
|
(audited) |
|
| Change in defined benefit obligation |
|
|
|
|
|
|
|
|
| Defined benefit obligation, beginning of the period |
|
|
7,883 |
|
|
|
6,053 |
|
| Service cost |
|
|
112 |
|
|
|
168 |
|
| Interest cost |
|
|
132 |
|
|
|
274 |
|
| Actuarial (gains) / losses arising from: |
|
|
|
|
|
|
|
|
| - Changes in demographic assumptions |
|
|
(36 |
) |
|
|
(20 |
) |
| - Changes in financial assumptions |
|
|
(828 |
) |
|
|
1,454 |
|
| - Experience adjustments |
|
|
96 |
|
|
|
101 |
|
| Prior service costs |
|
|
— |
|
|
|
1 |
|
| Foreign currency translation |
|
|
— |
|
|
|
— |
|
| Member contributions |
|
|
1 |
|
|
|
2 |
|
| Benefits paid |
|
|
(79 |
) |
|
|
(149 |
) |
| Other adjustments |
|
|
— |
|
|
|
(1 |
) |
|
|
|
|
|
|
|
|
|
| Defined benefit obligation at end of period |
|
|
7,281 |
|
|
|
7,883 |
|
|
|
|
|
|
|
|
|
|
| Change in plan assets |
|
|
|
|
|
|
|
|
| Fair value of plan assets at beginning of the period |
|
|
6,997 |
|
|
|
5,382 |
|
| Interest income |
|
|
116 |
|
|
|
246 |
|
| Remeasurement (loss) / gain on the return of plan assets, excluding amounts included in interest income |
|
|
(328 |
) |
|
|
1,178 |
|
| Administrative expenses |
|
|
(4 |
) |
|
|
(8 |
) |
| Foreign currency translation |
|
|
— |
|
|
|
1 |
|
| Employer’s contributions |
|
|
12 |
|
|
|
346 |
|
| Members contributions |
|
|
1 |
|
|
|
2 |
|
| Benefits paid |
|
|
(79 |
) |
|
|
(149 |
) |
| Other adjustments |
|
|
— |
|
|
|
(1 |
) |
|
|
|
|
|
|
|
|
|
| Fair value of plan assets at end of period |
|
|
6,715 |
|
|
|
6,997 |
|
|
|
|
|
|
|
|
|
|
| Amount recognised in the balance sheet consist of |
|
|
|
|
|
|
|
|
| Present value of defined benefit obligations |
|
|
(7,281 |
) |
|
|
(7,883 |
) |
| Fair value of plan assets |
|
|
6,715 |
|
|
|
6,997 |
|
| Restriction on asset and onerous obligation |
|
|
(6 |
) |
|
|
(1 |
) |
|
|
|
|
|
|
|
|
|
| Net liability |
|
|
(572 |
) |
|
|
(887 |
) |
|
|
|
|
|
|
|
|
|
| Non-current liabilities |
|
|
(572 |
) |
|
|
(887 |
) |
|
|
|
|
|
|
|
|
|
16
Notes (continued)
| 17 |
Employee benefits (continued) |
The range of assumptions used in accounting for the pension plans in both periods is set out below:
|
|
|
|
|
|
|
|
|
| |
|
Six months ended
30 September 2015
(unaudited) |
|
|
Year ended
31 March 2015
(audited) |
|
| Discount rate |
|
|
3.9 |
% |
|
|
3.4 |
% |
| Expected rate of increase in compensation level of covered employees |
|
|
3.6 |
% |
|
|
3.6 |
% |
| Inflation increase |
|
|
3.1 |
% |
|
|
3.1 |
% |
For the valuation at 30 September 2015 and 31 March 2015, the mortality assumptions used are the SAPS base table, in
particular S1NxA tables and the Light table for members of the Jaguar Executive Pension Plan. A scaling factor of 115 percent has been used for the Jaguar Pension Plan, 110 percent for the Land Rover Pension Scheme, and 105 percent for males and 90
percent for females for Jaguar Executive Pension Plan. There is an allowance for future improvements in line with the CMI (2014) projections and an allowance for long-term improvements of 1.25 percent per annum.
| 18 |
Commitments and contingencies |
In the normal course of business, the group faces claims and assertions
by various parties. The group assesses such claims and assertions and monitors the legal environment on an on-going basis, with the assistance of external legal counsel wherever necessary. The group records a liability for any claims where a
potential loss is probable and capable of being estimated and discloses such matters in its financial statements, if material. For potential losses that are considered possible, but not probable, the group provides a disclosure in the financial
statements but does not record a liability in its accounts unless the loss becomes probable.
The following is a description of claims and assertions
where a potential loss is possible, but not probable. Management believe that none of the contingencies described below, either individually or in aggregate, would have a material adverse effect on the group’s financial condition, results of
operations, or cash flows.
Litigation
The
group is involved in legal proceedings, both as plaintiff and as defendant and there are claims of £15 million (31 March 2015: £11 million) against the Company which management have not recognised as they are not considered
probable. The majority of these claims pertain to motor accident claims and consumer complaints. Some of the cases also relate to replacement of parts of vehicles and/or compensation for deficiency in the services by the group or its dealers.
Other taxes and dues
The group had no significant
tax matters in dispute at 30 September 2015 or 31 March 2015 where a potential loss was considered possible.
During the year ended
31 March 2015, the group’s Brazilian subsidiary received a demand for £27 million in relation to additional indirect taxes (PIS and COFINS) claimed as being due on local vehicle and parts sales made in 2010. The matter is
currently being contested before the Brazilian appellate authorities. Professional legal opinions obtained in Brazil fully support that the basis of the tax authority’s assertion is incorrect and, as a result, the likelihood of any settlement
ultimately having to be made is considered remote.
Commitments
The group has entered into various contracts with vendors and contractors for the acquisition of plant and machinery, equipment and various civil contracts of
capital nature aggregating £805 million (31 March 2015: £814 million) and £32 million (31 March 2015: £nil) relating to the acquisition of intangible assets.
The group has entered into various contracts with vendors and contractors which include obligations aggregating £630 million (31 March 2015:
£642 million) to purchase minimum or fixed quantities of material.
Inventory of £nil (31 March 2015: £nil) and trade receivables with a
carrying amount of £136 million (31 March 2015: £156 million) and property, plant and equipment with a carrying amount of £nil (31 March 2015: £nil) and restricted cash with a carrying amount of £nil (31 March
2015: £nil) are pledged as collateral/security against the borrowings and commitments.
There are guarantees provided in the ordinary course of
business of £nil (31 March 2015: £nil).
17
Notes (continued)
The group’s objectives when managing capital are to ensure the going concern
operation of its entities and to maintain an efficient capital structure to reduce the cost of capital, support the corporate strategy and to meet shareholder expectations.
The group’s policy is to borrow primarily through capital market debt issues to meet anticipated funding requirements and maintain sufficient liquidity.
The group also maintains certain undrawn committed credit facilities to provide additional liquidity. These borrowings, together with cash generated from operations, are loaned internally or contributed as equity to certain subsidiaries as required.
Surplus cash in subsidiaries is pooled (where practicable) and invested to satisfy security, liquidity and yield requirements.
The capital structure is
governed according to group policies approved by the Board and is monitored by various metrics such as debt to Adjusted EBITDA and Adjusted EBITDA to interest ratios, as per the debt covenants and rating agency guidance. Funding requirements are
reviewed periodically with any debt issuances and capital distributions approved by the Board.
The following table summarises the capital of the group:
|
|
|
|
|
|
|
|
|
| As at (£ millions) |
|
30 September 2015
(unaudited) |
|
|
31 March 2015
(audited) |
|
| Short term debt |
|
|
142 |
|
|
|
160 |
|
| Long term debt |
|
|
2,349 |
|
|
|
2,390 |
|
|
|
|
|
|
|
|
|
|
| Total debt* |
|
|
2,491 |
|
|
|
2,550 |
|
|
|
|
|
|
|
|
|
|
| Equity |
|
|
7,254 |
|
|
|
6,040 |
|
|
|
|
|
|
|
|
|
|
| Total capital (debt and equity) |
|
|
9,745 |
|
|
|
8,590 |
|
|
|
|
|
|
|
|
|
|
| * |
Total debt includes finance lease obligations of £10 million (31 March 2015: £13 million). |
| 20 |
Related party transactions |
The group’s related parties principally consist of Tata Sons Limited.,
subsidiaries, associates and joint ventures of Tata Sons Limited which includes Tata Motors Limited (the ultimate parent company), subsidiaries, associates and joint ventures of Tata Motors Limited. The group routinely enters into transactions with
these related parties in the ordinary course of business including transactions for sale and purchase of products with its associates and joint ventures. Transactions and balances with the group’s own subsidiaries are eliminated on
consolidation.
The following table summarises related party transactions and balances not eliminated in the consolidated condensed interim financial
statements.
|
|
|
|
|
|
|
|
|
|
|
|
|
|
|
|
|
|
|
|
|
|
|
|
|
| Six months ended 30 September (£ millions) |
|
With joint
ventures
of the
group |
|
|
2015
(unaudited)
With Tata
Sons Limited
and its
subsidiaries
and joint
ventures |
|
|
With
immediate or
ultimate
parent and its
subsidiaries
and joint
ventures |
|
|
With joint
ventures
of the
group |
|
|
2014
(unaudited)
With Tata
Sons Limited
and its
subsidiaries
and joint
ventures |
|
|
With
immediate or
ultimate
parent and its
subsidiaries
and joint
ventures |
|
| Sale of products |
|
|
153 |
|
|
|
— |
|
|
|
21 |
|
|
|
7 |
|
|
|
— |
|
|
|
35 |
|
| Purchase of goods |
|
|
— |
|
|
|
— |
|
|
|
45 |
|
|
|
— |
|
|
|
— |
|
|
|
— |
|
| Services received |
|
|
7 |
|
|
|
69 |
|
|
|
50 |
|
|
|
— |
|
|
|
42 |
|
|
|
39 |
|
| Services rendered |
|
|
20 |
|
|
|
— |
|
|
|
— |
|
|
|
8 |
|
|
|
— |
|
|
|
— |
|
| Trade and other receivables |
|
|
56 |
|
|
|
— |
|
|
|
32 |
|
|
|
25 |
|
|
|
— |
|
|
|
25 |
|
| Accounts payable |
|
|
— |
|
|
|
7 |
|
|
|
32 |
|
|
|
— |
|
|
|
21 |
|
|
|
22 |
|
| Dividend paid |
|
|
— |
|
|
|
— |
|
|
|
150 |
|
|
|
— |
|
|
|
— |
|
|
|
150 |
|
Compensation of key management personnel
|
|
|
|
|
|
|
|
|
| Six months ended 30 September (£ millions) |
|
2015
(unaudited) |
|
|
2014
(unaudited) |
|
| Key management personnel remuneration |
|
|
7 |
|
|
|
13 |
|
18
JAGUAR LAND ROVER
JAGUAR
LAND ROVER
RESULTS FOR THE QUARTER ENDED 30 SEPTEMBER 2015
6 NOVEMBER 2015
DISCLAIMER JAGUAR LAND ROVER
Statements in this presentation describing the objectives, projections, estimates and expectations of Jaguar Land Rover Automotive plc and its direct and indirect subsidiaries (the
“Company”, “Group” or “JLR”) may be “forward-looking statements” within the meaning of applicable securities laws and regulations. Actual results could differ materially from those expressed or implied.
Important factors that could make a difference to the Company’s operations include, among others, economic conditions affecting demand / supply and price conditions in the domestic and overseas markets in which the Company operates, changes in
Government regulations, tax laws and other statutes and incidental factors.
- Q2 FY16 represents the 3 month period from 1 July 2015 to 30 September 2015
- Q2 FY15 represents the 3 month period from 1 July 2014 to 30 September 2014
Consolidated results of Jaguar Land Rover Automotive plc and its subsidiaries contained in the presentation are unaudited and presented under IFRS as approved in the EU.
Retail volume data includes and wholesale volume excludes sales from unconsolidated Chinese joint venture.
-2-
PARTICIPANTS JAGUAR LAND ROVER
Kenneth Gregor
CFO Jaguar Land Rover
Bennett Birgbauer
Treasurer Jaguar Land Rover
C. Ramakrishnan
Group CFO Tata Motors
-3-
AGENDA JAGUAR LAND ROVER
Financial performance for the quarter 5
Other developments 16
October 2015 retail volumes 18
Closing Q&A 21
-4-
JAGUAR LAND ROVER
FINANCIAL PERFORMANCE
Q2 FY16
-5-
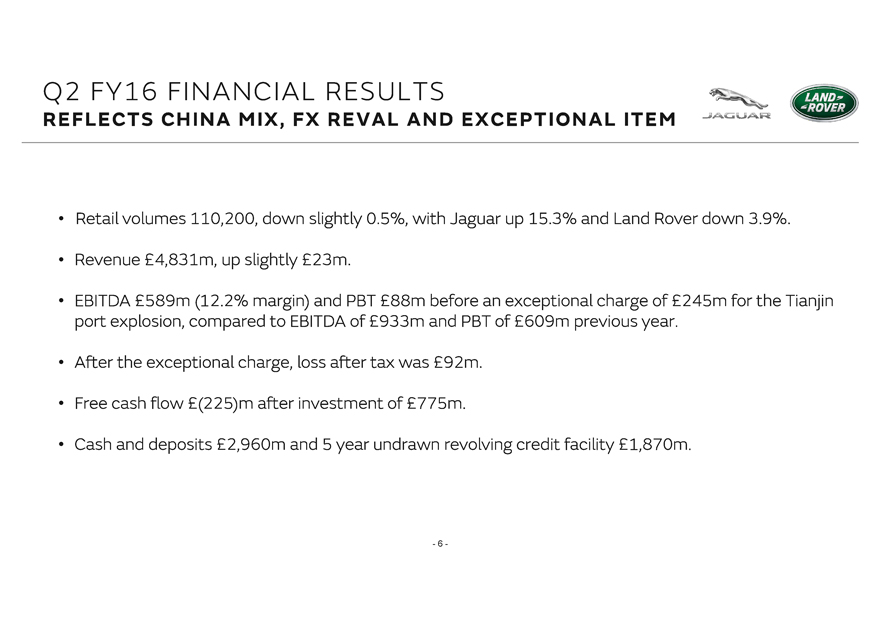
Q2 FY16 FINANCIAL RESULTS
REFLECTS CHINA MIX, FX REVAL AND EXCEPTIONAL ITEM JAGUAR LAND ROVER
Retail
volumes 110,200, down slightly 0.5%, with Jaguar up 15.3% and Land Rover down 3.9%.
Revenue £4,831m, up slightly £23m.
EBITDA £589m (12.2% margin) and PBT £88m before an exceptional charge of £245m for the Tianjin port explosion, compared to EBITDA of £933m and PBT of
£609m previous year.
After the exceptional charge, loss after tax was £92m.
Free cash flow £(225)m after investment of £775m.
Cash and deposits £2,960m
and 5 year undrawn revolving credit facility £1,870m.
-6-
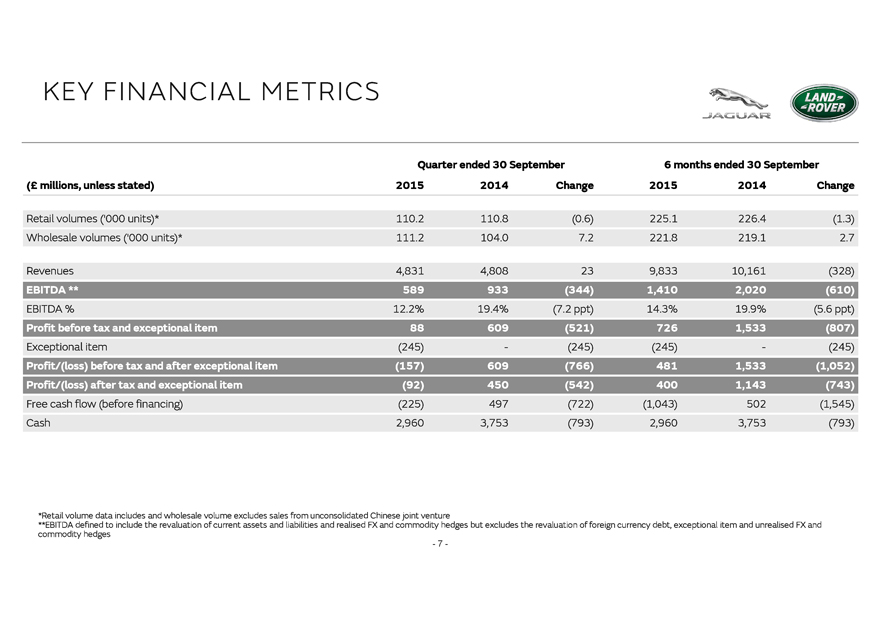
KEY FINANCIAL METRICS JAGUAR LAND ROVER
Quarter ended 30 September
6 months ended 30 September
(£ millions, unless stated) 2015 2014 Change 2015 2014 Change
Retail volumes (‘000
units)* 110.2 110.8 (0.6) 225.1 226.4 (1.3)
Wholesale volumes (‘000 units)* 111.2 104.0 7.2 221.8 219.1 2.7
Revenues 4,831 4,808 23 9,833 10,161 (328)
EBITDA ** 589 933 (344) 1,410 2,020 (610)
EBITDA % 12.2% 19.4% (7.2 ppt) 14.3% 19.9% (5.6 ppt)
Profit before tax and
exceptional item 88 609 (521) 726 1,533 (807)
Exceptional item (245) - (245) (245) - (245)
Profit/(loss) before tax and after exceptional item (157) 609 (766) 481 1,533 (1,052)
Profit/(loss) after tax and exceptional item (92) 450 (542) 400 1,143 (743)
Free cash flow (before financing) (225) 497 (722) (1,043) 502 (1,545)
Cash
2,960 3,753 (793) 2,960 3,753 (793)
*Retail volume data includes and wholesale volume excludes sales from unconsolidated Chinese joint venture
**EBITDA defined to include the revaluation of current assets and liabilities and realised FX and commodity hedges but excludes the revaluation of foreign currency debt,
exceptional item and unrealised FX and commodity hedges
-7-
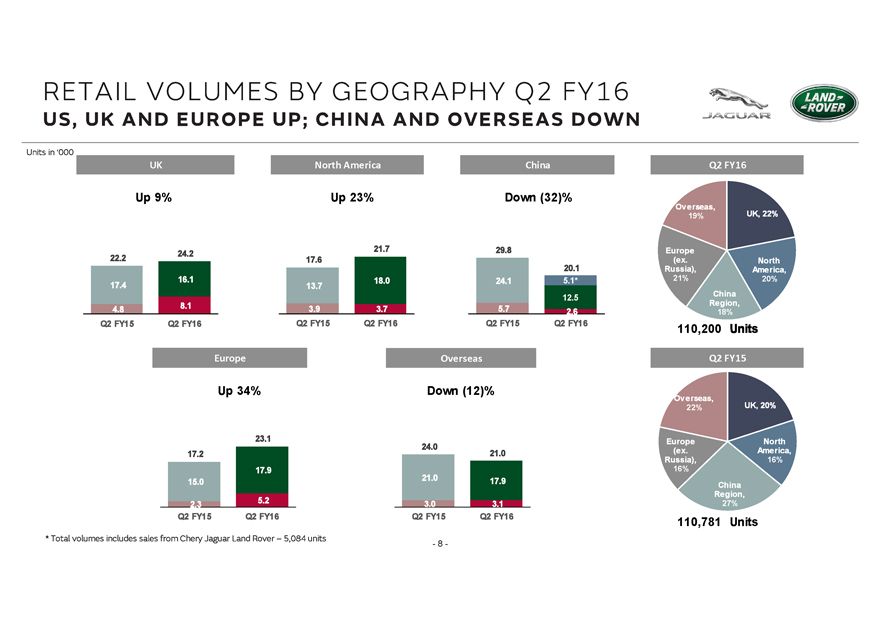
RETAIL VOLUMES BY GEOGRAPHY Q2 FY16
US, UK AND EUROPE UP; CHINA AND OVERSEAS DOWN JAGUAR LAND ROVER
Units in ‘000 UK Up 9%
22.2 17.4 4.8
Q2 FY15 24.2 16.1 8.1
Q2 FY16 North America Up 23% 17.6
13.7 3.9
Q2 FY15 21.7 18.0 3.7
Q2 FY16 China Down (32)% 29.8 24.1 5.7
Q2 FY15 20.1 5.1* 12.5 2.6
Q2 FY16 Q2 FY16
Overseas, 19% UK, 22% North America, 20% China Region, 18%
Europe (ex. Russia), 21% 110,200
Units Europe Up 34% 17.2 15.0 2.3
Q2 FY15 23.1 17.9 5.2
Q2 FY16 Overseas Down
(12)% 24.0 21.0 3.0
Q2 FY15 21.0 17.9 3.1
Q2 FY16 Q2 FY15
Overseas, 22%
UK, 20%
North America, 16%
China Region, 27%
Europe (ex. Russia), 16%
110,781 Units
* Total volumes includes sales from Chery Jaguar Land Rover – 5,084 units
-8-
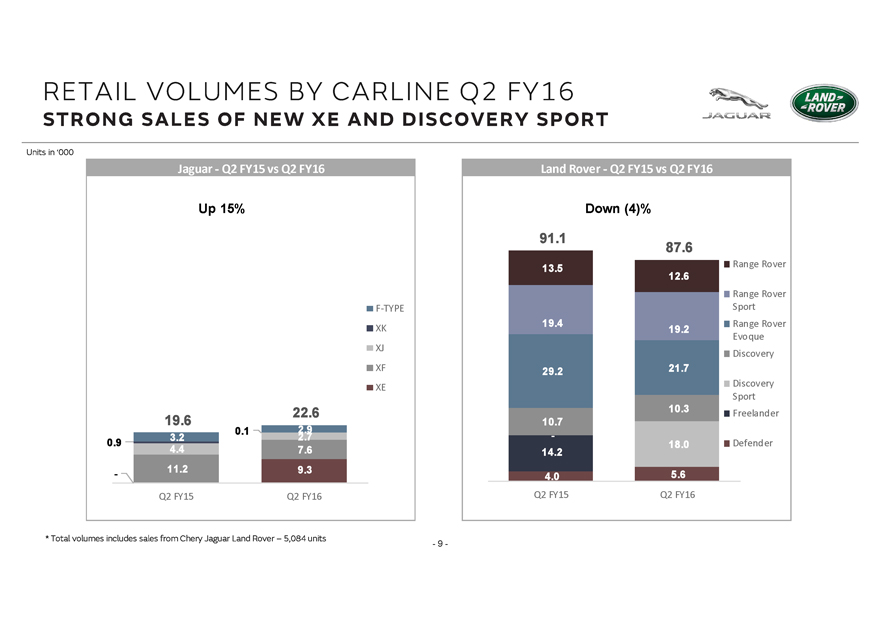
RETAIL VOLUMES BY CARLINE Q2 FY16
STRONG SALES OF NEW XE AND DISCOVERY SPORT JAGUAR LAND ROVER
Units in ‘000
Jaguar - Q2 FY15 vs Q2 FY16
Up 15%
F-TYPE
XK
XJ
XF
XE
0.9
-
19.6
3.2
4.4
11.2
Q2 FY15
0.1
22.6
2.9 2.7 7.6 9.3
Q2 FY16
Land Rover - Q2 FY15 vs Q2 FY16
Down (4)%
91.1
13.5
19.4
29.2
10.7
-
14.2
4.0
Q2 FY15
87.6
12.6
19.2
21.7
10.3
18.0
5.6
Q2 FY16
Range Rover
Range Rover
Sport
Range Rover
Evoque
Discovery
Discovery
Sport
Freelander
Defender
* Total volumes includes sales from Chery Jaguar Land Rover – 5,084 units
-9-
Q2 FY16 PROFITS YEAR ON YEAR JAGUAR LAND ROVER
Revenue of £4,831m, up slightly £23m – higher wholesale volumes with strong sales in UK, US and Europe (particularly Discovery Sport and XE), offset by softer
sales in China.
EBITDA of £589m (12.2% margin), down £344m from Q2 FY15, comprising:
Less favourable sales mix offset partially by higher wholesale volume.
Higher manufacturing
and launch costs.
Unfavourable FX revaluation, primarily Euro payables (£80m).
PBT £88m, down £521m before exceptional item, reflecting:
Lower EBITDA.
Higher depreciation and amortisation (up £121m) and finance expense (up £30m).
Unfavourable revaluation of foreign currency debt and mark to market of unrealised FX and commodity hedges not eligible for hedge accounting under IAS 39 (up £29m).
After the exceptional charge of £245m for the Tianjin explosion, loss before tax of £157m and after tax of £92m.
-10 -
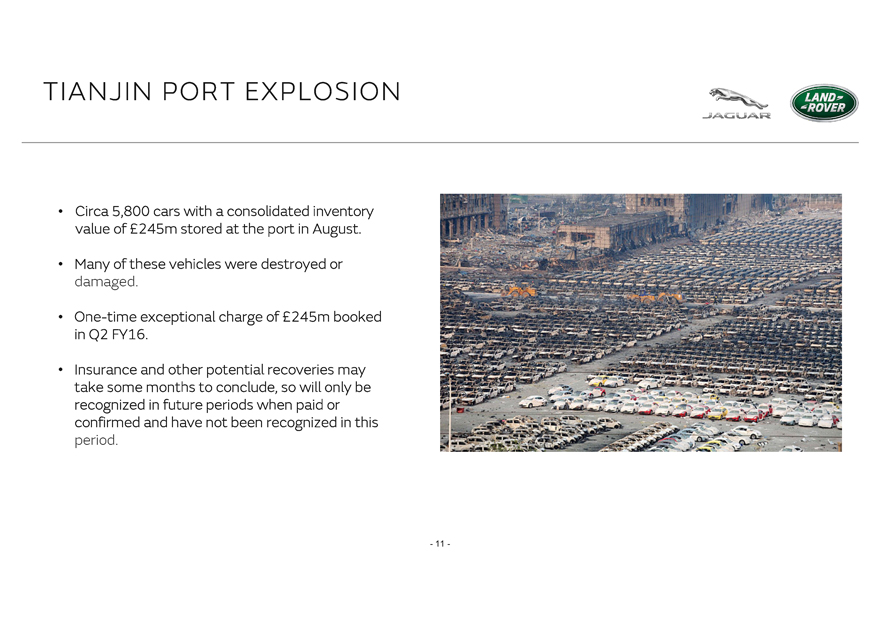
TIANJIN PORT EXPLOSION JAGUAR LAND ROVER
Circa 5,800 cars with a consolidated inventory value of £245m stored at the port in August.
Many of these vehicles were destroyed or damaged.
One-time exceptional charge of £245m
booked in Q2 FY16.
Insurance and other potential recoveries may take some months to conclude, so will only be recognized in future periods when paid or confirmed
and have not been recognized in this period.
-11 -
DIESEL TECHNOLOGY JAGUAR LAND ROVER
Jaguar Land Rover does not use any emissions defeat devices or software.
Diesel technology is
a key enabler to fulfil CO2 and other emission targets worldwide.
All our EU6 diesel engines, including our new Ingenium engines, use emissions after-treatment
based on Selective Catalytic Reduction (SCR) to support meeting emissions targets worldwide.
Jaguar Land Rover supports a move to Worldwide Harmonized Light
Vehicles Test Procedure (WLTP), including the planned introduction of real driving emissions (RDE) in 2017.
-12 -
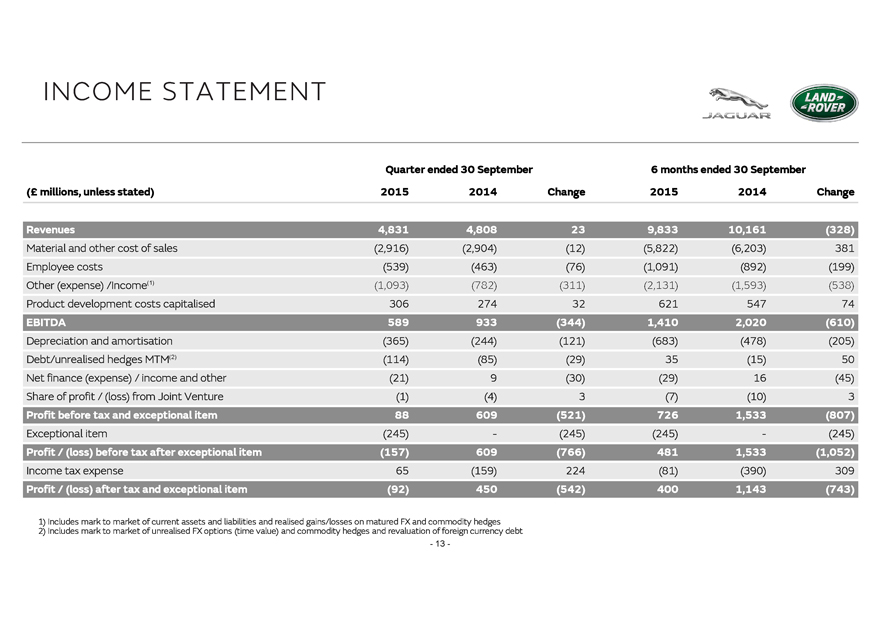
INCOME STATEMENT JAGUAR LAND ROVER
Quarter ended 30 September 6 months ended 30 September
(£ millions, unless stated) 2015
2014 Change 2015 2014 Change
Revenues 4,831 4,808 23 9,833 10,161 (328)
Material and other cost of sales (2,916) (2,904) (12) (5,822) (6,203) 381
Employee costs (539) (463) (76) (1,091) (892) (199)
Other (expense)
/Income(1) (1,093) (782) (311) (2,131) (1,593) (538)
Product development costs capitalised 306 274 32 621 547 74
EBITDA 589 933 (344) 1,410 2,020 (610)
Depreciation and amortisation (365) (244) (121) (683)
(478) (205)
Debt/unrealised hedges MTM(2) (114) (85) (29) 35 (15) 50
Net
finance (expense) / income and other (21) 9 (30) (29) 16 (45)
Share of profit / (loss) from Joint Venture (1) (4) 3 (7) (10) 3
Profit before tax and exceptional item 88 609 (521) 726 1,533 (807)
Exceptional item (245) -
(245) (245) - (245)
Profit / (loss) before tax after exceptional item (157) 609 (766) 481 1,533 (1,052)
Income tax expense 65 (159) 224 (81) (390) 309
Profit / (loss) after tax and exceptional item
(92) 450 (542) 400 1,143 (743)
1) Includes mark to market of current assets and liabilities and realised gains/losses on matured FX and commodity hedges
2) Includes mark to market of unrealised FX options (time value) and commodity hedges and revaluation of foreign currency debt
-13 -
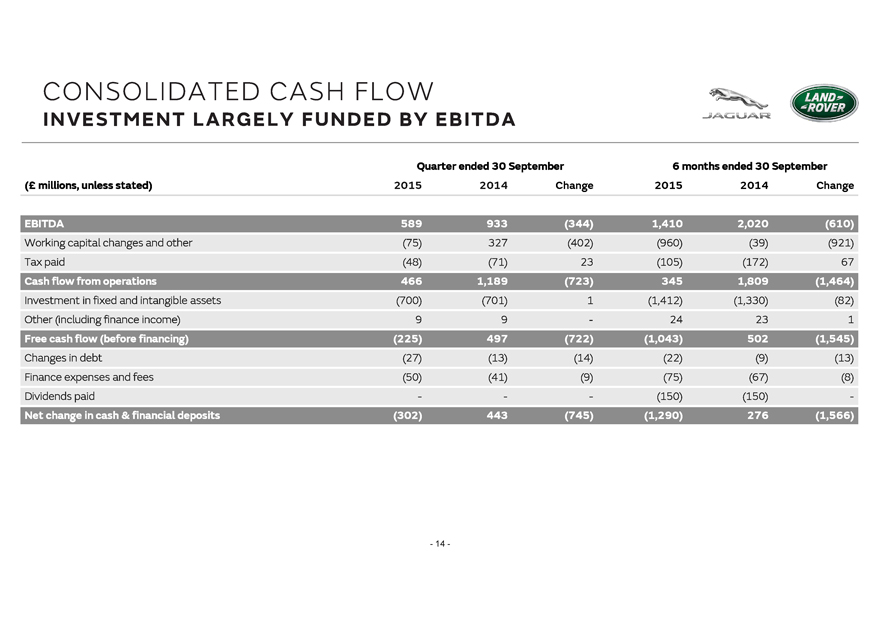
CONSOLIDATED CASH FLOW
INVESTMENT LARGELY FUNDED BY EBITDA JAGUAR LAND ROVER
Quarter ended 30
September 6 months ended 30 September
(£ millions, unless stated) 2015 2014 Change 2015 2014 Change
EBITDA 589 933 (344) 1,410 2,020 (610)
Working capital changes and other (75) 327 (402) (960)
(39) (921)
Tax paid (48) (71) 23 (105) (172) 67
Cash flow from operations 466
1,189 (723) 345 1,809 (1,464)
Investment in fixed and intangible assets (700) (701) 1 (1,412) (1,330) (82)
Other (including finance income) 9 9 - 24 23 1
Free cash flow (before financing) (225) 497
(722) (1,043) 502 (1,545)
Changes in debt (27) (13) (14) (22) (9) (13)
Finance expenses and fees (50) (41) (9) (75) (67) (8)
Dividends paid - - -
(150) (150) -
Net change in cash & financial deposits (302) 443 (745) (1,290) 276 (1,566)
-14 -
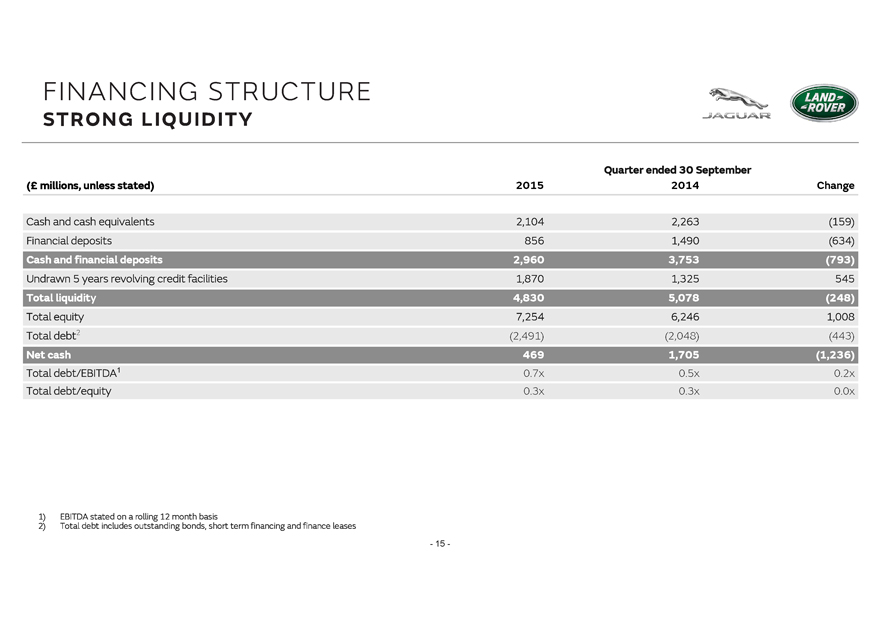
FINANCING STRUCTURE
STRONG LIQUIDITY JAGUAR LAND ROVER
Quarter ended 30 September
(£ millions, unless stated) 2015 2014 Change
Cash and cash equivalents 2,104 2,263 (159)
Financial deposits 856 1,490 (634)
Cash and financial deposits 2,960 3,753
(793)
Undrawn 5 years revolving credit facilities 1,870 1,325 545
Total
liquidity 4,830 5,078 (248)
Total equity 7,254 6,246 1,008
Total debt2
(2,491) (2,048) (443)
Net cash 469 1,705 (1,236)
Total debt/EBITDA1 0.7x 0.5x
0.2x
Total debt/equity 0.3x 0.3x 0.0x
1) EBITDA stated on a rolling 12 month
basis
2) Total debt includes outstanding bonds, short term financing and finance leases
-15 -

RECENT AND UPCOMING PRODUCT PIPELINE
EXCITING NEW PRODUCTS TO DRIVE GROWTH JAGUAR LAND ROVER
Discovery Sport – launched Feb 15
XE – Launched May 15 (US in 2016) Evoque 16MY – Launched Aug 15
All new lightweight XF – Launched Sep 15 XJ 16MY – Launching Q3 FY16 F-PACE
– Launching in 2016
-16 -

THE NEW JAGUAR F-PACE
UNVEILED AT FRANKFURT MOTORSHOW - ON SALE IN 2016 JAGUAR LAND ROVER
-17 -
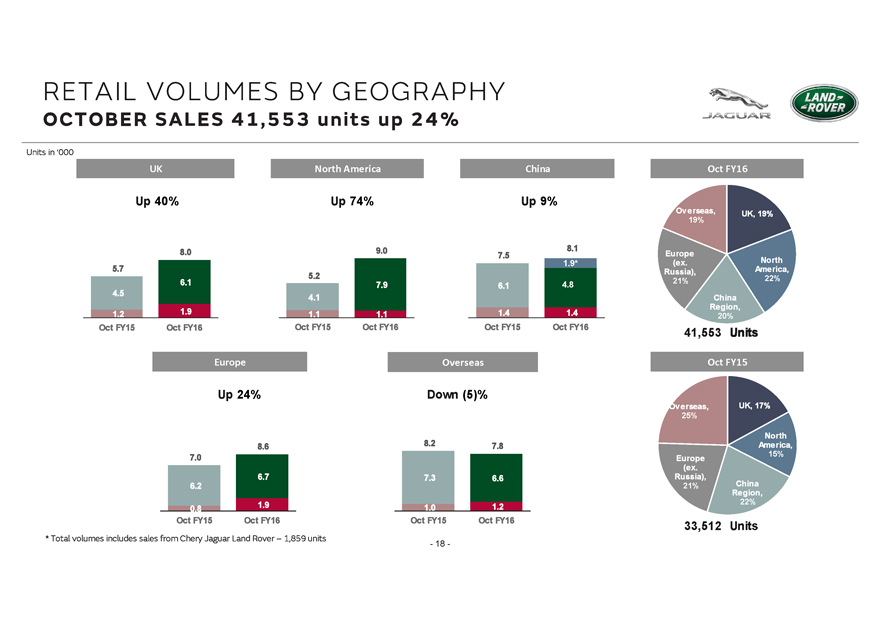
RETAIL VOLUMES BY GEOGRAPHY
OCTOBER SALES 41,553 units up 24% JAGUAR LAND ROVER
Units in ‘000
UK
Up 40%
5.7
4.5
1.2
Oct FY15
8.0
6.1
1.9
Oct FY16
North America
Up 74%
5.2
4.1
1.1
Oct FY15
9.0
7.9
1.1
Oct FY16
China
Up 9%
7.5
6.1
1.4
Oct FY15
8.1
1.9*
4.8
1.4
Oct FY16
Oct FY16
Overseas, 19%
UK, 19%
North America, 22%
China Region, 20%
Europe (ex. Russia), 21%
41,553 Units
Europe
Up 24%
7.0
6.2
0.8
Oct FY15
8.6
6.7
1.9
Oct FY16
Overseas
Down (5)%
8.2
7.3
1.0
Oct FY15
7.8
6.6
1.2
Oct FY16
Oct FY15
Overseas, 25%
UK, 17%
North America, 15%
China Region, 22%
Europe (ex. Russia), 21%
33,512 Units
* Total volumes includes sales from Chery Jaguar Land Rover – 1,859 units
-18 -
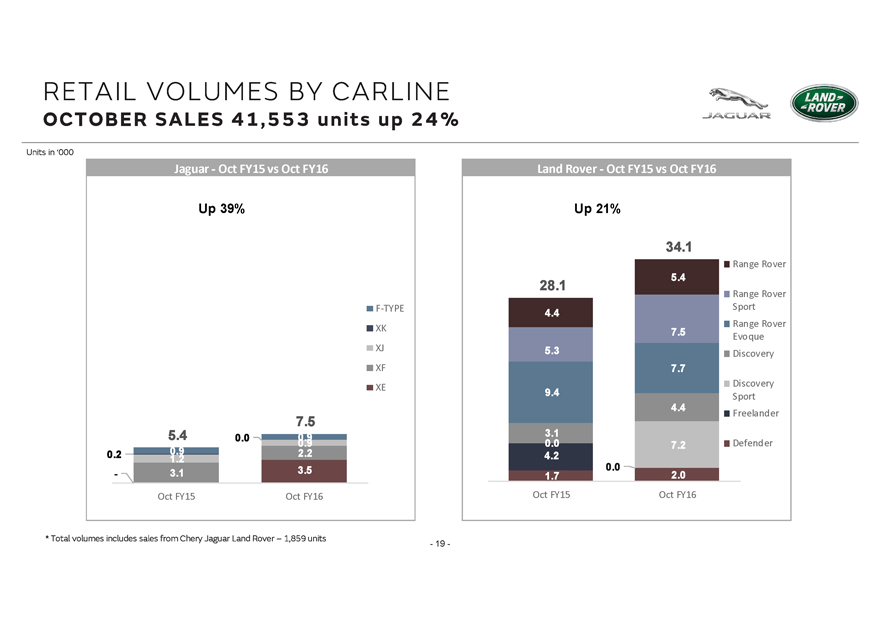
RETAIL VOLUMES BY CARLINE
OCTOBER SALES 41,553 units up 24% JAGUAR LAND ROVER
Units in ‘000
Jaguar - Oct FY15 vs Oct FY16
Up 39%
F-TYPE
XK
XJ
XF
XE
0.2
-
5.4
0.9
1.2
3.1
Oct FY15
0.0
7.5
0.9
0.9
2.2
3.5
Oct FY16
Land Rover - Oct FY15 vs Oct FY16
Up 21%
28.1
4.4
5.3
9.4
3.1
0.0
4.2
1.7
Oct FY15
0.0
34.1
5.4
7.5
7.7
4.4
7.2
2.0
Oct FY16
Range Rover
Range Rover
Sport
Range Rover
Evoque
Discovery
Discovery
Sport
Freelander
Defender
* Total volumes includes sales from Chery Jaguar Land Rover – 1,859 units
-19 -
LOOKING AHEAD
NEW
PRODUCTS EXPECTED TO DRIVE GROWTH JAGUAR LAND ROVER
Jaguar Land Rover remains focused on:
Building on the successful launches of the new Discovery Sport, the new Jaguar XE, all new Jaguar XF and 16 Model Year Evoque.
Launching the 16 Model Year Jaguar XJ in Q3 FY16, the Evoque Convertible by Q4 FY16, and the Jaguar F-PACE soon after in 2016.
These new products are expected to drive profitable volume growth in 2015/16 and position the company to deliver a solid second half. Although, as previously indicated, EBITDA
margins for fiscal 2015/16 are expected to be lower than the high levels in 2014/15 reflecting model mix and launch costs associated with new products, launch and reporting effects of the China JV and more mixed economic conditions particularly in
China.
JLR plans to continue to execute its successful growth strategy, investing in more new products, powertrains, technologies and manufacturing capacity in the
UK and overseas.
Generating strong operating cash flow to support our continuing investment in the Business estimated at £3.5bn or more in FY16.
- 20 -

JAGUAR LAND ROVER
Q&A
KENNETH GREGOR
CFO, JAGUAR LAND ROVER
- 21 -
JAGUAR LAND ROVER
Thank
You
Kenneth Gregor
CFO, Jaguar Land Rover
C. Ramakrishnan
Group CFO, Tata Motors
Bennett Birgbauer
Treasurer, Jaguar Land Rover
Jaguar Land Rover Investor Relations
investor@jaguarlandrover.com
Tata Motors Investor Relations
Ir_tml@tatamotors.com
Jaguar Land Rover
Abbey Road, Whitley, Coventry
CV3 4LF
Jaguarlandrover.com
- 22 -
JAGUAR LAND ROVER
ADDITIONAL SLIDES
- 23 -

PRODUCT AND OTHER INVESTMENT
CAPITAL EXPENDITURE TO GROW THE BUSINESS JAGUAR LAND ROVER
Quarter ended 30 September
6 months ended 30 September
(£ millions, unless stated)
2015 2014 Change
2015 2014 Change
R&D expense
Capitalised 306 274 32 621 547 74
Expensed 75 62 13 139 115 24
Total R&D expense 381 336 45 760 662 98
Investment in tangible and other intangible assets
394 427 (33) 791 783 8
Total product and other investment
775 763 12 1,551 1,445 106
Capital investment as % of revenue
16% 16% 0.2 ppt 16% 14% 1.6 ppt
Of which capitalised
700 701 (1) 1,412 1,330 82
- 24 -
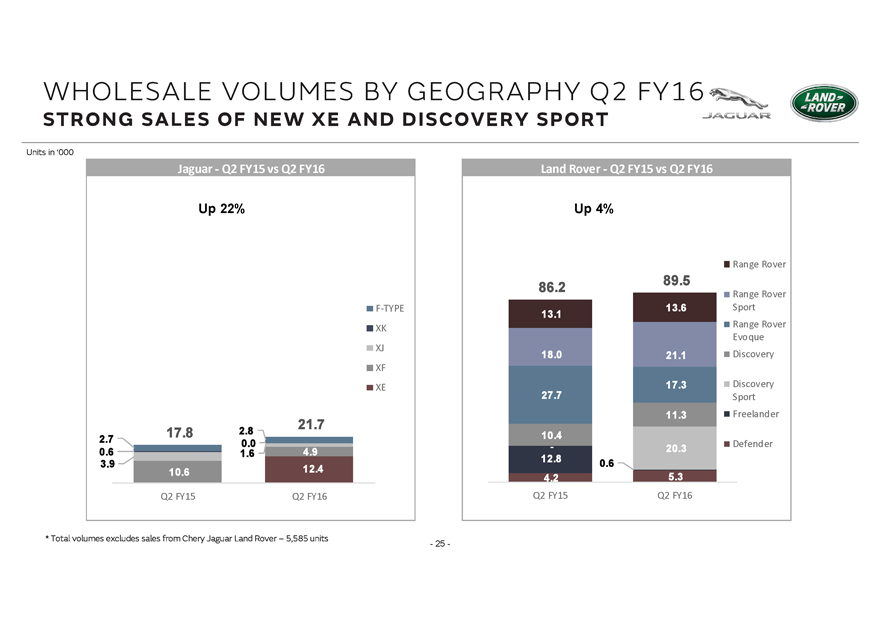
WHOLESALE VOLUMES BY GEOGRAPHY Q2 FY16
STRONG SALES OF NEW XE AND DISCOVERY SPORT JAGUAR LAND ROVER
Units in ‘000
Jaguar - Q2 FY15 vs Q2 FY16
Up 22%
F-TYPE
XK
XJ
XF
XE
2.7
0.6
3.9
17.8
10.6
Q2 FY15
2.8
0.0
1.6
21.7
4.9
12.4
Q2 FY16
Land Rover - Q2 FY15 vs Q2 FY16
Up 4%
86.2
13.1
18.0
27.7
10.4
-
12.8
4.2
Q2 FY15
0.6
89.5
13.6
21.1
17.3
11.3
20.3
5.3
Q2 FY16
Range Rover
Range Rover Sport
Range Rover Evoque
Discovery
Discovery Sport
Freelander
Defender
* Total volumes excludes sales from Chery Jaguar Land Rover – 5,585 units
- 25 -
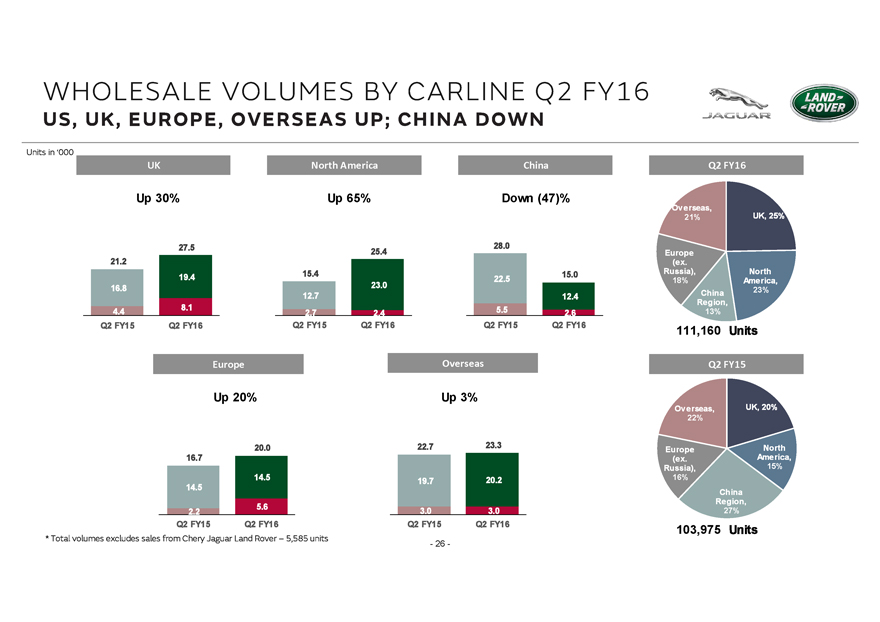
WHOLESALE VOLUMES BY CARLINE Q2 FY16
US, UK, EUROPE, OVERSEAS UP; CHINA DOWN JAGUAR LAND ROVER
Units in ‘000
UK Up 30%
21.2 16.8 4.4
Q2 FY15
27.5 19.4 8.1
Q2 FY16
North America Up 65%
15.4 12.7 2.7
Q2 FY15
25.4 23.0 2.4
Q2 FY16
China Down (47)%
28.0 22.5 5.5
Q2 FY15
15.0 12.4 2.6
Q2 FY16
Q2 FY16
Overseas, 21%
UK, 25%
North America, 23%
China Region, 13%
Europe (ex. Russia), 18%
111,160 Units
Europe Up 20%
16.7 14.5 2.2
Q2 FY15
20.0 14.5 5.6
Q2 FY16
Overseas
Up 3%
22.7 19.7 3.0
Q2 FY15
23.3 20.2 3.0
Q2 FY16
Q2 FY15
UK, 20%
North America, 15%
China Region, 27%
Overseas, 22%
Europe (ex. Russia), 16%
103,975 Units
* Total volumes excludes sales from Chery Jaguar Land Rover – 5,585 units
- 26 -
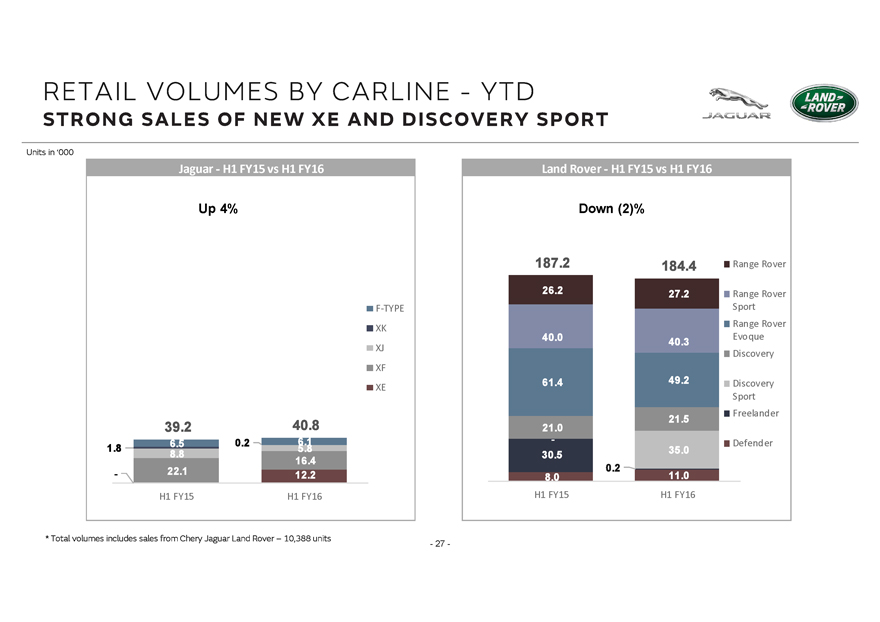
RETAIL VOLUMES BY CARLINE - YTD
STRONG SALES OF NEW XE AND DISCOVERY SPORT JAGUAR LAND ROVER
Units in ‘000
Jaguar - H1 FY15 vs H1 FY16
Up 4%
F-TYPE
XK
XJ
XF
XE
1.8
39.2
6.5
8.8
22.1
H1 FY15
0.2
40.8
6.1
5.8
16.4
12.2
H1 FY16
Land Rover - H1 FY15 vs H1 FY16
Down (2)%
187.2
26.2
40.0
61.4
21.0
-
30.5
8.0
H1 FY15
0.2
184.4
27.2
40.3
49.2
21.5
35.0
11.0
H1 FY16
Range Rover
Range Rover Sport
Range Rover Evoque
Discovery
Discovery Sport
Freelander
Defender
* Total volumes includes sales from Chery Jaguar Land Rover – 10,388 units
- 27 -
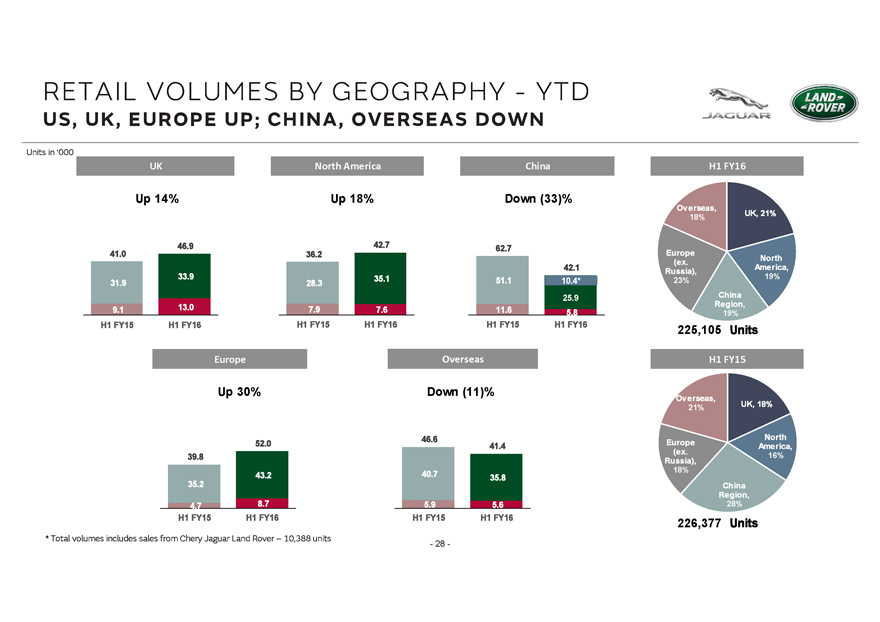
RETAIL VOLUMES BY GEOGRAPHY – YTD
US, UK, EUROPE UP; CHINA, OVERSEAS DOWN JAGUAR LAND ROVER
Units in ‘000
UK Up 14%
41.0 31.9 9.1
H1 FY15
46.9 33.9 13.0
H1 FY16
North America
Up 18%
36.2 28.3 7.9
H1 FY15
42.7 35.1 7.6
H1 FY16
China
Down (33)%
62.7 51.1 11.6
H1 FY15
42.1 10.4* 25.9 5.8
H1 FY16
H1 FY16
Overseas, 18%
UK, 21%
North America, 19%
China Region, 19%
Europe (ex. Russia), 23%
225,105 Units
Europe
Up 30%
39.8 35.2 4.7
H1 FY15
52.0 43.2 8.7
H1 FY16
Overseas
Down (11)%
46.6 40.7 5.9
H1 FY15
41.4 35.8 5.6
H1 FY16
H1 FY15
Overseas, 21%
UK, 18%
North America, 16%
China Region, 28%
Europe (ex. Russia), 18%
226,377 Units
* Total volumes includes sales from Chery Jaguar Land Rover – 10,388 units
- 28 -
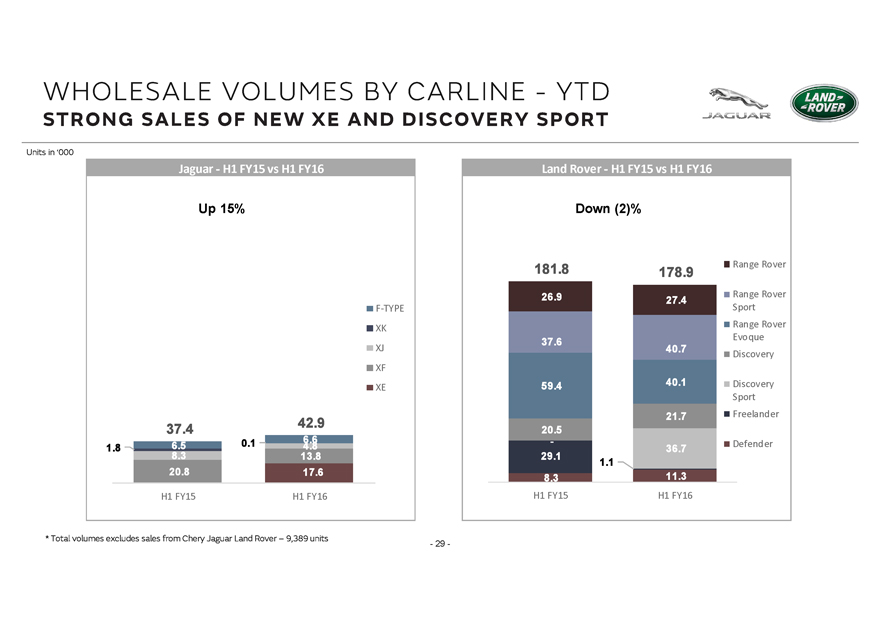
WHOLESALE VOLUMES BY CARLINE – YTD
STRONG SALES OF NEW XE AND DISCOVERY SPORT JAGUAR LAND ROVER
Units in ‘000
Jaguar - H1 FY15 vs H1 FY16
Up 15%
F-TYPE
XK
XJ
XF
XE
1.8
37.4
6.5
8.3
20.8
H1 FY15
0.1
42.9
6.6
4.8
13.8
17.6
H1 FY16
Land Rover - H1 FY15 vs H1 FY16
Down (2)%
181.8
26.9
37.6
59.4
20.5
-
29.1
8.3
H1 FY15
1.1
178.9
27.4
40.7
40.1
21.7
36.7
11.3
H1 FY16
Range Rover
Range Rover Sport
Range Rover Evoque
Discovery
Discovery Sport
Freelander
Defender
* Total volumes excludes sales from Chery Jaguar Land Rover – 9,389 units
- 29 -
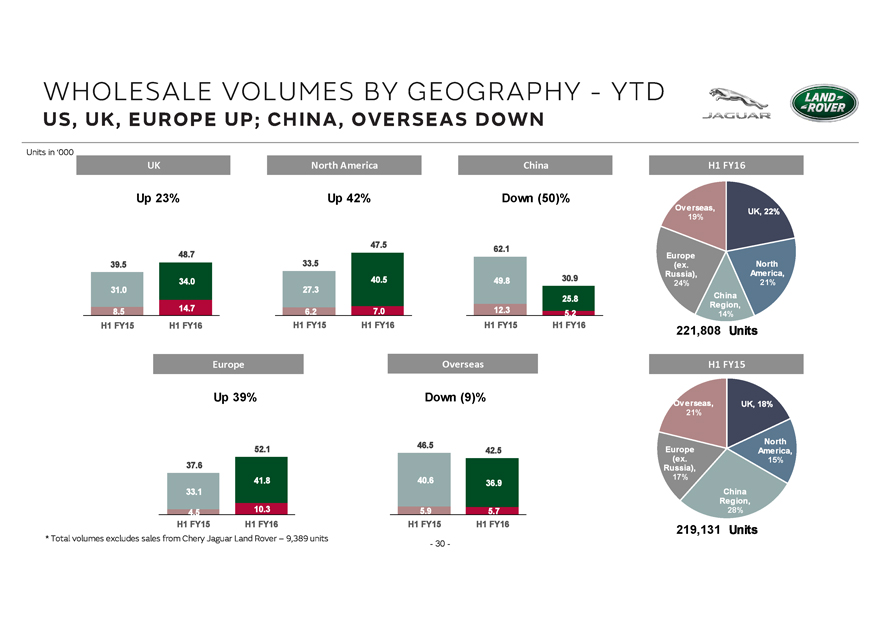
WHOLESALE VOLUMES BY GEOGRAPHY – YTD
US, UK, EUROPE UP; CHINA, OVERSEAS DOWN JAGUAR LAND ROVER
Units in ‘000
UK Up 23%
39.5 31.0 8.5
H1 FY15
48.7 34.0 14.7
H1 FY16
North America Up 42%
33.5 27.3 6.2
H1 FY15
47.5 40.5 7.0
H1 FY16
China Down (50)%
62.1 49.8 12.3
H1 FY15
30.9 25.8 5.2
H1 FY16
H1 FY16
Overseas, 19%
UK, 22%
North America, 21%
China Region, 14%
Europe (ex. Russia), 24%
221,808 Units
Europe Up 39%
37.6 33.1 4.5
H1 FY15
52.1 41.8 10.3
H1 FY16
Overseas Down (9)%
46.5 40.6 5.9
H1 FY15
42.5 36.9 5.7
H1 FY16
H1 FY15
Overseas, 21%
UK, 18%
North America, 15%
China Region, 28%
Europe (ex. Russia), 17%
219,131 Units
* Total volumes excludes sales from Chery Jaguar Land Rover – 9,389 units
- 30 -
Tata Motors (NYSE:TTM)
Historical Stock Chart
From Mar 2024 to Apr 2024

Tata Motors (NYSE:TTM)
Historical Stock Chart
From Apr 2023 to Apr 2024
