Premier Energy and Water Trust PLC announces that at close of business on 31
January 2015 its ten largest investments were as follows:

                                                            % of total assets

OPG Power Ventures                                                        8.8

China Power Intl. Develop                                                 5.8

Renewable Energy Generation                                               5.6

Huaneng Power International                                               4.7

Fortune Oil                                                               3.4

Ecofin Water & Power Conv 6.00%                                           3.3

GDF Suez                                                                  3.2

China Everbright Intl                                                     3.1

Enersis                                                                     3

SSE                                                                         3


At close of business on 31 January 2015 the total net assets of Premier Energy
and Water Trust PLC amounted to £80.3million.The sector breakdown and geographical
allocation were as follows:

Sector Breakdown:

Electricity                                                             53.1%

Multi Utilities                                                         20.9%

Water & Waste                                                            5.5%

Gas                                                                      6.7%

Cash/Net Current Assets                                                  1.3%

Renewable Energy                                                        12.5%

Total                                                                  100.0%


Geographical Allocation:

Europe (excluding UK)                                                    5.9%

China                                                                   24.6%

North America                                                           12.7%

Global                                                                   6.5%

Asia (excluding China)                                                  16.9%

United Kingdom                                                          15.0%

Latin America                                                            7.9%

Cash/Net Current Assets                                                  1.3%

Australasia                                                              1.2%

Eastern Europe                                                           5.0%

Middle East                                                              3.0%

Copyright ry 9 PR Newswire

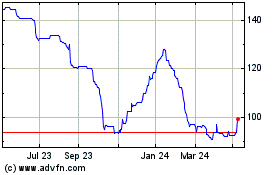
Premier Miton Global Ren... (LSE:PMGR)
Historical Stock Chart
From Mar 2024 to Apr 2024 Click Here for more Premier Miton Global Ren... Charts.
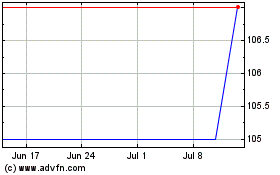
Premier Miton Global Ren... (LSE:PMGR)
Historical Stock Chart
From Apr 2023 to Apr 2024 Click Here for more Premier Miton Global Ren... Charts.