Exxon Profit and Revenue Slide Again
July 29 2016 - 9:10AM
Dow Jones News
Exxon Mobil Corp. said its quarterly profit dropped 60% and its
top and bottom lines came in worse than expected as the oil giant
remains racked by low energy prices.
Shares slipped 2.7% premarket to $87.80 as the company reported
its seventh straight quarter of year-over-year profit declines and
its eighth straight quarter of falling revenue, according to
FactSet data.
Chief Executive Rex Tillerson said the results "reflect a
volatile industry environment" and that the company "remains
focused on business fundamentals, cost discipline and advancing
selective new investments."
For the June quarter, Exxon, the largest U.S. oil company,
reported a profit of $1.7 billion, or 41 cents a share, down from
$4.19 billion, or $1 a share, a year earlier. Analysts polled by
Thomson Reuters were looking for 64 cents a share.
Revenue dropped 22% to $57.69 billion, below analysts' forecast
for $60.64 billion.
Profit in the exploration and production, or upstream, business
fell $1.7 billion to $294 million. In the U.S., the upstream
division widened its loss to $514 million from $47 million a year
earlier.
Exxon also was hurt by declining profit in the downstream
division, which had previously been a boon amid lower prices for
oil and gas. In the latest quarter, refining and marketing, or
downstream, earnings were $825 million, $681 million lower than in
the year-earlier period. Exxon said weaker margins decreased
earnings by $850 million while volume and mix effects increased
earnings by $130 million.
Exxon slashed its capital and explorations spending 38% from a
year ago $5.16 billion.
Oil companies around the world have been battered by a price
crash that has left crude and natural gas stubbornly low. Producing
countries such as Saudi Arabia and major international oil
companies like Chevron have all continued to pump more fuel in the
face of the crisis—a standoff that shows no signs of abating.
Write to Anne Steele at Anne.Steele@wsj.com
(END) Dow Jones Newswires
July 29, 2016 08:55 ET (12:55 GMT)
Copyright (c) 2016 Dow Jones & Company, Inc.
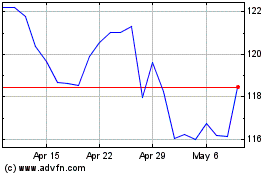
Exxon Mobil (NYSE:XOM)
Historical Stock Chart
From Mar 2024 to Apr 2024

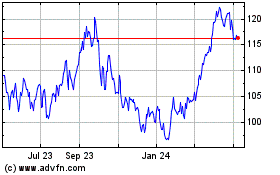
Exxon Mobil (NYSE:XOM)
Historical Stock Chart
From Apr 2023 to Apr 2024
