THIRD QUARTER HIGHLIGHTS
- Reported sales and sales adjusted for comparable
units and currency decreased by -14% YoY, mainly driven by segment
Networks where reported sales declined by -19%.
- The negative industry trends from the first half
of 2016 have further accelerated. The main reason is weaker demand
for mobile broadband, especially in markets with a weak
macro-economic environment.
- Gross margin declined to 28.3% (33.9%) YoY
following lower mobile broadband capacity sales, a higher share of
services sales and lower sales in segment Networks.
- Operating margin decreased to 0.7% (8.6%) YoY,
due to lower gross margin and lower sales, partly offset by lower
operating expenses.
- The current industry trends indicate a somewhat
weaker than normal seasonal sales growth between the third and
fourth quarters. In addition, a renewed managed services contract
in North America, with reduced scope, will impact sales negatively.
Current business mix of coverage and capacity sales in mobile
broadband is anticipated to prevail in the short term.
- The cost and efficiency program is tracking
towards target. Further short-term actions, mainly to reduce cost
of sales, are being implemented in order to adapt operations to
weaker mobile broadband demand.
- Cash flow from operating activities was SEK -2.3
(1.6) b. Operational and structural actions are being taken to
improve cash flow in the short and long term.
| SEK b. |
Q3
2016 |
Q3
2015 |
YoY
change |
Q2
2016 |
QoQ
change |
9 months 2016 |
9 months 2015 |
| Net sales |
51.1 |
59.2 |
-14% |
54.1 |
-6% |
157.4 |
173.4 |
| Sales growth adj. for comparable
units and currency |
- |
- |
-14% |
- |
-9% |
-8% |
-7% |
| Gross margin |
28.3% |
33.9% |
- |
32.3% |
- |
31.4% |
34.1% |
| Gross margin excluding
restructuring charges |
29.4% |
34.5% |
- |
33.2% |
- |
32.2% |
35.3% |
| Operating income |
0.3 |
5.1 |
-93% |
2.8 |
-88% |
6.6 |
10.8 |
| Operating income excluding
restructuring charges |
1.6 |
6.1 |
-73% |
3.8 |
-58% |
9.5 |
15.1 |
| Operating margin |
0.7% |
8.6% |
- |
5.1% |
- |
4.2% |
6.2% |
| Operating margin excluding
restructuring charges |
3.1% |
10.2% |
- |
7.0% |
- |
6.0% |
8.7% |
| Net income |
-0.2 |
3.1 |
-106% |
1.6 |
-111% |
3.5 |
6.7 |
| EPS diluted, SEK |
-0.07 |
0.94 |
-107% |
0.48 |
-115% |
1.01 |
1.98 |
| EPS (Non-IFRS), SEK 1) |
0.34 |
1.34 |
-75% |
0.83 |
-59% |
2.04 |
3.56 |
| Cash flow from operating activities |
-2.3 |
1.6 |
-249% |
-0.7 |
225% |
-5.4 |
-1.3 |
| Net cash, end of period 2) |
16.3 |
25.8 |
-37% |
21.0 |
-22% |
16.3 |
25.8 |
1) EPS, diluted, excl.
amortizations and write-downs of acquired intangible assets, and
excluding restructuring charges.
2) The definition of Net cash was changed in Q1 2016 and now
excludes post-employment benefits, see accounting policies. |
|
|
|
|
|
Non-IFRS financial measures are reconciled to the
most directly reconcilable line items in the financial statements
at the end of this report.
Comments from Jan Frykhammar,
President and CEO of Ericsson (NASDAQ:ERIC)
The negative industry trends from the first half
of 2016 have further accelerated, impacting Q3 sales, primarily
relating to mobile broadband. The decline, in both mobile broadband
coverage and capacity sales, was particularly strong in markets
with a weak macro-economic environment. In addition, capacity sales
in Europe were lower than a year ago. Gross margin declined YoY,
following lower mobile broadband capacity sales, a higher share of
services sales and lower sales in segment Networks.
Business
In the first half of 2016, a number of important
markets, in regions such as Latin America, Middle East and
Sub-Saharan Africa, were impacted by a weak macro-economic
environment. This negative development accelerated in the third
quarter and had a negative effect on both mobile broadband coverage
and capacity sales in these markets. In addition, capacity sales in
Europe were lower than a year ago. Combined, this led to a
significant deviation from what the company expected and
communicated in conjunction with the Q2 report, and resulted in
early announcement of preliminary sales and margins for the third
quarter on October 12, 2016.
Both reported sales and sales adjusted for
comparable units and currency declined by -14% YoY and sales were
particularly weak at the end of the quarter. This shows an
acceleration of the negative sales trends compared with the second
quarter when the decline in sales, adjusted for comparable units
and currency, was -7% YoY. The decline was driven by segment
Networks where the reported sales decline worsened from -14% in Q2
to -19% in Q3.
As anticipated, sales in North America declined,
mainly due to lower sales in Professional Services. In addition,
one customer continued to reduce their investments in mobile
broadband. Sales in Mainland China declined by -7% YoY mainly due
to lower 3G sales, while 4G deployments continued on a high
level. In India the delayed spectrum auctions led to another
slow quarter. The transition from 3G to 4G continued to contribute
to sales growth in region South East Asia and Oceania.
Sales in the targeted growth areas showed
resilience and grew by 3% YoY, driven by Cloud, IP and services
related to OSS and BSS. In total, the targeted growth areas now
account for 21% of group sales. The strategic partnership with
Cisco has to date generated more than 60 deals.
The current industry trends indicate a somewhat
weaker than normal seasonal sales growth between the third and
fourth quarters. In addition a renewed managed services contract in
North America, with reduced scope, will impact sales negatively.
The current business mix of coverage and capacity sales in mobile
broadband is anticipated to prevail in the short term.
Profitability
Operating income declined to SEK 0.3 (5.1) b.
following lower sales in segment Networks and a lower gross margin.
The positive effect of the cost and efficiency program did not
offset the sharp decline in gross income.
Gross margin declined to 28% (34%) following lower
mobile broadband capacity sales, a higher share of services sales
and lower sales in segment Networks.
IPR licensing revenues declined YoY and declined
slightly QoQ. The IPR revenues in the quarter represent the current
licensing contract portfolio.
Cost reductions to secure
resilience and competitiveness
The cost and efficiency program was first
initiated in November 2014 and then expanded in the second quarter
of 2016. We are taking action in all dimensions of the program.
Actions in the quarter included headcount reduction activities
which were announced and initiated in Sweden, the US, Finland,
Spain and the UK. We are tracking towards our target to reduce the
annual run rate of operating expenses, excluding restructuring
charges, to SEK 53 b. in the second half of
2017.
We will implement further short-term actions
mainly to reduce cost of sales, in order to adapt our operations to
weaker mobile broadband demand.
Cash flow
Cash flow from operating activities was SEK -2.3
b. in the quarter, mainly due to lower trade payables following
lower demand. As cash flow is volatile between quarters it should
be viewed on a full-year basis. We are taking operational and
structural actions to improve cash flow both in the short and long
term. Net cash at the end of quarter was SEK 16.3 b.
Strategy execution
Ericsson is in the middle of a significant company
transformation. In addition, the rapid technology development,
different and new customer requirements, as well as the convergence
of IT, Media and Telecom, are posing both challenges and
opportunities. Focus is on speed and fine-tuning of execution,
supported by the new company structure which is designed for
efficiency and effectiveness.
In short, the strategy builds on three key
elements; efficiency and scale of our core business, investments in
new revenue base and strong cash flow generation. Combined this
will enable us to secure leadership also in the emerging broader 5G
market - from technology to new business models and services -
enabling us to be a strong business partner to existing and new
customers.
NOTES TO EDITORS
You find the complete report with tables in the
attached PDF or by following this link
https://www.ericsson.com/res/investors/docs/q-reports/2016/09month16-en.pdf
or on www.ericsson.com/investors
Ericsson invites media, investors and analysts to
a briefing at the Ericsson Studio, Grönlandsgatan 8, Stockholm, at
09.00 (CET), October 21, 2016.
A conference call for analysts, investors and media will begin at
14.00 (CET).
Live webcast of the briefing and conference call
details, as well as supporting slides, will be available at
www.ericsson.com/press and www.ericsson.com/investors
FOR FURTHER INFORMATION, PLEASE CONTACT
Contact person
Peter Nyquist, Head of Investor
Relations
Phone: +46 10 714 64 49
E-mail: peter.nyquist@ericsson.com
Additional contacts
Helena Norrman, Senior Vice President, Marketing
and Communications
Phone: +46 10 719 34 72
E-mail: media.relations@ericsson.com
Investors
Åsa Konnbjer, Director, Investor
Relations
Phone: +46 10 713 39 28
E-mail: asa.konnbjer@ericsson.com
Stefan Jelvin, Director, Investor
Relations
Phone: +46 10 714 20 39
E-mail: stefan.jelvin@ericsson.com
Rikard Tunedal, Director, Investor
Relations
Phone: +46 10 714 54 00
E-mail: rikard.tunedal@ericsson.com
Media
Ola Rembe, Vice President, Head of External
Communications
Phone: +46 10 719 97 27
E-mail: media.relations@ericsson.com
Corporate Communications
Phone: +46 10 719 69 92
E-mail: media.relations@ericsson.com
This information is information that
Telefonaktiebolaget LM Ericsson is obliged to make public pursuant
to the EU Market Abuse Regulation. The information was submitted
for publication, through the agency of the contact person set out
above, at 07:30 CET on October 21, 2016.
Ericsson third quarter report
2016
This
announcement is distributed by Nasdaq Corporate Solutions on behalf
of Nasdaq Corporate Solutions clients.
The issuer of this announcement warrants that they are solely
responsible for the content, accuracy and originality of the
information contained therein.
Source: Ericsson via Globenewswire
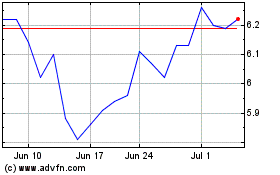
Ericsson (NASDAQ:ERIC)
Historical Stock Chart
From Mar 2024 to Apr 2024

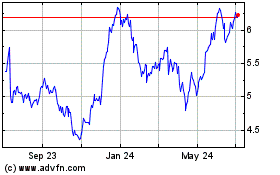
Ericsson (NASDAQ:ERIC)
Historical Stock Chart
From Apr 2023 to Apr 2024
