Eni S.p.A. 2Q 2016 -- Forecast
July 26 2016 - 10:23AM
Dow Jones News
FRANKFURT--The following is a summary of analysts' forecasts for
Eni S.p.A. (ENI.MI) second-quarter results, based on a poll of nine
analysts conducted by Dow Jones Newswires. Figures in million
euros, EPS, dividend and target price in euro, output in thousand
barrel of oil equivalent (kboe/d), according to IFRS). Earnings
figures are scheduled to be released July 29.
===
              Operating     Net
2nd Quarter      profit  profit      EPS Output
AVERAGE             371      19    -0.03  1,702
Prev. Year          762     139     0.04  1,754
+/- in %            -51     -86       --   -3.0
Prev. Quarter        73    -479    -0.22  1,754
+/- in %           +409      --       --   -3.0

MEDIAN              440      69    -0.01  1,698
Maximum             608     331     0.05  1,762
Minimum             116    -484    -0.22  1,668
Amount                8       9        6      7

Banca Akros         116    -484    -0.22  1,720
Deutsche Bank        --     331       --     --
Fidentiis Equities  439      26     0.01  1,699
Jefferies           246     -77    -0.02  1,668
Kepler Cheuvreux    475     117       --  1,698
Morgan Stanley      462     167     0.05  1,762
Oddo Securities     184      69       --     --
Santander           440     113     0.03  1,680
Societe Generale    608     -89    -0.02  1,686

            Target price  Rating               DPS 2016
AVERAGE            16.65  positive 3   AVERAGE     0.80
Prev. Quarter      14.53  neutral  1   Prev. Year  0.80
+/- in %             +14  negative 1   +/- in %      +0

MEDIAN             16.55               MEDIAN      0.80
Maximum            18.00               Maximum     0.80
Minimum            15.50               Minimum     0.80
Amount                 4               Amount         3

Banca Akros        18.00  Buy                      0.80
Kepler Cheuvreux   16.00  Buy                      0.80
Morgan Stanley        --  Underweight                --
Santander          17.10  Buy                        --
Societe Generale   15.50  Hold                     0.80
===
Year-earlier figures are as adjusted by the company - continued
operations.
DJG/mus
(END) Dow Jones Newswires
July 26, 2016 10:08 ET (14:08 GMT)
Copyright (c) 2016 Dow Jones & Company, Inc.
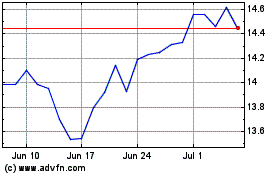
Eni (BIT:ENI)
Historical Stock Chart
From Mar 2024 to Apr 2024

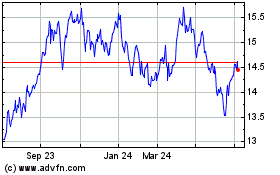
Eni (BIT:ENI)
Historical Stock Chart
From Apr 2023 to Apr 2024
