Following the holiday weekend, investors came back to Wall
Street in a buying mood and managed to push the S&P 500 Index
to fresh highs yet again, with the benchmark settling just below
2,080 ahead of Friday’s employment report. On the data release
front, better-than-expected ISM and motor vehicle sales served
as tailwinds throughout the week. Overseas, investors were a bit
disappointed with the ECB pushing off any potential stimulus
announcements into next year, while last week’s OPEC decision to
refrain from cutting down supply continued to take its toll on
energy-related assets [see also Low Carbon ETF, China Commercial
Paper Fund, "Switch" ETN Debut].
To help investors keep up with markets, we present our ETF
Scorecard, which takes a step back and looks at how various asset
classes across the globe are performing. For most of the return
comparisons below, we reference trailing 1-week and trailing
1-month returns; this offers a good insight into the prevailing
sentiment in the markets by capturing the performances across
short-term and longer-term time intervals [for more ETF news and
analysis subscribe to our free newsletter].
Risk Appetite Review
The bulls’ risk appetite declined for a second week in a row,
and this time Low Volatility names settled in green while High Beta
stocks couldn’t hold onto gains over the trailing week:
google.load('visualization', '1', {packages: ['corechart']});
function drawVisualization() { // Create and populate the data
table. var data = google.visualization.arrayToDataTable([
['Ticker', '5-Day Return', {role: 'style'}], ['S&P 500 (SPY)',
0.01, 'blue'], ['Equal Weight (RSP)', -0.1, 'orange'], ['High Beta
(SPHB)', -0.89, 'red'], ['Low Volatility (SPLV)', 0.78, 'green'],
]); var formatter = new google.visualization.NumberFormat( {suffix:
"%"}); formatter.format(data,1); // Create and draw the
visualization. new
google.visualization.BarChart(document.getElementById('visualization105384')).
draw(data, {title:"Comparing Risk Preferences", width:700,
height:400, vAxis: {title: ""}, hAxis: {title: ""}} ); }
google.setOnLoadCallback(drawVisualization); Major Index Review
Emerging markets turned in the worst performance for
the week, while the Nasdaq-100 replaced the Dow 30
as the top performer over the trailing month:
// // Domestic Sector Review
Utilities and Health Care took on defensive appeal and turned in
the best performances for the week, while the OPEC decision
sent the Energy sector plunging lower in just a matter of days:
// // Foreign Equity Review
On the international front, Brazil and Russia posted steep
losses, largely due to weakness in the energy market, while China
turned in the strongest returns for the week:
google.load('visualization', '1', {packages: ['corechart']});
function drawVisualization() { // Create and populate the data
table. var data = google.visualization.arrayToDataTable([ ['Index',
'1-Week Return', '1-Month Return'], ['Brazil (EWZ)', -9.53, -3.1],
['Russia (RSX)', -9.86, -9.11], ['India (EPI)', 0.73, 0.95],
['China (FXI)', 1.42, 5.49], ['Japan (EWJ)', 0.69, 1.12],
['Australia (EWA)', -2.53, -4.66], ['Germany (EWG)', -1.38, 5.36],
['United Kingdom (EWU)', -1.6, 1.01], ]); var formatter = new
google.visualization.NumberFormat( {suffix: "%"});
formatter.format(data,1); formatter.format(data,2); var options = {
title:"", width:700, height:400, title: "Geographic Review:
Comparing Single Countries", colors: ["green", "orange"] }; //
Create and draw the visualization. new
google.visualization.ColumnChart(document.getElementById('visualization105395')).
draw(data, options); } google.setOnLoadCallback(drawVisualization);
Alternatives Review
Commodities
Natural gas and crude oil were the biggest losers over the past
week as well as the trailing month, while gold and silver have
settled into positive territory over the trailing month:
// //
Currencies
On the currency front, the U.S. dollar continued its ascent
higher, sending virtually all other currencies lower for the
week:
// //
*All data as of market close 12/4/2014.
Follow me on Twitter @Sbojinov.
[For more ETF analysis, make sure to sign up for our free ETF
newsletter]
Disclosure: No positions at time of writing.
Click here to read the original article on ETFdb.com.
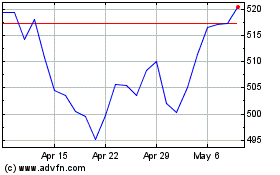
SPDR S&P 500 (AMEX:SPY)
Historical Stock Chart
From Mar 2024 to Apr 2024

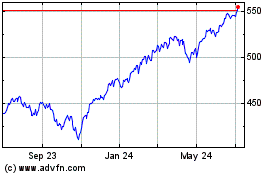
SPDR S&P 500 (AMEX:SPY)
Historical Stock Chart
From Apr 2023 to Apr 2024
