Domino's Pizza Group plc (the "Company") is a public limited
company incorporated in the United Kingdom under the Companies Acts
(registration number 03853545). The Company is domiciled in the
United Kingdom and its registered address is Domino's Pizza Group
plc, 1 Thornbury, West Ashland, Milton Keynes, MK6 4BB. The
Company's ordinary shares are traded on the London Stock Exchange.
Further copies of the Interim Report and Annual Report and Accounts
may be obtained from the address above.
2. BASIS OF PREPARATION
This interim report has been prepared in accordance with IAS 34
'Interim Financial Reporting'. The financial information contained
in this interim report does not constitute statutory accounts as
defined by Section 435 of the Companies Act 2006.
The interim results for the 26 weeks ended 28 June 2015 and the
comparatives to 29 June 2014 are unaudited, but have been reviewed
by the auditors. A copy of their review report has been included at
the end of this report.
The financial information for the 52 weeks ended 28 December
2014 has been extracted from the Group financial statements for
that period. These published financial statements were reported on
by the auditors without qualification or an emphasis of matter
reference and did not include a statement under section 498(2) or
(3) of the Companies Act 2006 and have been delivered to the
Registrar of Companies.
In the Group's 2014 Annual Report sales and cost of sales for
the 52 weeks ended 29 December 2013 were re-presented for the
Switzerland segment to more accurately present the classification
of internal sales. The corresponding re-presentation for the 26
weeks ended 29 June 2014 has resulted in an adjustment between
revenue and cost of sales for GBP1,164,000 and does not have a
profit impact on either the operating results of the segment or the
Group as a whole (see note 4).
As at 29 June 2014 quarterly rent in advance received from
franchisees of GBP4,297,000 (28 December 2014: GBP4,548,000) has
been reclassified within current deferred income to better
represent the nature of the liability, having previously been
disclosed as part of trade and other payables.
As at 29 June 2014 some credit balances in respect of rent-free
periods received from landlords and payable to franchisees have
been restated resulting in an increase of GBP876,000 (28 December
2014: GBP1,039,000) in non-current deferred income and GBP198,000
(28 December 2014: GBP247,000) in current deferred income;
previously GBP876,000 (28 December 2014: GBP1,039,000) of these
amounts were netting within non-current trade and other receivables
and GBP198,000 (28 December 2014: GBP247,000) in current trade and
other receivables. These adjustments had no effect on the income
statement of the respective periods.
The interim financial information has been prepared on the going
concern basis. This is considered appropriate, given the
considerable financial resources of the Group including the current
position of the banking facilities, together with long-term
contracts with its master franchisor, its franchisees and its key
suppliers.
The interim financial information is presented in sterling and
all values are rounded to the nearest thousand pounds (GBP000),
except when otherwise indicated.
Changes in accounting policy
The consolidated accounts for the 52 weeks ended 28 December
2014 were prepared in accordance with IFRS as adopted by the EU.
The accounting policies applied by the Group are consistent with
those disclosed in the Group's Annual Report and Accounts for the
52 weeks ended 28 December 2014. There are no new standards and
interpretations effective for the first time in 2015 that have a
material impact on this interim report.
3. REVENUE
Revenue recognised in the income statement is analysed as
follows:
                                    (Unaudited)   (Unaudited)
                                       26 weeks      26 weeks      52 weeks
                                          ended         ended         ended
                                        28 June       29 June   28 December
                                           2015          2014          2014
                                                   (restated)
                                         GBP000        GBP000        GBP000

 Royalties, corporate store
  sales and sales to franchisees        149,506       137,226       277,305
 Rental income on leasehold
  and freehold property                   7,746         8,296        16,945
 Finance lease income                        76            62           128
                                   ------------  ------------  ------------
                                        157,328       145,584       294,378
                                   ------------  ------------  ------------


   4.   SEGMENT INFORMATION
For management purposes, the Group is organised into four
geographical business units based on the territories governed by
the Master Franchise Agreements ("MFA"): the United Kingdom,
Ireland, Germany and Switzerland. These are considered to be the
Group's operating segments as the information provided to the
Executive Directors of the Board, who are considered to be the
chief operating decision makers, is based on these territories.
Revenue included in each includes all sales (royalties, Supply
Chain Centre sales, rental income and finance lease income) made to
franchise stores and sales by corporate stores located in that
segment. Segment results for the Ireland segment include both the
Republic of Ireland and Northern Ireland as both of these
territories are served by the same Supply Chain Centre.
Management monitors the operating results of its business units
separately for the purpose of making decisions about resource
allocation and performance assessment. Segment performance is
evaluated based on operating profit or loss. Group financing
(including finance costs and finance revenue) and income taxes are
managed on a group basis and are not allocated to operating
segments.
Unallocated assets include cash and cash equivalents and
taxation assets. Unallocated liabilities include the bank revolving
facility, bank loans, deferred consideration and taxation
liabilities.
Following the representation of sales and cost of sales in the
Group's Annual Report and Accounts for the 52 weeks ended 28
December 2014 for the Switzerland segment, a representation has now
been made for the 26 weeks ended 29 June 2014 for the Switzerland
segment to more accurately present the classification of internal
sales. This has resulted in an adjustment between revenue and cost
of sales for GBP1,164,000 and does not have a profit impact on
either the operating results of the segment or the Group as a
whole.
Operating Segments
                                         (Unaudited) 26 weeks ended
                                                28 June 2015
                            Switzerland   Germany   Ireland     United     Total
                                                               Kingdom
                                 GBP000    GBP000    GBP000     GBP000    GBP000
 Segment revenue
 Sales to external
  customers                       5,541     2,852    10,495    138,440   157,328
                           ------------  --------  --------  ---------  --------
 Results
 Segment result                   (670)   (1,800)     2,618     31,096    31,244
 Non-underlying                       -         -         -          -         -
  items
 Share of profit
  of associates                       -         -         -        868       868
                           ------------  --------  --------  ---------  --------
 Group operating
  profit                          (670)   (1,800)     2,618     31,964    32,112
 Net finance costs                                                          (98)
 Profit before
  taxation                                                                32,014
                                                                        --------
 Assets
 Segment assets                   9,340     1,737     2,800    100,587   114,464
 Equity accounted
  investments                         -         -         -      7,558     7,558
 Unallocated assets                                                       37,873
 Total assets                     9,340     1,737     2,800    108,145   159,895
                           ------------  --------  --------  ---------  --------

   Liabilities
 Segment liabilities              1,699     4,744     1,224     47,622    55,289
 Unallocated liabilities                                                  18,593
                           ------------  --------  --------  ---------  --------
 Total liabilities                1,699     4,744     1,224     47,622    73,882
                           ------------  --------  --------  ---------  --------


                                     (Unaudited) 26 weeks ended
                                       29 June 2014 (restated)
                        Switzerland   Germany   Ireland     United     Total
                                                           Kingdom
                             GBP000    GBP000    GBP000     GBP000    GBP000
 Segment revenue
 Sales to external
  customers                   4,723     3,239    10,716    126,906   145,584
                       ------------  --------  --------  ---------  --------
 Results
 Segment result               (386)   (4,714)     2,502     26,940    24,342
 Non-underlying
  items                                 (208)         -      (245)     (453)
 Share of profit
  of associates                   -         -         -        389       389
                       ------------  --------  --------  ---------  --------
 Group operating
  profit                      (386)   (4,922)     2,502     27,084    24,278
 Profit on sale
  of non-current
  assets                                                                 194
 Other gains
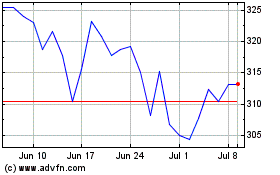
Domino's Pizza (LSE:DOM)
Historical Stock Chart
From Mar 2024 to Apr 2024

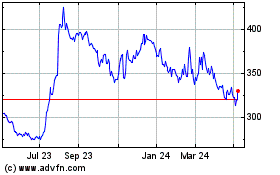
Domino's Pizza (LSE:DOM)
Historical Stock Chart
From Apr 2023 to Apr 2024
