UNITED STATES
SECURITIES AND EXCHANGE COMMISSION
Washington, D.C. 20549
FORM 8-K
CURRENT REPORT
PURSUANT TO SECTION 13 OR 15(d) OF THE
SECURITIES EXCHANGE ACT OF 1934
| Date of report (Date of earliest event reported): |
February 11, 2016 |
| |
|
Ameris Bancorp
(Exact Name of Registrant as Specified in
Charter)
| Georgia |
001-13901 |
58-1456434 |
| (State or Other |
(Commission File Number) |
(IRS Employer |
| Jurisdiction of |
|
Identification No.) |
| Incorporation) |
|
|
| 310 First Street, S.E., Moultrie, Georgia |
31768 |
| (Address of Principal Executive Offices) |
(Zip Code) |
| Registrant’s telephone number, including area code: |
(229) 890-1111 |
(Former Name or Former Address, if Changed
Since Last Report)
Check the appropriate
box below if the Form 8-K filing is intended to simultaneously satisfy the filing obligation of the registrant under any of the
following provisions (see General Instruction A.2. below):
| ¨ | Written communications pursuant to Rule 425 under the
Securities Act (17 CFR 230.425) |
| ¨ | Soliciting material pursuant to Rule 14a-12 under the
Exchange Act (17 CFR 240.14a-12) |
| ¨ | Pre-commencement communications pursuant to Rule 14d-2(b)
under the Exchange Act (17 CFR 240.14d-2(b)) |
| ¨ | Pre-commencement communications pursuant to Rule 13e-4(c)
under the Exchange Act (17 CFR 240.13e-4(c)) |
| Item 7.01 | Regulation FD Disclosure. |
On February 11, 2016, Edwin W. Hortman,
Jr., President and Chief Executive Officer of Ameris Bancorp (the “Company”), and Dennis J. Zember Jr., Executive Vice
President and Chief Financial Officer of the Company, gave a presentation to attendees at the 2016 KBW Winter Financial Services
Symposium in Boca Raton, Florida. A copy of the investor presentation materials is being furnished as an exhibit to this report
and is incorporated by reference into this Item 7.01.
| Item 9.01 | Financial Statements and Exhibits. |
| 99.1 | Investor
Presentation Materials. |
SIGNATURE
Pursuant to the requirements
of the Securities Exchange Act of 1934, as amended, the registrant has duly caused this report to be signed on its behalf by the
undersigned, hereunto duly authorized.
| |
AMERIS BANCORP |
|
| |
|
|
|
| |
|
|
|
| |
By: |
/s/ Dennis J. Zember Jr. |
|
| |
|
Dennis J. Zember Jr. |
|
| |
|
Executive Vice President and Chief Financial Officer |
|
Date: February 11, 2016
EXHIBIT INDEX
| Exhibit No. |
Exhibit |
| 99.1 |
Investor Presentation Materials |
| |
|
Exhibit 99.1

Ameris Ban c orp 4 th Quar t e r 201 5 E a r n i n g s P r ese n t a tion E d w in W . Hortman , J r . – P r eside n t & C E O Dennis J . Z e m be r , J r . – EVP & CFO

This pres entation contains certa i n p erfor ma nc e mea su res determine d b y method s ot h e r tha n i n accordanc e wi t h accounti n g p r i nc i p le s g e n erally accep t ed i n the Un i ted S tates o f Ame r ic a (“ G AAP”) . Managemen t o f Ame r i s Bancor p (the “Co m p a ny” ) use s thes e n o n- G A AP measure s i n it s a nalysi s o f the Comp an y’s perform ance . Thes e m ea s ure s are usefu l when evalu a ting the u nd erlyi n g per f or ma nc e a n d efficiency of the Co m p a ny’ s operations a n d ba la nc e sheet . T he Company’ s managemen t believe s tha t thes e no n- GA AP m e asur es pro v i de a gr ea t er un d erstand i n g of o n going operations , e nhanc e co m p arabi l it y o f r esult s wit h prior period s a n d demonstrat e th e effects o f signifi ca n t gains a n d cha r ges i n t h e cur r ent period . Th e C omp a ny’ s m a n agement be l i eves that investors m ay use t h ese non- GA AP fin a nci a l mea su res to evaluate the Comp a ny’ s fin a nc i al performan c e without th e i m pac t of u n u s u a l i tems that may obscur e tre nds i n th e C ompany’ s underl y in g perfor m ance . The s e disclosures shoul d no t be v iewe d as a substitut e fo r f inancia l measures determine d i n accordanc e wit h GAAP , n o r ar e they necessaril y comparabl e t o no n- G AAP pe r for ma nce m ea s ures that may be p r e sente d b y othe r c omp ani es . T ang ib le commo n e quit y a n d T i e r 1 capita l ratio s ar e n o n- G AAP mea s ures . Th e Co m p a ny calculate s th e Tie r 1 c a p ita l us in g cur r ent cal l report instructions . Th e Comp a ny’ s m a n agement use s these m ea su res to assess the qu a lit y o f c apital an d be l i eves that investors m ay fi n d them us ef ul i n their eval u ation o f the Comp a ny . T hes e c a pita l m ea s u r es m ay, o r 2 ma y n o t b e necessaril y comparabl e t o simila r capital measures that may be presented by other c ompanies . Thi s presentatio n ma y c ontai n statement s tha t constitute “forwar d- lo o kin g statements ” withi n th e m eanin g of Sect io n 27 A of t he S ec u r i tie s A ct of 193 3 , as a me n d e d, an d Section 2 1 E of t he S ecu r i t ies Excha n g e A ct of 193 4 , as amended . Th e word s “believe” , “estimate”, “ expect”, “ i ntend ” , “ a n tic i pate ” an d simi l ar e x p ressions a n d variations thereof i d e n t ify c ertain of such forwar d - lookin g statements, which s pea k onl y as o f the date s which the y w ere m ade . The Compan y undertake s n o obli g atio n to p ublicl y updat e or revise any forwar d- look i ng statements , whethe r as a result o f ne w information , fut u re events o r otherwise . R ea d ers ar e cautione d t h at a n y su c h forwar d- look i ng statement s a r e not guar a n tee s o f futur e perform a nc e an d i nvolve r isk s and uncertaintie s an d that actua l results ma y diffe r mater i ally fro m thos e indicate d i n th e f orwar d - l oo kin g statement s as a result o f various f actors . R eaders ar e cautione d no t to p lace und ue re lianc e o n t he s e f orwar d- look i ng statement s a n d are referre d to t h e Company’ s periodic f i l ing s wit h th e S ecurities a n d E xc ha n g e C ommis s io n f o r a s u m m a ry o f c erta i n fa cto rs tha t may i m p ac t th e Co m p a ny’s re s u lt s o f operation s and financi a l condition . Cautionary S t at eme n ts

Corpo r at e P r ofile • Headqu a r t e r e d in Moultrie, Georgia • Founde d in 197 1 as American Banking Company • H istorically grown throug h acquisit io n s of smalle r bank s in areas close to existing operations • Recently announce d acquisi tio n of Jacksonville Bancorp in Jacksonville, Florida. • Recent growth throug h acquisi tio n of Merchant s & Souther n (Gainesville, Fl ) and 1 8 branche s from Ban k of America. • F o u r state footprin t with 9 8 offices 3 3

Almost singular focus o f ou r team right no w i s to produc e the results we h ave projected. • M ai n t ain d o u ble d igit reve n u e g rowth with 12 % - 15 % growth i n l o ans, fu n de d al m o s t entirely with l o w c ost deposit s augmented b y highl y p rofitable a n d growing line s o f busines s ( Mortgage, SB A and Treasury) • E xpens e m a nagemen t aime d a t producin g l o w singl e digi t g rowth r ate s i n operatin g e xpens e s . Continued c o rporate restructure, b ranch c onsol i dation s a n d bette r d is t ri b utio n o f a dministrativ e w or k l oa d unti l w e achieve our e fficiency ratio g oals . 4 Cur r e n t F o c us Improve d and More Consisten t Operatin g Performance M& A Opportunities Stil l lookin g a t M&A opportunitie s bu t bein g highl y selective and s till sticking to ou r three criteria: • Neutral (or a lmos t n eut r al) to T BV • Accretive to o ur franchise • Meaningf u ll y a ccretive to EPS (relative to siz e o f acquisition) Not a frai d o f th e $1 0 billio n hur d l e Refine an Alread y Stron g Balance Sheet • Bu i ldin g significant di ve rsificati o n into o ur Balance s heet with focus o n a sset cl a s se s with l ower long te rm loss rates. • I nsulat e o urselve s from rate movements a n d economic swings with highl y stable, no n -rate sensitiv e deposits. • G row c apital level s and boo k value through highe r than avera g e ROAs a n d ROTCE.

4 th Quar t e r Ope r a ting R esults YTD Results • T o t al R e v e nu e c li mb e d t o $ 2 6 1 . 1 million, up 22.8% from 2014 l e v e ls. • No n - I n t e r est I n come c l i mbed t o $85.6 million, up 36% • N e t I n c o me fr om Mor tg a g e & SBA divisions i mp r oved 99 % t o $ 1 2 . 3 million . • 2015 Ope ra ti ng ROA a n d R O T CE w e r e 1 . 11% and 13 . 66%, r espec t ively. • S p r e ad in co me in c r e a s e d 17 . 1% v s. 2014 levels. • Co r e Ope ra ti ng Ex pe nses (b e fo r e m e r g er a n d c r e d i t c os t s) w e r e up $ 4 0 . 0 million or 30 % o ve r 2014 l e v e l s , du e t o $ 1 . 5 billion in t otal ass e ts from M&A . • L OB cost s up $7. 2 m illion i n 2 0 15 whil e r e v e nu e fr om LO B ’ s w e r e up $17.2 million. • C r e dit costs o f $ 2 3 . 0 m illion i n 2 0 1 5 , high e r by $ 3 .8 million b e cause o f $10 . 6mm spe c i al c h a r g e . C r ed i t co s t s of $4 . 8mm i n 2H15 compa r ed t o $11 . 0mm i n 2H14. $ 1 , 175 $ 2 , 561 Av g D i l u t e d S ha r e s 3 2 , 59 5 27 , 0 9 0 20% ( 1) - e x c lu d e s a m o u n t s s e e n b e l o w r e l a t e d to o n e t i m e c h a r g e s 32 , 127 2 6 , 259 22% O n e - t i me c h a r g e s 4 Q 1 5 4 Q 1 4 C h g 4 Q 15 4 Q 1 4 C h g M e r g e r - r e l a t e d e x p e n s e s $ 1 , 80 7 C r e d i t c h a r ge - P r o v i s i o n - C r e d i t c h a r ge - O R E O - T o t a l A f t e r t a x e ff e c t 6 7 - - 7 , 98 0 $ 3, 94 0 - - - - 1 , 80 7 6 7 7 ,9 8 0 3, 94 0 4 4 5 ,1 8 7 Q ua r t e r t o d a te r e s u l ts Y ea r to d a te r e s ul ts 5 4 Q 15 4 Q 14 C h g 4 Q 15 4 Q 1 4 C h g I n t I n c b e f o r e A c c r e t i o n $ 4 9 , 68 9 $ 40 , 6 2 0 22% $ 1 78 , 712 $ 15 2 , 023 18% Ac c r e t i o n i n c o m e 2 , 912 4 , 2 80 - 32% 11 , 681 1 2 , 543 - 7 % I n t e r e s t E x p e n s e 3 , 983 3 , 8 9 3 2% 14 , 856 1 4 , 680 1% N e t I n t e r e s t I n c o m e 4 8 , 618 41 , 0 07 19% 1 75 , 537 14 9 , 886 17% P r o v i s i o n ( 1) 553 8 8 8 - 38% 5 , 264 5, 64 8 - 7 % N o n - I n t e r e s t I n c o m e 2 2 , 407 16 , 3 62 37% 85 , 586 6 2 , 836 36% C o r e O p e x ( 1) 4 8 , 998 36 , 3 76 35% 1 73 , 428 13 3 , 423 30% C r e d i t C o s t s , r e c u rr i n g 2 , 22 3 5 , 2 9 0 - 58% 17 , 707 1 3 , 506 31% I n c o m e b e f o r e t a x e s 1 9, 25 1 14 , 8 15 30% 64 , 724 6 0 , 145 8% I n c o m e t a x e x p e n s e 3 , 928 4 , 1 9 0 - 6 % 18 , 690 1 8 , 861 - 1 % P r e f e r r e d D i v i d e n d s - - 0% - 28 6 0% O p e r a t i n g N e t I n c o m e $ 1 5 , 323 $ 10 , 6 2 5 44% $ 46 , 034 $ 4 0 , 998 12% E a r n i n gs P e r Sh a re $ 0 . 4 7 $ 0 . 3 9 20% $ 1 . 4 3 $1 . 56 - 8 % R e p o r t e d N e t I n c o m e $ 14 , 14 8 1 0 ,5 8 1 34% 40 , 8 47 3 8 , 437 6% R e p o r t e d E P S $ 0 . 4 3 $ 0. 3 9 11% $ 1. 2 7 $ 1 . 46 - 13%

R e venues – 4Q15 Spread r e ve nu e improv e d 2.7% ov er linked 3Q du e to continued d eployment of excess liquidit y (ta x equiv basis) • S ol i d loan grow t h at th e end of 4Q15 s h ou l d posit i vely impac t 1Q16. 4Q 1 5 Accretion in c ome of $2.9 million vs. $3.0 million in 3Q15 and $4.3 million in 4Q14. • Mortgage volumes impacte d b y f ourth quarte r seasonali t y. • 4 Q 1 5 mort g age p rodu c t io n t o t aled $ 254 . 2 m ill i on com p ared to $ 311 . 0 million in 3 Q 1 5 a n d $ 19 7 . 2 million i n 4 Q 14 . G ain on sale m argins steady at 353 bps in 4 Q 15 . • 4 Q Revenue Impacted b y Mortgage Seasonality • Expec t stea d y to improving s pread i ncom e despite shorter quarter . • Mort g a ge product i o n sho u ld build as s h ould the pipeline . Expec t gai n s in the fai r value o f the pip e line and p osi t ive i mpacts from lower m ortgage rates . 1 s t Quarte r Expectations $38.7 6 $47.6 $48.9 $54.6 $53.6 $53.8 $59.3 $69.7 $68.9 $20.0 $30.0 $40.0 $50.0 $60.0 $70.0 $80.0 4Q 13 1Q 14 2Q 14 3Q 14 4Q 14 1Q 15 2Q 15 3Q 15 4Q 15 T o t al Quar t erly R e v e nue (in millions)

R e venues – 2016 Drivers • Covered loan runoff over the p ast few y ears h as greatly muted the results from o u r loan production engine . • N et Loa n s ( L e g ac y l oa n s l e s s Covered L o a n s) a n d Net Loan Re v e nue s s h o u ld b enefit from faster or g ani c g rowth rates and d rastically reduced level s of covered loans . • December 2015 Pipeline is $ 415 mill i on vs . December 2 014 pipeline of $ 258 million . • P r oje cted 201 6 le v e ls a ss um e sa m e g r ow t h ra te as 2 0 1 5 at existing yields . Increased Contributi o n from Organi c Growth • Desp i te a s l ower 4Q15 than expected, m or tgag e and SBA revenues were u p 32.4%. • Ope n pipeline at end o f 20 15 w a s $ 94 m ill i o n com p ared to $57 million at end of 2014. • SB A p roduct i on in 2 01 5 was $ 6 5 mil l ion com p are d t o $ 59 m ill i o n in 20 14 . Expec t product ion t o approach $100mm i n 2016. Mortgage & SBA Run Rates $(10,682) 7 $(4,770) $(4,510) $8,252 $11,358 - $15,000 - $10,000 - $5,000 $0 $5,000 $15,000 $10,000 2012 2013 2014 2015 2016 P roj Annualized Interest Income Impact of Legacy Growth offset b y Covered Loan Runoff

Non - I n t ere s t In c om e – 4 Q 1 5 • Deposit charges u p 40 % i n 2 0 15 vs . 2 014 , result i n g f rom BoA an d M & S acquisitions . M or tgage re v enue u p 41 . 6 % m i ll i o n o r $ 1 0 . 8 m ill i o n i n 2015 . Mortgag e ne t incom e contributio n increased $ 6 . 1 m illio n o r 99 % in 2015 . M or tgage p rofita b il it y margin s m uc h h ighe r t h an industry average . Foc u se d o n relat i onship s w i t h bui l d ers , br oker s a nd R/ E a gents . SBA revenues up 12 . 0 % in 2015 . S BA net i ncome contribution up 24 . 7 % in 2015 . • • • 1 – G O S – “ g a i n o n sale” o f loans $12 .0 $10 .7 $11 .8 $15 .2 $15 .9 $14 .2 $ 2 .0 $ 1 7 . 0 1Q 14 2Q 14 3Q 14 4Q 14 1Q 15 2Q 15 3Q 15 4Q 15 Tota l Revenue from Mortgag e & SBA (i n millions) $20 .6 $25 .9 $37 .8 $46 .5 $62 .8 $85 .6 $ 0 .0 $ 3 0 . 0 $ 6 0 . 0 $ 9 0 . 0 2 0 10 2 0 11 2 0 12 2 0 13 2 0 14 2 0 15 Tota l Non -Interes t Income (in millions) 8 $ 1 4 . 0 4Q15 3Q15 4Q14 Mortgage production (000's) 245,463 311,007 197,227 Mortgage GOS ( 1 ) - retail 3.53% 3.51% 4.19% $ 1 1 . 0 Open Pipeline 94,478 105,290 57,005 $10 .3 SBA Production: 13,478 14,432 6,800 $ 8 .0 SBA sol d loans SBA GOS % 10,750 11% 8,842 11% 1,600 11% $6 .9 SBA Pipeline 43,458 40,196 18,200 $ 5 .0

Expense s – 4 Q 1 5 • E xpens e leverag e i s ou r m an a g emen t t eam’ s p rima r y focus i n 2016 . • E xpens e s ave s fro m b r anc h c l o sure s s h o u l d r e duce Opex by another $ 750 k per quarter over 4 Q run r ate . • F DI C in demn i f i cat i o n expen s e o f $ 1 . 6 mi l l io n i n 4 Q 15 a n d $ 5 . 3 mm i n Y T D 15 expected to be a p p r ox . $ 800 k in 1 Q 16 and $ 1 . 8 mm i n YTD 16 . • M&S c o n s o l i d at i o n o ccurred i n 4 Q 15 . In clu d e d approx . $ 0 . 45 mm o f expenses t ha t w i l l no t be recurring i n 1 Q 16 . • Incentiv e acc r ual s $ 1 . 3 mi l l i o n highe r tha n normal level s i n 4 Q 1 5 . E xpec t t he s e t o moderat e bac k i n 1 Q 16 . • O the r st r ategie s i n p l ac e to d riv e mean i n g f ul leverag e and profitabi l i ty i n 2016 . 1 – C o r e operatin g expenses exclude Probl e m loa n and ORE O co s t s as wel l as merge r - related char ge s Opex Leverage in 1Q1 6 and 2Q16 $25 .8 $24 .9 $27 .7 $29 .4 $30 .7 $31 .1 $38 .6 $40 .2 $4 .8 $6 .7 $7 .1 $7 .0 $7 .0 $8 .9 $8 .7 $8 .8 $0.0 $10.0 $20.0 $30.0 $50.0 Core Operating Expenses (i n millions) $40.0 1Q 14 2Q 14 3Q 14 4Q 14 1Q 15 2Q 15 3Q 15 4Q 15 B a nk Level Opex LO B Expen ses 9

Expense s – Credit R e l a t e d Co s ts • Credi t cost s down 56% in 2H 2015 compare d to 2H 2014 • Material Improvement in the Impact to ROA A and ROTCE: 1 – C r e d it co s t s includ e provisio n for loa n losses and ORE O related costs. More Reliabl e Level s o f Credi t Expenses $3.9 10 $4.2 $4.9 $8.0 $6.2 $4.2 $13.9 $2.1 $2.8 $- $4.0 $12.0 $16.0 1Q 14 2Q 14 3Q 14 4Q 14 1Q 15 2Q 15 3Q 15 4Q 15 Credit Costs, Including Provision (i n millions) Actual Actual P r ojec t ed 2014 2015 201 6 T o t al C r edit Co s ts Impact t o RO AA Impact t o R O T CE $19.15 -0.35% -4.62% $22.97 -0.31% -3.77% $10.0 0 -0.11% -1.47%

Loans – 4 Q 1 5 Tota l Loa n Growt h o f $249. 7 m illio n a gains t linke d quarte r from: • Organic G rowth during 4Q15 of $66.8 million or 8. 7 % annualized • Growth o f $ 1 8 2.9 million related to purchased whole loan mortgag e pools . Pools currentl y paying on abou t a 3.2 yr . avg . life. 1 – PN C – purchased, non- cov e r e d loans. 2 – c ombined yiel d include s transactio n fees and int e r es t earned. L o a n P roduction Details Period Fixed Rat e (2) Variable Rat e (2) Total $2.84 11 $2.84 $2.89 $3.46 $3.66 $3.91 $1.5 $2.5 $3.5 $4.5 3Q 14 4Q 14 1Q 15 2Q 15 3Q 15 4Q 15 Total Loans Oustanding (in billions) 13 . 4 % - 2015 l o an gr o w th (legacy a n d PNC) e xclu d in g a l l acq u isitions and loan p ools . Imp ro v ement f r o m 2014 level s o f 9 . 7 % . $ 64 million – a m o u nt o f runof f i n covere d l oan s (ne t of reclass to P NC) . Improveme n t from $ 12 7 millio n in 2014 . 4Q15 $ 216 . 8 4.53% $ 96.0 4.34% $ 312 . 9 4.47% 3Q15 $ 196 . 2 4.64% $ 91.1 4.50% $ 287 . 3 4.59% 2Q15 $ 233 . 9 4.49% $ 96.9 4.44% $ 330 . 8 4.48%

Loan P ort f olio - Diversified Dec -2007 Loan Mix vs . Dec -2015 Loan Mix 200 7 P o rt f olio Cha r ac t e ri s t ics • Concentrate d i n Commercia l Real Estate , 42% o f whic h was constructio n o r development. • A& D was concentrated o n the Sout h Georgia Coas t and the Florid a Panhand l e i n economies that wer e no t drive n by industry. • Mortgag e loan s wer e concentrated i n bank customers that di d no t o r coul d no t acquire secondar y market financing . • Vas t majority o f the approval authorit y rested with ou r bank president s and their regional executives. 201 5 Loan Portfolio 200 7 Loan Portfolio 201 5 P o rt f olio Cha r ac t e ri s t ics • Significantl y better diversificatio n with large r investment s i n Mortgag e and Municipal credits . Onl y 20% o f CR E i s A& D oriented. • CR E assets concentrated i n Atlanta, Jacksonville, Columbia , Savanna h and Charleston . Constructio n assets are i n hig h growth markets with large builders. • 65% o f Mortgag e assets are with secondar y type assets (65%) with ful l doc underwriting . 15% o f ou r mortgag e assets have a guaranteed take ou t by supe r-regional purchasers . 41% o f the assets are highl y- marketab l e secondar y ARM. • Approval authorit y rests with 5 regional credi t officers . Credi t admin team include s 22 portfoli o managers, as wel l as credi t suppor t teams specifically fo r construction, CRE , and municipal assets . 12

Loan P ort f olio – CRE Con c e n trations Dec -2007 vs . Dec -2015 • Onl y 7% o f t o t al loan s a r e in Con s truction o r A& D . • Nominall y , w e h a v e les s in Con s t r uc t io n an d A&D than w e di d in 2007 , despi t e a loan port f olio 2.5x as la r g e. • Con s truc ti o n port f olio is spli t 45 % r e s i d e n ti a l an d 55 % comme r cial . A v e r a g e c omme r cial con s tructio n c o mmitme n t is $525,000. • A v e r a g e CRE loan is $421,000 million • 55 % of ou r CRE port f olio is in A t l a nt a, Charle s t o n, Jac k so n v ille, S a v a nna h or Columbia. 201 5 Commercia l Rea l Estate Portfolio 200 7 Commercia l Rea l Estate Portfolio 13
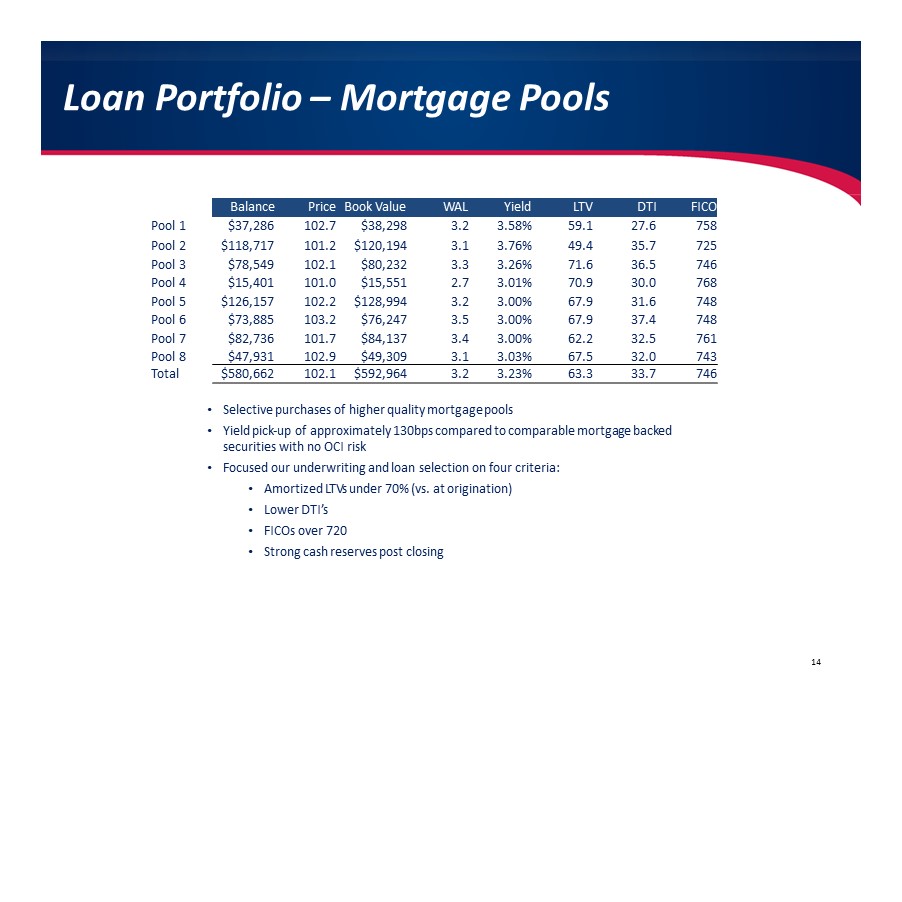
Loan P ort f olio – Mor t gage P ools 14 • Selecti v e pu r chases o f higher qualit y mort g a g e pools • Y i e ld pick -u p o f app r o xim a t ely 130bp s c o m p a r e d t o c o mpa r able mort g a g e bac k ed securities with n o OC I risk • F ocus e d ou r underwritin g and loa n selection o n f our cri t eria: • Amorti z e d L T V s unde r 70 % ( v s. a t origin a tion) • L o w er D T I ’ s • FI C O s ov er 720 • St r on g c a s h r e s e r v e s po s t closing Balance P rice Book V al u e W AL Y ield L T V D T I F I C O P oo l 1 $37,286 102.7 $38,298 3.2 3.58% 59.1 27.6 758 P oo l 2 $118,7 1 7 101.2 $120,1 9 4 3.1 3.76% 49.4 35.7 725 P oo l 3 $78,549 102.1 $80,232 3.3 3.26% 71.6 36.5 746 P oo l 4 $15,401 101.0 $15,551 2.7 3.01% 70.9 30.0 768 P oo l 5 $126,1 5 7 102.2 $128,9 9 4 3.2 3.00% 67.9 31.6 748 P oo l 6 $73,885 103.2 $76,247 3.5 3.00% 67.9 37.4 748 P oo l 7 $82,736 101.7 $84,137 3.4 3.00% 62.2 32.5 761 P oo l 8 $47,931 102.9 $49,309 3.1 3.03% 67.5 32.0 743 T o t al $580,6 6 2 102.1 $592,9 6 4 3.2 3.23% 63.3 33.7 746

Credit Qualit y – 4 Q 1 5 • 51% decline in N P A s to total assets co mpared to December 2014. • $36 million re d u ction in l egacy N P A s (41%) compared to year e n d 2014. Net Charge -offs presented o n a 4 quarter rollin g average No n -Performin g Assets to Total Assets Net Charge -off s to Loans • Net C har ge - offs declini ng to pre- cycle levels • M an a g ement believes t his refle c t s a more bal a nced and d i v ersified loan portfolio 2 . 00% 2 . 0 0% 2 . 26% 2 . 20% 1 . 42% 1 . 09% 1 . 0 0% 3 . 0 0% 3 Q 13 4 Q 13 1 Q 14 2 Q 14 3 Q 14 4 Q 14 1 Q 15 2 Q 15 3 Q 15 4 Q 15 0 . 99% 15 0 . 72% 0 . 49% 0 . 33% 0 . 29% 0 . 21% 0 . 0 0% 0 . 5 0% 1 . 0 0% 1 . 5 0% 3 Q 13 4 Q 13 1 Q 14 2 Q 14 3 Q 14 4 Q 14 1 Q 15 2 Q 15 3 Q 15 4 Q 15

Deposit s – 4 Q 1 5 • 101% - Percentage of all fixed rate loans (including shor t - duration mortgage arms) funded wit h non -rate sensitive d eposits at 12/31/15 (up from 96.0% at EO Y 2014). • $1.01 Billion – Growt h in lo w c ost , no n-rate sensitiv e d eposits i n durin g 2015. • 23.6% – 5 Year Compound e d Growth Rate i n l o w cost, no n-rate sensi t i v e d eposits. 3Q 13 4Q 13 1Q 14 2Q 14 3Q 14 Non- Rat e S e nsitiv e Deposit s includ e NIB, NOW and Savings Accounts. 16 49.7% 48% 47.1% 44% 50.4% 50.4% 51.1% 53.2% 53.4% 53.7% 54.9% 57.8% 52% 56% 60% 4Q 14 1Q 15 2Q 15 3Q 15 4Q 15 Non- R at e Sensiti v e Deposit s as a % o f T o t al Deposits • 0.076% – weighted a v e r ag e c o st of t hi s gro u p of lo w cost, no n-r at e sensitive deposits (down from 0 . 102 % a y ear ago) .

Capi t al and T B V – 4 Q 1 5 Combina t i o n of Capit a l Raise an d 2 M& A deals: • 15.1% - Growt h in TB V durin g 2015 • 16.0% - Expected growth in TB V durin g 2016 (assumes consensus earni ngs and $0.0 5 quarterly dividend) • E xpect a pprox. 20bps of capital build per quarter • E x p ect s lower l evel of a s set g rowth a s we “r e - mix ” earning a sset s ove r nex t 12 - 1 8 months. • N o n eed for capital raises or debt offerings to facilit a te M& A o r organi c growth. 201 5 Results: $10.31 17 $10.26 $10.68 $10.99 $13.01 $11.81 $12.31 $12.65 $6.0 $8.5 $11.0 $13.5 1Q 14 2Q 14 3Q 14 4Q 14 1Q 15 2Q 15 3Q 15 4Q 15 T a ngibl e Boo k V al u e

• Diversified loan portfolio . Only 40 % in CRE a nd onl y 7 % in Construc t io n/A&D • Asset sensitive – o v er 100 % o f f ixed rate l oa n s funde d with non -rate sensi t i v e d eposits . • Capital levels – capital levels are adequate a nd building, ensuring no need f or additional outside capital . 18 I n v e s tme n t R a tionale Strong & Stabl e Balanc e Sheet • T o p Quartil e RO A a n d ROTCE • Diversifi e d rev e nue s ources (66% spr e ad, 3 4% no n - inter e st income). • Balance S heet Quality with high l evels of l ow cost deposi t s an d n o credit c oncentrations Operatin g Performance M&A Opportunities • Discipline d Acquirer • A nnounced/ E xecu t e d l o w risk deals • E noug h c onversati o n s underwa y s o that we can avoid auctions • Stron g Capit a l Ratio s suppor t addi tio n a l M&A • R egulato ry reput a t i o n presen ts n o hurdle

New s Rele ase For m ore i n f o r ma tio n c o n t ac t : Dennis J . Ze m ber J r . Exe c utive Vice Pres i dent & C FO ( 22 9) 8 9 0 - 1 111 AM E R I S BA N CO RP ANNOU NC E S 201 5 FIN A N C IA L R ES U LTS J anu a r y 2 2 , 2 0 16 AM E R I S BANCOR P (NASDAQ - G S : AB CB), M ou l t r ie, G e org i a ( th e “C o m p a n y” ), to d a y r e p or te d o p e r atin g n e t inco m e of $ 53 . 3 m i llion, or $ 1 . 66 p e r s h are , fo r t he yea r ende d Dece m ber 31 , 2015 , c ompar e d with $ 41 . 2 m illion, or $ 1 . 5 7 p e r s h are , f or 20 1 4 . O p eratin g n e t i n c o m e e x clud es $ 1 2 . 5 m i l li on a nd $ 2 . 8 m il li on of after - ta x ac qu isitio n - re late d c o s t s a nd n o n - r e c u rr i ng c r e d i t cha r ges i n 2 0 1 5 a nd 2 0 1 4 , re s p ec ti ve ly . Co mm e n ti ng o n t he C o m pan y’ s earn i ng s , E d w i n W . H o r t m a n, J r . , P res i d e nt and C h ie f Ex e cuti ve Office r of t he C o m p a n y , said , “ I a m please d with o u r i m pr o v eme nt i n 2 0 1 5 co m p are d wit h o ur 2 0 1 4 res u lts . W e s p e nt 2 0 15 i n tegratin g t he acq u isiti o n s c o m p lete d in t he se c o nd q u ar te r o f t he y e ar a n d p r ep a r i ng f o r c o ns i s te nt e a rn i ngs i n 2 01 6 . O ur a c hieve m ent s i n 201 5 i n clude o r g a n i c l o a n gr ow t h of 1 3 . 5 % , o rg a n i c g r o w t h i n n on - i n te r e st be a r in g d e p o s it s of 2 6 . 1 % a nd a 1 5 . 1 % i m p ro ve m ent i n ta ng i b l e b o o k v al u e . I a m c o nfi d e nt t h a t t he m o m e n t um w e h a ve i n b a l a n c e s h ee t g rowt h an d res u lti ng re v e nue is wha t w e ne e d t o m ee t ou r go a l s fo r t h i s year . ” Op e ra tin g net i nco m e f o r t he fo ur t h q uar te r o f 20 15 was $ 1 5 . 3 m i l li on, or $ 0 . 4 7 p e r s har e , c o m par e d w it h $ 1 0 . 6 mi l li on, o r $ 0 . 39 p e r s h are , f or t he sa m e quarte r o f 2 0 1 4 . O p eratin g result s fo r t he fo ur t h q u arte r e x clu de acq u isiti on c o st s t o talin g $ 1 . 8 m i l li on an d $ 25 5 , 0 0 0 , b e f o r e ta x, i n t he f o u r t h q u a r te r o f 20 15 an d 2 01 4 , r es p ecti v ely . “ H ig h lig h ts fo r t he f o urt h q u arte r i n clu de v er y str o n g l o a n prod u cti on aug m e n te d by a dd itio n a l p u rchase s of selec t m o rt g a ge p oo l s a nd stro ng g r ow t h i n n o n - i n teres t b earin g d e p o sits . S e aso n alit y i n o ur m o rt g a ge o p eratio ns res u l te d i n lower p r of ita b ilit y fo r t he fo ur t h quarte r of 2 01 5 t h a n fo r t he t h i r d q u arter , by a p pr ox i m ate ly $ 0 . 04 p e r s h are . Ad d iti on all y, w e h a d ap p r o x i m ate ly $ 2 . 2 milli on o f l o ss - s h ar e relate d ex p en s e s ass o cia t e d wit h t h re e e xp i rin g a g ree m e n t s t h a t we a n tici p at e wil l d ecli ne t o n orma l le v el s i n th e firs t q u arte r o f 2 01 6 . ” Inc l ud i ng a c q ui s iti on a nd c o n vers i on c os t s a nd n o n - re c u r r i ng c r ed i t re s o l u ti on e xp e nse s , t he C o m pany r e p o r t ed n e t i nco m e of $ 1 4 . 1 m i lli on, or $ 0 . 43 per s h a re, f o r t he fo ur t h q uar te r of 2 0 1 5 , co m pared w i t h $ 1 0 . 6 m i lli on, or $ 0 . 3 9 per s h a r e , f o r t he s a m e qu a r te r o f 20 1 4 . F or t he yea r, t he C o m p a n y ’s ea rn i ng s t o tale d $ 4 0 . 8 m i lli on, or $ 1 . 27 p e r sha r e, c o m p a r e d w it h $ 3 8 . 4 m i lli on, or $ 1 . 4 6 p e r sha r e , f o r 2 0 1 4 . Hig h li gh t s o f t he C o m p a n y’ s res u lt s fo r 2 0 1 5 i n c l ude t he f o ll o w i ng : op e ra tin g re t u r n on av e r a ge a sse t s o f 1 . 1 1 % and o p e r a ti ng ret u r n on a v era ge tan g i b l e equit y of 1 3.6 6% g r ow t h i n t o ta l asset s t o $ 5 . 59 b illi on, a n i n creas e o f 3 8.4 % ov e r 2 0 14 o r g a n i c growt h i n t o ta l asset s of 1 0 . 1 % , o r $ 4 0 6 . 0 m illi on o r g a n i c growt h i n l o a ns t o tale d $ 34 4 . 2 m i l li on, o r 1 3. 4% t o ta l growt h i n n on - i n teres t b e arin g d e m a nd d ep o sit s o f $ 4 9 0 . 5 m illi on, or 5 8.4% , t o en d t he yea r a t 27.3% of t o ta l d e p o sits 1 9

2 9 i ncrease i n t o t a l rec u rr i ng r e ve nue o v e r 2 01 4 of 2 2 . 8% t o $ 26 1 . 0 m i l li on, w it h “ re c u r r in g re v e n ue” de fi ned as net i n te rest i nco m e p l us no n - i n t erest i n c o m e , but e xc l u di ng ga i n o n t he sa l e o f se c ur it i es declin e i n a n nualize d ne t c h arge - off s t o 0.20 % o f t o ta l l o ans , c o m p a r e d w it h 0.3 1% f or 2 0 14 increas e i n tangibl e boo k va l ue pe r s hare of 15.1% to $12.65, c o m pared wit h $10.9 9 pe r shar e a t Decemb e r 3 1 , 2 014 i n creas e i n n on - i n teres t i n c o m e o f 3 5. 8% t o $ 8 5. 2 m i lli on, c o m p are d wit h $ 6 2 . 7 m illi on f or 20 14 i n creas e i n p rofita b ilit y fr om m o rt g a g e , S B A an d ware h o use li n e s o f busi n es s o f 7 9 .3 % t o $ 1 5. 2 m i l li on, c o m p a r e d w it h $ 8 . 5 m i l li on f or 20 14 Pen d in g Ac qu i s iti on Durin g t he t h i rd qu a rte r o f 2 0 1 5 , t he C o m p a ny a n no un c e d t he e x ec u tio n o f a n a g ree m e nt t o acq u ir e Jac k s o n v ille Ba n corp , I n c . , t he p are nt c o m p a ny o f T he Jac k son v ill e B an k . T he Jac k sonvill e Ba nk curre n tl y op e rate s e i ght b a nk i ng l o cati on s , al l o f w h ic h ar e locate d wit h i n t he Jac k so n ville , F l or i da MSA . T he ac qu isiti on wil l f u r t he r ex p an d t he C o m p a n y’ s existi ng So u t h easter n fo o tpri nt i n t he attracti ve Jac k son v ill e m ar k et , w h er e t he C o m p a ny wil l be the lar g es t c o m m un it y b an k by d ep o si t m ar k e t s h ar e afte r t h e ac qu isitio n . Upo n c o m p leti on o f t he tra n sactio n, t he c o m b i n e d c o m p a ny wil l h a ve a p pr ox i m ate ly $ 6 . 0 b illi on i n assets , $ 4 . 2 b illi on i n l o a ns a nd $ 5 . 2 b illio n i n d e p o sits . T he tra n sactio n i s ex p ecte d t o cl ose i n t he firs t q u art er of 2 0 1 6 a nd i s su bj ec t t o c u st o m ar y cl os i ng co nd itio ns, includ i ng rece i pt of t he a pproval of t he shar e ho l ders of Ja c k sonville Ban c orp, In c . Increas e i n N e t Interes t In c ome Net i n te rest i n c o m e on a ta x - e qu i va le nt ba s i s i ncreas e d 1 7 . 5 % i n 20 15 t o $ 1 7 8 . 1 m i l li on, up f r om $ 1 5 1 . 5 m i lli on fo r 2 01 4 . G ro w t h i n ear n in g asset s f r om interna l source s , a s w e l l a s fro m acquisiti on acti v ity , c on t rib u te d t o t he i n crease . A v era ge ear n i ng asset s i n crease d 3 0 . 8 % i n 2 01 5 t o $ 4 . 32 b illi on, c o m p are d wit h $ 3 . 3 0 b illi on fo r 20 1 4 . Alt h ou gh t he C o m p a n y’ s n e t i n teres t i n c o m e i n crease d, it s n e t i n teres t m a rgi n w a s a f fecte d b y historicall y l ow i n teres t rates , as we l l as u n u s u a ll y h i gh l e ve l s of lo wer yi e l d i ng s h o r t - te rm asse t s ac q u i r e d i n t he C o m pan y ’s rec e nt b a nk a n d b ran c h acquisitions , a s wel l a s th e r e cen t lo a n pool pur c hases . For t h e year end e d Dece m ber 31 , 2015 , the C o m pany’s net i n teres t m ar g in , i n clu d in g accreti o n , fel l t o 4 . 1 2 % , c o m p a r e d w it h 4 . 5 9 % f or 20 1 4 . T he C o m p a n y’ s n e t i n teres t mar g i n wa s 3 . 9 8 % f or t he fo ur t h q u arte r of 2 01 5 , c o m p are d wit h 4 . 0 7 % fo r t he t h ird qu a rter of the year . T he C o m pany’s m a rg i n i n t he fo ur t h qu a r t er was affec t ed by s e as o nal i nf l ows of m un i c i pal d ep o sit s an d s h o r t - te rm f und s f rom c o m m e r cia l e n te r p r ises , wh ic h i n c r ease d t he p e r ce n ta ge o f sho r t - te rm asset s to earn i ng asse t s t o 6 . 02 % fo r t he q uar te r fro m 4 . 36 % fo r t he t h i rd qu a r t e r of 20 1 5 . M a nage m e nt o f t he C o m pany est i m ate s t he ne g ati ve i m p ac t of t h es e sh or t - ter m i n fl ows t o it s n e t i n teres t mar g i n t o be a p pr ox i m ate ly 0 . 0 7 % . Accretio n i n com e f or t he fourt h q u arte r d ecrease d sl i gh tl y t o $ 2 . 9 m i lli o n, c o m p are d wit h $ 3 . 0 m il l i on f or t he t h ird qu a r te r o f 201 5 , an d wa s sig n i f ica n tl y les s t h a n t he $ 4 . 3 mi l li on r epo r te d f or t he fo ur t h q u a r te r of 2 0 1 4 . E x clu d ing t he ef f ec t o f acc r eti o n , t he C o m p a n y ’s m a rgin f or t he f ou r t h q ua r te r o f 201 5 w a s 3 . 7 4 % , c o m p a r e d w it h 3 . 8 1 % f or t he t h i rd q uar t e r of 2 0 1 5 a n d 4 . 1 7 % f or t he f ou r t h qu a r t er o f 2 0 1 4 . In te r e s t i n c o m e o n l o a ns o n a tax - eq u i v ale nt b asi s i n c r ease d su bs ta n tia l l y d u r in g 20 15 t o $ 1 7 0 . 0 m i ll i on, c o m p a r ed wit h $ 1 4 9 . 1 milli on fo r 2 0 1 4 . M u c h o f t he g r ow t h i n l o a n re v e nu e s o ccurre d lat e i n t he year , s u c h t h a t t he i n crease shou l d prov i de great e r lo a n r e venues for s ubsequent per i o d s . During the qu a rter e n ded Dece m ber 31 , 2015 , i nterest i n c o m e on l o a ns i n c r ease d t o $ 4 6 . 9 m i l li on, c o m p a r e d wit h $ 4 5 . 4 m il lion fo r t he t h ir d q u a r te r of 2 0 1 5 an d $ 4 0 . 6 mi l li on fo r t he f o urt h q u arte r o f 2 01 4 . L o a n yiel ds (i n c l u d in g loa ns h e l d fo r sal e b ut e x clu d in g accreti on i n c o m e ) were 4 . 68 % i n t he f o ur t h q ua rte r of 20 1 5 , c o m pared w it h 4 . 7 3 % i n t he t h ir d q uar te r of 2 0 15 a nd 5 . 05 % i n t he f o u r t h qu a r t er of 2 01 4 . T he m a jor i t y of t he dec l i ne i n l o a n yi e l ds re s u lte d f ro m gr o w t h i n t he C o m pan y ’s i nves t m e nt i n wh o l e l o a n m o rt g a ge po o ls , w h ic h i n crease d t o 1 1 . 9 % o f t o ta l l o a ns d uri ng t he q u arter , wit h yiel ds s l i gh tl y b elow 3 . 0 0 % .

21 Y iel ds o n earni ng asset s i n 2 0 1 5 w e re 4 . 47 % , c o m p a r e d w it h 5 . 0 3 % i n 20 1 4 . T he d e cli ne i n ear n in g asse t yiel ds relate s pr i n ci p a ll y t o t he s hor t - ter m i nv est m e nt strate gy associate d wit h t he C o m p a n y’ s rece nt acq u isiti o ns . Yiel ds on t he in ves t e d f u nds i n p u r c ha s e d m or t g a ge p oo l s w e re 3 . 21 % du r in g 2 0 15 . Cu rr e nt yi e ld s o n a l l o t her l oa n s ( i nc lu d in g p u r c h ase d no n - c ov e r e d an d co v e r e d l o a n s ) we re 5 . 3 1 % d ur i ng 2 0 1 5 , c o m p a r e d w it h 5 . 63 % i n 20 1 4 . H i gh e r yiel d ing cov e r e d lo a ns as a p e rc e ntage of total lo a ns has declin e d fr o m 9 . 6 % at t he end of 2014 t o only 3 . 5 % at Dece m ber 31 , 2 01 5 . Ad d iti on ally , a p orti on o f t he growt h i n t he C o m p any’ s le gacy p o r t fo li o has b e en i n b o t h m un i c i pal l o a ns a n d ad j us t a b le - ra t e m or t gages t hat have a s i gn i f i can tl y be tte r r i s k p r of il e b ut pr o d uce l o we r y i e l ds t h a n c o n s oli da t ed le ve l s typicall y earn e d b y th e Co m pan y i n rec e n t y ears . Yield s o n lo a n s , exc l ud i n g accret i o n , decline d dur i n g 201 5 t o 4 . 90 % , co m p are d wit h 5 . 11 % fo r 201 4 . For the fourth qu a rter, l o a n yields, e xc l udin g accretion , increas e d nine basis po i nts t o 4 . 9 2 % , c o m par e d w it h 4 . 8 3 % f o r t he t h ir d qu a r t er o f 2 0 1 5 . T o ta l i n teres t e xp e nse fo r 2 01 5 wa s $ 1 4 . 9 m illi on, c o m p are d wit h $ 1 4 . 7 m illi on fo r 20 1 4 . Dep o si t c o st s wer e sta b le f o r m o s t of 20 1 5 , en d in g t he yea r a t 0 . 2 3 % , c o m p a r e d w i t h 0 . 3 0 % f or 20 1 4 . D e pos i t c o st s i n c r ease d sli gh tl y i n t he fo ur t h q u arte r of 20 15 t o 0 . 2 3 % , c o m p are d wit h 0 . 2 2 % f or t he t h ir d q u ar t e r of 2 01 5 . C o n ti nu e d i m pr o v e m e nt i n t he C o m p a n y ’s m ix of d ep o sits , p r i m a ri l y t ow ar d n o n - i n te r es t b ea r i ng dep o sits , h a s al l ow e d f or m ore a g g r essi ve r ete n tion eff o rt s o n MMD A an d C Ds wit h o ut n e g at i v el y i m p acti ng o v e r al l d e p o s i t c o sts . N o n - i n teres t b ear i ng d e pos it s were 2 9 . 2 % of t he t o ta l a v e r a ge d e pos it s f or 2 0 15 , c o m p a r e d w it h 2 3 . 5 % f or 20 1 4 . T he C o m pa ny d o e s n ot e xp ec t d ep o sit c o st s or o v eral l f u n d in g c o st s t o c h an ge m ate r iall y i n t he c o m i ng q u arter s d e s p it e ti gh te n in g li qu i d it y a nd s t ren g t h e n ing forecast s fo r a s se t growth . Non - I nterest I ncome E x clu d in g g ain s on in v est m e n t sec u rities , no n - i n teres t i n com e i n crease d 3 5 . 8 % i n 2 0 1 5 t o $ 8 5 . 2 m i lli on, c o m p ared w it h $ 6 2 . 7 m i lli on fo r 2 0 1 4 . G ro w t h r ate s w e re n o ta b l y str o n g f or eac h so ur c e of n o n - i n teres t i n c o m e . Retail m or t gage r e v e nu e s i n c reased 4 2 . 9 % d u r in g 2 0 1 5 , f r om $ 3 0 . 3 m i lli on f or 2 0 1 4 t o $ 4 3 . 3 m i l li on f or 2 01 5 , a s t he Co m pany’s mor t gage divis i on reached a matur e stag e wit h h i ghl y s e asone d a nd e x peri e nced m ortgage bank e rs p ro duc i ng s tro ng re s u lt s fr om ref e rral s o ur ce s . Net i n c o m e f or t he C o m pan y ’s re tai l m or t gage d i v i s i on gr e w 8 8 . 4 % d u r in g 20 15 t o $ 9 . 3 m il l i on . Re ve n ues fr om t he C o m pan y’ s war e h o use l e nd i ng d i v i s io n i ncreas e d 10 6 . 0 % d ur i ng t he year , fr om $ 2 . 7 m il l i on fo r 2 0 1 4 t o $ 5 . 5 m illi on fo r 2 0 1 5 , an d n e t i n c o m e f or t he d i v isi on i n crease d 1 4 1 . 6 % , fr om $ 1 . 3 m i lli on fo r 2 01 4 t o $ 3 . 1 m i l li on f or 2 01 5 . Re v en u e s an d profita b ilit y sl ow e d f or bot h m o rt g ag e a nd ware h o use len d in g i n th e f o urt h q u arter , w h ic h is t rad iti ona ll y a s l ow ti m e of t h e y ear . Re su lt s w e re a l so ne gati ve l y i m pac t ed by t he i m ple m en tati on of new m or t g a ge loan disclo s ure and deliv e ry requi re m ents , whi c h becam e effectiv e o n Octo ber 3 , 2015 . Man a g e ment does not a n tici p at e t h a t t he n e w req u ire m e n t s wil l a dv e rsel y i m p ac t f u tur e qu a rters , a nd m a n a g e m e nt f u r t h e r b elie v e s t h at re v e n u e s a nd profita b ilit y fro m m o rt g a ge operati ons wil l c on tin ue t o g ro w stea d il y d uri ng 20 1 6 . Re ve n ues fr om t he C o m pan y’ s S B A d i v i s i on c o n tin u e d t o i ncrease d ur in g 2 01 5 , r i s i ng fr om $ 7 . 0 m i l li on f or 2 01 4 t o $ 8 . 3 m i l li on f o r 2 01 5 . Net i n co m e for t he di v i s i on i n c rea s ed 2 4 . 7 % , f r o m $ 2 . 3 m i l li on f or 2 01 4 t o $ 2 . 8 m i lli on f or 2 01 5 . Ser v ic e c h ar g e s on d ep o si t acc o u n t s i n c r ease d by $ 9 . 9 m i lli on t o $ 3 4 . 5 mi l li on d ur in g 20 1 5 , a n i n creas e of 4 0 . 0 % co m p are d wit h 2014 . S e rvice charge i ncre as e s associat e d with the C o m p a n y ’s acq u isiti ons du r in g 2 01 5 t o tale d $ 5 . 1 m i l li on, or a pp r o x i m a t e l y $ 9 . 2 m i l li on on an a n nua liz e d b a s i s . Non - I nterest Exp e nse T o ta l op e ratin g ex p e ns es , excl ud in g cre d i t c h ar g e s a nd ac qu i s itio n c o s t s , i n crease d $ 4 0 . 0 m il l i on d u r i ng 2 01 5 t o $ 17 3 . 4 m il l i on . T he m a jo rit y of t he i n creas e i n op e ratin g e x pense s wa s as s o ciate d wit h t he operat i ng expense s o f the b an k an d b r anc h e s ac qu i r e d by t he C o m p a ny d ur i ng 201 5 , wh ic h t o tale d $ 2 3 . 2 m il l i on, an d a n i n c r eas e i n op e r ati ng exp e nses re s u lti ng f r om add e d li nes of b us i n e ss, wh i c h t o ta l e d $ 7 . 2 m i lli on . Exc lu d in g a c q u i s iti on c o s t s, op e ra tin g e x p e nses i n c reas e d $ 3 . 3 m il l i on i n t he fo ur t h q u arte r o f 20 15 co m p are d with t he t h i rd qu a rte r of 2 01 5 . C o m p e n sati on cost s i n crease d $ 1 . 0 m illi on d u ri ng t he fo ur t h q u arte r a s a resul t of i n creased incentiv e accruals .

22 Cre d it - relate d c o st s i n crease d i n t he fourt h q u arte r o f 2 01 5 t o $ 2 . 2 m i l li on, c o m p are d wi t h $ 1 . 1 m il l i on fo r t he t h ird qu a r te r o f 2 01 5 . Du r in g th e qu a r te r, thre e o f th e C o m p any’ s re m ainin g commercia l l o ss - s h ar e agreeme n t s wit h t he F DIC ex p i r ed , ca u sin g t he C o m p a ny t o d isp ose o f a ny r elate d ORE O t h a t re m ai n e d pr io r t o expiration . Thes e costs accounte d fo r approxi m ate ly $ 800 , 00 0 o f th e additiona l c redi t cost s i n c urr e d during t he fourth quarter and a re not consider e d re c u rring . Oth e r costs as s ociated with e x piring l oss - s h a r e agree m e n t s relat e pr i m ari ly t o t he a m or tizati on o f t he in d e m n ificati on asset . T o ta l cost s i n c u r r e d du r in g t he f o u r t h qu a r te r o f 201 5 an d du r in g t he yea r - t o - d at e p e r io d t o tale d $ 1 . 7 m i l li on and $ 4 . 8 m i l l io n , re s pec ti ve ly . S c h e du l e d a m or ti za ti on of t he re m ai n i ng in d e m n ificati on asse t i s a p pr ox i m ate ly $ 77 5 , 0 0 0 f or t he f i rst qu a r te r of 20 16 an d $ 1 . 6 m il l i on f o r al l of 2 0 1 6 . Balance Sheet Trends T o ta l asset s increase d $ 1 . 5 5 b illi on d u r i ng 2 01 5 , en d in g t he yea r a t $ 5 . 59 b illi on, co m p are d wit h $ 4 . 04 b illi on at Dece m ber 31 , 2014 . The growth i n t o ta l asset s wa s driv e n b y th e acqu i sitions of Mer c h a nts and Sou t h e rn B a nk a n d 18 ad d iti o na l retai l br a n c h e s d urin g t he seco nd q u arte r of 2 0 1 5 . T o ta l l o a n s , excl ud in g l o a ns hel d f or sale , purc h ase d n o n - co v ere d l o a n pool s an d c ov e re d l o a n s , w er e $ 3 . 18 b illi on at t he e nd of 2 01 5 , c o m p are d wit h $ 2 . 5 6 b illi on a t t he en d o f 20 1 4 . L o a ns h el d f or sal e i n crease d 1 7 . 3 % t o $ 1 1 1 . 2 m i l li on, t he re s u l t o f h ig her pr o d uc tio n l e ve l s i n th e C o m pa ny ’s m or t gage a nd S B A d i v i s io ns . P ur c has e d n on - c o ver e d loa n pool s wer e $ 593 . 0 m i lli o n a t Dece m be r 31 , 2015 . C o vere d loan s dec l ine d $ 133 . 8 m i llion , o r 49 . 3 % , durin g 2015 t o en d th e yea r a t $ 137 . 5 m il l i on . At t he en d o f 20 1 5 , cove r e d l o a ns r eprese nt o n l y 3 . 5 % of t o ta l loans , co m p ared w it h 9 . 6 % at t h e e n d of 20 1 4 . In v est m e nt sec u ritie s a t t he e nd of 2 0 1 5 wer e $ 7 9 2 . 5 m il l i on, or 1 5 . 6 % of ear n i ng assets , c o m p are d wit h $ 5 5 2 . 1 m i l li on, or 1 5 . 5 % of ea r n in g a ssets , a t Dec e m b e r 31 , 2014 . D ep o sit s i n crease d $ 1 . 4 5 b illi on d u rin g 2 0 1 5 t o fi n is h t he yea r a t $ 4 . 88 billi on . At D ec e m b e r 3 1 , 201 5 , n o n - i n terest bear i ng d e posit accounts were $ 1 . 33 billi on , o r 27 . 3 % o f tota l d e posits , c o m p ar ed with $ 839 . 4 m i l lio n an d 24 . 5 % , respectively , a t Dece m be r 31 , 2014 . Non - r a te sensitive d e posits (inc l ud i ng NIB , NO W an d s a vings ) totale d $ 2 . 71 b illi on a t Dece m b e r 3 1 , 20 1 5 , c o m p are d wit h $ 1 . 82 b illi on a t t he en d o f 2 0 1 4 . T h es e fu nds represe n te d 5 5 . 6 % o f t he C o m p a n y ’s t o t a l d ep o sit s a t t he e nd o f 2 0 15 , c o m p a r e d w it h 5 3 . 2 % a t t he e nd o f 2 0 1 4 . St o ckh o l d e r s ’ e qu it y a t D ece m b e r 3 1 , 20 15 t o tale d $ 51 4 . 8 m il l i on, a n i n c r eas e of $ 14 8 . 7 m il l i on, or 4 0 . 6 % , f r om Dece m be r 31 , 2014 . Th e in c reas e i n s t o c kholders ’ e quit y wa s th e resul t o f th e Co m p any’ s iss u a n c e o f $ 114 . 9 m i llion of c o m m on share s i n t he firs t q u arte r o f 2 0 1 5 an d ear n in gs o f $ 4 0 . 8 m ill ion d urin g 201 5 . Tan g i b l e b o o k v a l ue p e r s h a re en d e d 2 0 15 a t $ 1 2 . 65 pe r s h a r e , up 1 5 . 1 % f r om $ 1 0 . 9 9 p e r s h a re a t t he e nd o f 2 0 14 . Confer e nce Call T he C o m p a ny wil l host a telec o nfere n c e a t 1 0 : 0 0 a . m . Easte rn ti m e t od a y (Jan u ar y 2 2 , 20 1 6 ) t o d isc u s s t he C o m p a n y's resu lt s a n d a n s wer a p p ro pr i a t e q ues tio ns . T he c o n fer e nce ca l l can be ac c essed by d i a lin g 1 - 8 7 7 - 50 4 - 1 1 9 0 , o r 1 - 4 12 - 9 02 - 66 30 f or i n te rn atio n a l pa r tici p a n t s a nd 1 - 8 5 5 - 6 6 9 - 96 57 f or Ca n a da . T he c o n f e r e n c e I D n am e i s A m e r is Ba n corp . A re p la y o f t he cal l wil l be a v aila b l e one h ou r afte r t he en d o f t he co nf ere n c e cal l u n ti l Febr u a r y 5 , 20 1 6 . T o liste n t o t he r e p lay , d ia l 1 - 8 77 - 34 4 - 7 52 9 , or 1 - 4 12 - 31 7 - 0 08 8 f or i n te r nati on a l p a r tici p a n t s an d 1 - 8 55 - 66 9 - 9 65 8 for Canad a . T he c onfer e nce rep l ay access code is 10078442 . The c onfer e n c e call replay and t he f i n a ncial infor m ation d isc us se d wil l als o be a v ailabl e o n t he In v es t or Relati ons p a ge of t he A m eri s Ba nk we bs i t e a t ww w . a m e r is b an k . c o m . About Ameris Ban c orp A m eri s Ba n cor p i s h eadq u artere d i n M o ultrie , Geor g ia , an d a t t he en d o f th e m o s t rece nt q u arte r h a d 1 01 l o cati ons in Ge or g i a, A l a b a m a, n or t h e r n F l or i da a nd S o u t h C a ro l i na, w it h e i ght of t ho s e l oca tio ns an no unc e d t o be c o n so li da t e d w it h i n t he c o m i ng m on th s .

This news rele a s e co n tains certain p erf ormanc e measure s d e te r mine d b y meth o d s other than in accordance with accounti n g principles ge n erally a c cep t ed in the Un i ted St a t e s of Ameri c a ( “GAAP” ) . Mana g ement of Ameris Bancor p ( t h e “Company” ) uses these non - GAAP measures in its an a lysis o f the Company’s p e rformance . T hese measures a r e usef u l when evaluating the underlying p erf o r mance and e f fi c ien c y of the Co m pany’s operati o n s and balance s h ee t . The Compa n y’s management bel i eves th a t these non - G A AP measures prov i de a gre a ter u n derstanding of o ngoing opera t i o ns, enhance comparability of results with prior periods and demonstrate the effects of sign i ficant gains and charges in the current period . The C ompany’s management believes that investors may use t h ese no n - GAAP fina n cial measures to ev a luate t h e Comp a ny’s fina n ci a l p e rformance with o ut t h e impa c t of unusual items that may obscu r e trends in the C ompany’s underlying performance . The s e d isclos u res should not be viewed as a substitute for f i nancial measures determined in accordance wit h GAA P , nor a r e they necessarily comparab l e to non - GA A P performance measures that may be presented b y other companies . This news release contains sta t ements t hat co n s titute “forwar d - looking sta t em e nts” within the meaning of S e c t ion 27 A o f the Securit i es A ct of 1933 , as amen d ed, and Section 21 E of the S e curities Exchange A ct o f 193 4 , as a m ended . The w o rds “believe”, “estimate”, “expect”, “i n tend”, “anticipa t e” a nd similar expressions and variations there o f identify cert a in of such forward - looking st a teme n ts, which speak o nly as of the dates on which t h ey were made . The Company und e rtake s n o obliga t io n t o publicly update or revise any forward - lo o king stateme n ts, whether as a result of new info r m ation, future events or o therwise . Readers a r e cautio n ed th a t a ny such forward - looking statements are not guarantees o f f u ture per f ormance a n d involve risks a nd uncert a inties an d tha t actua l result s ma y diffe r materiall y from those in d icated in the forward - l o ok i ng st a teme n ts as a result o f v a rious fa ctors . Readers are cautioned not to pla c e undu e relia n ce o n thes e forward - lookin g stateme n ts and are refe r r ed to t h e Com p any’s period i c filings w ith the S ecurit i es and Exchange Commission, inclu d ing t h e Company’s 2 0 14 Annual Repo r t on Form 10 - K , for a summary of certain factors that may impact t h e Company’s results of o p era t ions and f inanc i al con d itio n . 23

AMERIS BANCORP FINANCIAL HIGHLIGHTS (unaudited) (dollars in thousands except per share data and FTE headcount) Three Months Ended Twelve Months Ended Dec. Sept. Jun. Mar. Dec. Dec. Dec. 2015 2015 2015 2015 2014 2015 2014 EARNINGS Net Income Available to Common Sharehold e r 14,148 $ $ 15,627 $ 1,308 $ 9,764 $ 10,580 $ 40,847 $ 38,437 PER COMMON SHARE DATA Earnings per share available to common shareholde r s PERFORMANCE RATIOS CAPITAL ADEQUACY (period end) 24 Basic $ 0.44 $ 0.49 $ 0.04 $ 0.32 $ 0.40 $ 1.29 $ 1.48 Dilut e d $ 0.43 $ 0.48 $ 0.04 $ 0.32 $ 0.39 $ 1.27 $ 1.46 Cash Dividends per sha r e $ 0.05 $ 0.05 $ 0.05 $ 0.05 $ 0.05 $ 0.20 $ 0.15 Book value per share (period end $ 15.98 $ 15.60 $ 15.12 $ 15.22 $ 13.67 $ 15.98 $ 13.67 Tangible book value per share (period e n d $ 12.65 $ 12.31 $ 11.81 $ 13.01 $ 10.99 $ 12.65 $ 10.99 Weighted average number of shares Basic 32,199,632 32,195,435 32,184,355 30,442,998 26,771,636 31,761,624 25,974,084 Dilut e d 32,594,929 32,553,167 32,520,453 30,796,148 27,090,293 32,126,667 26,259,030 Period - end number of share 32,211,385 32,196,117 32,195,089 32,182,143 26,773,863 32,211,385 26,773,863 Market data: High closing pri c e $ 34.90 $ 28.75 $ 26.87 $ 26.55 $ 26.48 $ 34.90 $ 26.48 Low closing pri c e $ 27.65 $ 24.97 $ 24.73 $ 22.75 $ 21.95 $ 22.75 $ 19.73 Period end closing pric $ 33.99 $ 28.75 $ 25.29 $ 26.39 $ 25.64 $ 33.99 $ 25.64 Average daily volum 301,775 174,900 107,413 105,152 111,473 173,391 93,229 Return on average asse t s 1.03% 1.19% 0.12% 0.97% 1.05% 0.85% 1.08% Return on average common equit 10.94% 12.53% 1.07% 8.76% 11.57% 8.37% 12.40% Earning asset yield (T E ) 4.30% 4.39% 4.49% 4.79% 5.08% 4.47% 5.03% Total cost of fun d s 0.32% 0.32% 0.36% 0.40% 0.43% 0.34% 0.43% Net interest margin (T E ) 3.98% 4.07% 4.14% 4.39% 4.64% 4.12% 4.59% Non - interest income excluding securities transaction as a percent of total revenue (T E ) 29.56% 32.33% 31.51% 29.06% 26.50% 30.68% 27.37% Efficiency rat i o 74.66% 66.87% 92.74% 72.38% 72.75% 76.25% 70.92% Stockholders' equity to asset 9.21% 9.63% 9.35% 11.79% 9.07% 9.21% 9.07% Tangible common equity to tangible asset 7.44% 7.76% 7.46% 10.26% 7.42% 7.44% 7.42% EQUITY TO ASSETS RECONCILIATION Tangible common equity to tangible asset 7.44% 7.76% 7.46% 10.26% 7.42% 7.44% 7.42% Effect of goodwill and other intangible 1.77% 1.87% 1.89% 1.54% 1.65% 1.77% 1.65% Equity to assets (GAA P ) 9.21% 9.63% 9.35% 11.79% 9.07% 9.21% 9.07% OTHER PERIOD - END DATA Banking Division F T E 1,075 1,110 1,122 852 853 1,075 853 Mortgage Division F T E 229 218 191 170 174 229 174 Total Ameris Bancorp FTE Headcoun 1,304 1,328 1,313 1,022 1,027 1,304 1,027 Assets per Banking Division F T E $ 5,199 $ 4,699 $ 4,640 $ 4,874 $ 4,733 $ 5,199 $ 4,733 Branch locatio n s 101 103 103 73 73 101 73 Deposits per branch locati o n $ 48,310 $ 43,986 $ 43,801 $ 47,674 $ 47,002 $ 48,310 $ 47,002

Dec. Sept. Jun. Mar. Dec. Dec. Dec. 2015 2015 2015 2015 2014 2015 2014 INCOME STATEMENT (1) Includes expenses associated with problem loans and OREO, as well as OREO losses and writedo w n Twelve Months Ended Three Months Ended 25 AMERIS BANCORP FINANCIAL HIGHLIGHTS (unaudited) (dollars in thousands except per share data and FTE headcount) Interest income Interest and fees on loan $ 47,336 $ 45,775 $ 39,838 $ 38,618 $ 41,235 $ 171,567 $ 150,611 Interest on taxable securiti e s 4,540 4,694 3,747 3,153 3,114 16,134 12,086 Interest on nontaxable securitie 458 480 462 469 483 1,869 1,626 Interest on deposits in other bank 262 227 177 124 66 790 236 Interest on federal funds sol 5 19 5 4 2 33 7 Total interest inco m e 52,601 51,195 44,229 42,368 44,900 190,393 164,566 Interest expen s e Interest on deposi t s $ 2,687 $ 2,521 $ 2,264 $ 2,280 $ 2,560 $ 9,752 $ 9,488 Interest on other borrowing 1,296 1,275 1,277 1,256 1,334 5,104 5,192 Total interest expen s e 3,983 3,796 3,541 3,536 3,894 14,856 14,680 Net interest incom 48,618 47,399 40,688 38,832 41,006 175,537 149,886 Provision for loan loss e s 553 986 2,656 1,069 888 5,264 5,648 Net interest income after provision for loan losse $ 48,065 $ 46,413 $ 38,032 $ 37,763 $ 40,118 $ 170,273 $ 144,238 Noninterest incom Service charges on deposit account $ 10,119 $ 10,766 $ 7,151 $ 6,429 $ 6,522 $ 34,465 $ 24,614 Mortgage banking activi t y 8,586 10,404 9,727 8,083 6,476 36,800 25,986 Other service charges, commissions and fee 1,112 1,145 829 668 643 3,754 2,647 Gain(loss) on sale of securitie - 115 10 12 - 137 138 Other non - interest incom 2,590 2,548 2,909 2,383 2,721 10,430 9,451 Total noninterest incom 22,407 24,978 20,626 17,575 16,362 85,586 62,836 Noninterest expen s e Salaries and employee benefit 25,972 24,934 22,465 20,632 19,316 94,003 73,878 Occupancy and equipment expense 5,917 5,915 4,809 4,554 4,717 21,195 17,521 Data processing and telecommunications expen s e 6,046 5,329 4,214 4,260 4,229 19,849 15,551 Credit resolution related expens e s (1) 2,223 1,083 11,240 3,161 5,290 17,707 13,506 Advertising and marketing expense 1,171 667 833 641 847 3,312 2,869 Amortization of intangible asset 1,160 1,321 630 630 662 3,741 2,330 Merger and conversion charge 1,807 446 5,712 15 67 7,980 3,940 Other non - interest expense 8,732 8,701 6,961 6,934 6,605 31,328 21,274 Total noninterest expens 53,028 48,396 56,864 40,827 41,733 199,115 150,869 Income before income taxe $ 17,444 $ 22,995 $ 1,794 $ 14,511 $ 14,747 $ 56,744 $ 56,205 Income tax expen s e 3,296 7,368 486 4,747 4,167 15,897 17,482 Net inco m e $ 14,148 $ 15,627 $ 1,308 $ 9,764 $ 10,580 $ 40,847 $ 38,723 Preferred stock dividends - - - - - - 286 Net income available to common sharehold e r $ 14,148 $ 15,627 $ 1,308 $ 9,764 $ 10,580 $ 40,847 $ 38,437 Diluted earnings available to common shareholders 0.43 0.48 0.04 0.32 0.39 1.27 1.46

26 Liabiliti e s Deposits: AMERIS BANCORP FINANCIAL HIGHLIGHTS (unaudited) (dollars in thousands except per share data and FTE headcount) Three Months Ended Dec. 2015 Sept. 2015 Jun. 2015 Mar. 2015 Dec. 2014 PERIOD - END BALANCE SHEET Assets Cash and due from ban k s $ 118,518 $ 114,396 $ 115,413 $ 80,142 $ 78,036 Federal funds sold and interest bearing balance 272,045 120,925 239,804 126,157 92,323 Investment securities available for sale, at fair valu 783,185 811,385 862,154 610,330 541,805 Other investment 9,323 9,322 9,322 8,636 10,275 Mortgage loans held for sa l e 111,182 111,807 108,829 73,796 94,759 Loans, net of unearned incom 2,406,877 2,290,649 2,171,600 1,999,420 1,889,881 Purchased, non - covered loans (excluding loan poo l s 771,554 767,494 808,313 643,092 674,239 Purchased, non - covered loan pool 592,963 410,072 268,984 - - Covered loa n s 137,529 191,021 209,598 245,745 271,279 Less allowance for loan losse (21,062) (22,471) (21,658) (21,852) (21,157) Loans, n e t 3,887,861 3,636,765 3,436,837 2,866,405 2,814,242 Other real estate own e d 16,147 20,730 22,567 32,339 33,160 Purchased, non - covered other real estate owne 14,333 11,538 13,112 13,818 15,585 Covered other real estate owne 5,011 12,203 12,626 16,089 19,907 Total other real estate own e d 35,491 44,471 48,305 62,246 68,652 Premises and equipment, ne 121,639 124,756 124,916 98,292 97,251 Goodwil 90,082 87,701 87,367 63,547 63,547 Other intangibles, ne 17,058 18,218 19,189 7,591 8,221 FDIC loss sharing receivab l e 6,301 4,506 14,957 23,312 31,351 Cash value of bank owned life insuranc 64,251 59,894 59,552 59,212 58,867 Other assets 72,004 72,154 79,089 73,238 77,748 Total assets $ 5,588,940 $ 5,216,300 $ 5,205,734 $ 4,152,904 $ 4,037,077 Noninterest - beari n g $ 1,329,857 $ 1,275,800 $ 1,280,174 $ 967,015 $ 839,377 Interest - beari n g 3,549,433 3,254,723 3,231,373 2,513,216 2,591,772 Total deposi t s 4,879,290 4,530,523 4,511,547 3,480,231 3,431,149 Federal funds purchased & securities sold unde agreements to repurcha s e 63,585 51,506 75,066 55,520 73,310 Other borrowin g s 39,000 39,000 39,000 43,851 78,881 Other liabiliti e s 22,432 23,371 24,026 17,952 22,384 Subordinated deferrable interest debenture 69,874 69,600 69,325 65,567 65,325 Total liabiliti e s 5,074,181 4,714,000 4,718,964 3,663,121 3,671,049 Stockholders' equi t y Preferred sto c k $ - $ - $ - $ - $ - Common sto c k 33,625 33,610 33,609 33,593 28,159 Capital surplus 337,349 336,599 336,212 335,578 225,015 Retained earnin g s 152,820 140,282 126,265 126,566 118,412 Accumulated other comprehensive income/(los 3,353 4,197 3,072 6,353 6,098 Less treasury sto c k (12,388) (12,388) (12,388) (12,307) (11,656) Total stockholders' equi t y 514,759 502,300 486,770 489,783 366,028 Total liabilities and stockholders' equit $ 5,588,940 $ 5,216,300 $ 5,205,734 $ 4,152,904 $ 4,037,077 Other Da t a Earning Asse t s 5,075,335 4,703,353 4,669,282 3,698,540 3,564,286 Intangible Asse t s 107,140 105,919 106,556 71,138 71,768 Interest Bearing Liabilitie 3,721,892 3,414,829 3,414,764 2,678,154 2,809,288 Average Asse t s 5,427,367 5,213,275 4,464,558 4,079,750 4,011,128 Average Common Stockholders' Equit 513,098 494,957 491,967 452,132 362,659

Net charge - offs (recoveries 2,209 $ $ 237 $ 1,994 $ 405 1,705 $ 4,845 $ $ 5,941 Non - accrual loans (excluding purchased non - covere (1) Asset quality information is presented net of covered assets where the Company's risk exposure is limited substantially by loss sharing agreements with the FD (2) During 2014 and 2015, the Company recorded provision for loan loss expense to account for losses where the initial estimate of cash flows was found to be excessive on lo acquired in FDIC assisted acquisitions. These amounts are excluded from the calculation above but reflected in the Comp a ny's Consolidated Statement of Operatio AMERIS BANCORP FINANCIAL HIGHLIGHTS (unaudited) (dollars in thousands except per share data and FTE headcount) Three Months Ended Twelve Months Ended 27 and covered loan s ) 16,860 20,558 20,740 20,841 21,728 16,860 21,728 Non - accrual purchased non - covered loan 13,330 11,374 17,444 17,308 18,249 13,330 18,249 Foreclosed assets (excluding purchased assets 16,147 20,730 22,567 32,339 33,160 16,147 33,160 Purchased, non - covered other real estate owne 14,333 11,538 13,112 13,818 15,585 14,333 14,359 Accruing loans delinquent 90 days or mor - - - - 1 - 1 Total non - performing assets, excluding covered ass e t 60,670 64,200 73,863 84,306 88,723 60,670 87,497 Non - performing assets as a percent of total asset 1.09% 1.23% 1.42% 2.03% 2.20% 1.09% 2.17% Net charge offs as a percent of loans (Annualized 0.36% 0.04% 0.37% 0.08% 0.36% 0.20% 0.31% Dec. 2015 Sept. 2015 Jun. 2015 Mar. 2015 Dec. 2014 Dec. 2015 Dec. 2014 ASSET QUALITY INFORMATION (1) Allowance for loan losse Balance at beginning of perio $ 22,471 $ 21,658 $ 21,852 $ 21,157 $ 22,212 $ 21,157 $ 22,377 Provision for loan los s (2) 800 1,050 1,800 1,100 650 4,750 4,721 Charge - of f s 2,398 719 2,452 855 2,071 6,424 7,625 Recoveri e s 189 482 458 450 366 1,579 1,684 Net charge - offs (recoveries 2,209 237 1,994 405 1,705 4,845 5,941 Ending balan c e $ 21,062 $ 22,471 $ 21,658 $ 21,852 $ 21,157 $ 21,062 $ 21,157 As a percentage of loa n s 0.88% 0.98% 1.00% 1.09% 1.12% 0.88% 1.12% As a percentage of nonperforming loan 124.92% 109.31% 104.43% 104.85% 97.37% 124.92% 97.37% Net charge - off informatio Charge - offs Commercial, financial & agricultura $ 501 $ 135 $ 410 $ 392 $ 468 $ 1,438 $ 1,567 Real estate - residentia 621 234 464 268 368 1,587 1,707 Real estate - commercial & farmla n d 1,009 184 1,162 12 1,033 2,367 3,288 Real estate - construction & developm e n 157 105 263 97 74 622 592 Consumer installmen 110 61 153 86 128 410 471 Total charge - of f s 2,398 719 2,452 855 2,071 6,424 7,625 Recoveri e s Commercial, financial & agricultura 134 117 115 285 91 651 321 Real estate - residentia 13 54 27 57 71 151 254 Real estate - commercial & farmla n d 13 272 17 15 91 317 274 Real estate - construction & developm e n 9 6 277 31 49 323 349 Consumer installmen 20 33 22 62 64 137 486 Total recoveri e s 189 482 458 450 366 1,579 1,684
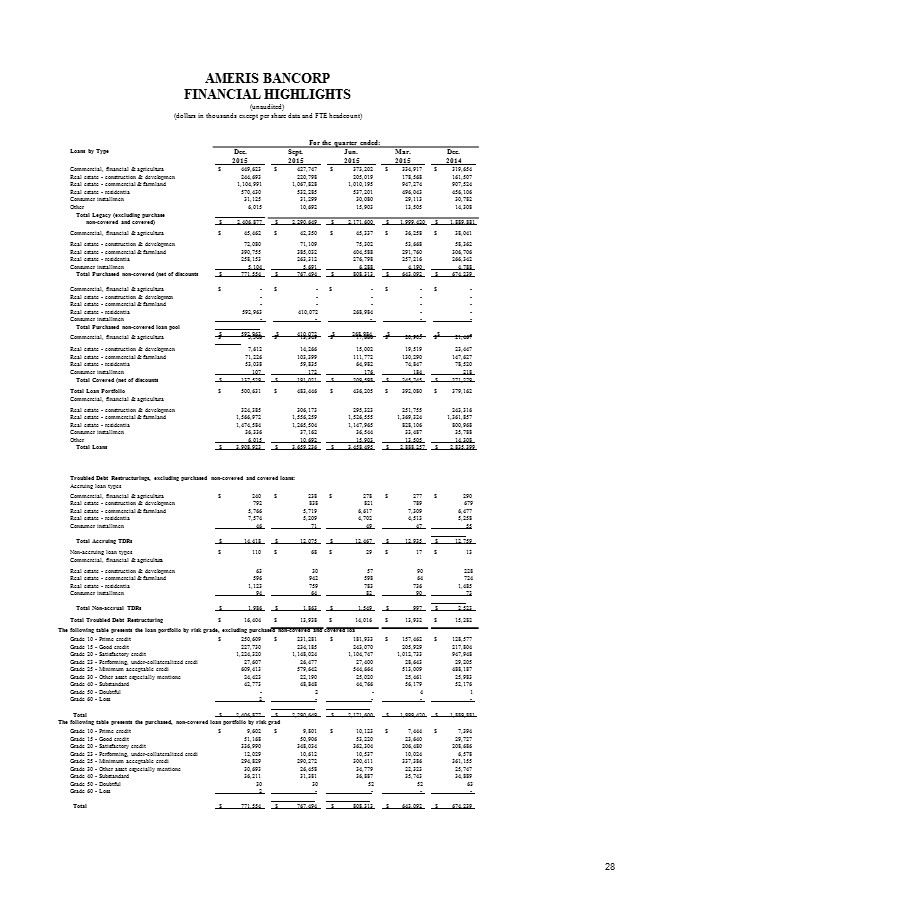
28 Commercial, financial & agricultura Real estate - construction & developm e n Real estate - commercial & farmla n d Real estate - residentia Consumer installmen Total Purchased non - covered loan pool - - - 592,963 $ - - - 410,072 $ - - - 268,984 $ - - - - $ - - - - $ - - - - - $ 592,963 $ 410,072 $ 268,984 $ - $ - Troubled Debt Restructurings, excluding purchased non - covered and covered loans: Accruing loan types The following table presents the loan portfolio by risk grade, excluding purchased non - covered and covered loa The following table presents the purchased, non - covered loan portfolio by risk grad AMERIS BANCORP FINANCIAL HIGHLIGHTS (unaudited) (dollars in thousands except per share data and FTE headcount) For the quarter ended: Loans by Type Dec. 2015 Sept. 2015 Jun. 2015 Mar. 2015 Dec. 2014 Commercial, financial & agricultura $ 449,623 $ 427,747 $ 373,202 $ 334,917 $ 319,654 Real estate - construction & developm e n 244,693 220,798 205,019 178,568 161,507 Real estate - commercial & farmla n d 1,104,991 1,067,828 1,010,195 947,274 907,524 Real estate - residentia 570,430 532,285 537,201 496,043 456,106 Consumer installmen 31,125 31,299 30,080 29,113 30,782 Oth e r Total Legacy (excluding purchase 6,015 10,692 15,903 13,505 14,308 non - covered and covere d ) $ 2,406,877 $ 2,290,649 $ 2,171,600 $ 1,999,420 $ 1,889,881 Commercial, financial & agricultura $ 45,462 $ 42,350 $ 45,337 $ 36,258 $ 38,041 Real estate - construction & developm e n 72,080 71,109 75,302 53,668 58,362 Real estate - commercial & farmla n d 390,755 385,032 404,588 291,760 306,706 Real estate - residentia 258,153 263,312 276,798 257,216 266,342 Consumer installmen 5,104 5,691 6,288 4,190 4,788 Total Purchased non - covered (net of discoun t s $ 771,554 $ 767,494 $ 808,313 $ 643,092 $ 674,239 Commercial, financial & agricultura $ 5,546 $ 13,349 $ 17,666 $ 20,905 $ 21,467 Real estate - construction & developm e n 7,612 14,266 15,002 19,519 23,447 Real estate - commercial & farmla n d 71,226 103,399 111,772 130,290 147,627 Real estate - residentia 53,038 59,835 64,982 74,847 78,520 Consumer installmen 107 172 176 184 218 Total Covered (net of discounts $ 137,529 $ 191,021 $ 209,598 $ 245,745 $ 271,279 Total Loan Portfolio Commercial, financial & agricultura $ 500,631 $ 483,446 $ 436,205 $ 392,080 $ 379,162 Real estate - construction & developm e n 324,385 306,173 295,323 251,755 243,316 Real estate - commercial & farmla n d 1,566,972 1,556,259 1,526,555 1,369,324 1,361,857 Real estate - residentia 1,474,584 1,265,504 1,147,965 828,106 800,968 Consumer installmen 36,336 37,162 36,544 33,487 35,788 Oth e r 6,015 10,692 15,903 13,505 14,308 Total Loans $ 3,908,923 $ 3,659,236 $ 3,458,495 $ 2,888,257 $ 2,835,399 Commercial, financial & agricultura $ 240 $ 238 $ 278 $ 277 $ 290 Real estate - construction & developm e n 792 838 821 789 679 Real estate - commercial & farmla n d 5,766 5,719 6,617 7,309 6,477 Real estate - residentia 7,574 5,209 4,702 4,513 5,258 Consumer installmen 46 71 49 47 55 Total Accruing TD R s $ 14,418 $ 12,075 $ 12,467 $ 12,935 $ 12,759 Non - accruing loan types Commercial, financial & agricultura $ 110 $ 68 $ 29 $ 17 $ 13 Real estate - construction & developm e n 63 30 57 90 228 Real estate - commercial & farmla n d 596 942 598 64 724 Real estate - residentia 1,123 759 783 736 1,485 Consumer installmen 94 64 82 90 73 Total Non - accrual TD R s $ 1,986 $ 1,863 $ 1,549 $ 997 $ 2,523 Total Troubled Debt Restructuring $ 16,404 $ 13,938 $ 14,016 $ 13,932 $ 15,282 Grade 10 - Prime cred i t $ 250,609 $ 231,281 $ 181,933 $ 157,462 $ 128,577 Grade 15 - Good cred i t 227,730 234,185 243,070 205,929 217,804 Grade 20 - Satisfactory cred i t 1,224,320 1,148,024 1,104,747 1,012,733 947,948 Grade 23 - Performing, under - collateralized cre d i 27,607 26,477 27,400 28,643 29,205 Grade 25 - Minimum acceptable credi 609,413 579,642 544,664 513,009 488,187 Grade 30 - Other asset especially mentione 24,423 22,190 25,020 25,461 25,983 Grade 40 - Substanda r d 42,773 48,848 44,766 56,179 52,176 Grade 50 - Doubtf u l - 2 - 4 1 Grade 60 - Loss 2 - - - - Tot a l $ 2,406,877 $ 2,290,649 $ 2,171,600 $ 1,999,420 $ 1,889,881 Grade 10 - Prime cred i t $ 9,602 $ 9,801 $ 10,123 $ 7,444 $ 7,394 Grade 15 - Good cred i t 51,168 50,906 53,220 23,640 29,727 Grade 20 - Satisfactory cred i t 336,990 348,034 362,304 206,480 208,686 Grade 23 - Performing, under - collateralized cre d i 12,029 10,612 10,537 10,024 6,578 Grade 25 - Minimum acceptable credi 294,829 290,272 300,411 337,386 361,155 Grade 30 - Other asset especially mentione 30,693 26,458 34,779 22,323 25,747 Grade 40 - Substanda r d 36,211 31,381 36,887 35,743 34,889 Grade 50 - Doubtf u l 30 30 52 52 63 Grade 60 - Loss 2 - - - - Tot a l $ 771,554 $ 767,494 $ 808,313 $ 643,092 $ 674,239

AMERIS BANCORP FINANCIAL HIGHLIGHTS (unaudited) (dollars in thousands except per share data and FTE headcount) Three Months Ended Twelve Months Ended Dec. Sept. Jun. Mar. Dec. Dec. Dec. 2015 2015 2015 2015 2014 2015 2014 AVERAGE BALANCES 29 Federal funds so l d $ 5,500 $ 5,500 $ 5,500 $ 5,500 $ 3,163 $ 5,500 $ 2,886 Interest bearing deposits in bank 291,303 199,057 201,765 158,286 69,772 214,120 70,829 Investment securities - taxabl 730,608 772,252 600,176 485,922 461,800 650,708 435,960 Investment securities - nontaxabl 69,711 72,549 70,653 71,229 72,072 71,035 61,834 Other investment 9,322 9,322 9,597 9,450 9,804 9,422 10,589 Mortgage loans held for sa l e 98,765 102,961 81,823 75,831 97,406 87,952 71,231 Loans 2,333,577 2,224,490 2,111,507 1,911,601 1,871,618 2,161,726 1,753,013 Purchased non - covered loan 752,508 788,351 654,397 650,331 659,472 712,022 557,708 Purchased non - covered loan pool 454,884 323,258 17,308 - - 201,689 - Covered loa n s 180,493 195,175 246,422 262,693 299,981 206,774 339,417 Total Earning Asse t s $ 4,926,671 $ 4,692,915 $ 3,999,148 3,630,843 3,545,088 $ 4,320,948 $ 3,303,467 Noninterest bearing deposit $ 1,324,999 $ 1,300,870 $ 1,088,249 $ 897,937 $ 850,879 $ 1,227,682 $ 751,874 NOW accoun t s 1,100,972 907,618 745,709 756,795 786,511 877,949 724,461 MM D A 1,212,087 1,219,736 981,143 857,346 840,397 1,074,349 805,601 Savings accoun t s 241,337 239,999 188,767 163,624 156,663 209,206 150,266 Retail CDs < $100,000 449,158 484,007 388,248 372,463 386,844 425,583 389,174 Retail CDs > $100,000 395,978 387,485 378,137 383,962 401,934 384,761 373,767 Brokered C D s - - - - 4,023 - 5,479 Total Deposi t s 4,724,531 4,539,715 3,770,253 3,432,127 3,427,251 4,199,530 3,200,622 FHLB advanc e s - - 17,275 16,778 35,815 8,444 46,986 Other borrowin g s 39,000 39,000 41,930 43,871 46,508 40,931 39,850 Subordinated debenture Federal funds purchased and securities sol under agreements to repurchas 69,723 61,986 69,448 44,480 67,180 58,722 65,436 52,707 65,195 47,247 67,962 50,988 60,298 47,136 Total Non - Deposit Funding 170,709 152,928 185,107 178,792 194,765 168,325 194,270 Total Fundi n g $ 4,895,240 $ 4,692,643 $ 3,955,360 $ 3,610,919 $ 3,622,016 $ 4,367,855 $ 3,394,892

Dec. Sept. Jun. Mar. Dec. Dec. Dec. 2015 2015 2015 2015 2014 2015 2014 INTEREST INCOME/EXPENSE I I AMERIS BANCORP FINANCIAL HIGHLIGHTS (unaudited) (dollars in thousands except per share data and FTE headcount) Three Months Ended Twelve Months Ended 30 NTEREST INCOME Federal funds so l d $ 5 $ 19 $ 5 $ 4 $ 2 $ 33 $ 7 Interest bearing deposits in bank 262 227 177 124 66 790 237 Investment securities - taxabl 4,540 4,694 3,747 3,153 3,114 16,134 12,086 Investment securities - nontaxable (TE 618 648 624 633 652 2,523 2,195 Mortgage loans held for sa l e 1,040 970 764 692 947 3,466 2,593 Loans (TE) 27,901 27,258 25,629 22,418 23,294 103,206 87,727 Purchased non - covered loan 12,129 11,911 10,328 11,840 12,612 46,208 40,020 Purchased non - covered loan pool 3,335 2,997 149 - - 6,481 - Covered loa n s 3,556 3,192 3,385 3,995 4,704 14,128 21,355 Total Earning Asse t s $ 53,386 $ 51,916 $ 44,808 $ 42,859 $ 45,391 $ 192,969 $ 166,220 Accretion Income (included abo v e 2,912 3,037 2,635 3,097 4,280 11,681 12,543 NTEREST EXPENSE Non - interest bearing deposit $ - $ - $ - $ - $ - $ - $ - NOW accoun t s 463 304 318 376 414 1,461 1,317 MMDA 929 877 760 663 768 3,229 2,954 Savings accoun t s 42 42 37 37 45 158 164 Retail CDs < $100,000 594 607 488 513 553 2,202 2,116 Retail CDs > $100,000 659 691 662 691 746 2,703 2,761 Brokered C D s - - - - 34 0 177 Total Deposi t s 2,687 2,521 2,265 2,280 2,560 9,753 9,489 FHLB advanc e s - - 16 15 26 31 140 Other borrowin g s 328 322 346 366 379 1,362 1,760 Subordinated debenture Federal funds purchased and securities sol under agreements to repurchas 924 44 914 39 866 48 832 43 887 41 3,536 174 3,127 164 Total Non - Deposit Funding 1,296 1,275 1,276 1,256 1,333 5,103 5,191 Total Fundi n g $ 3,983 $ 3,796 $ 3,541 $ 3,536 $ 3,893 $ 14,856 $ 14,680 Net Interest Income (T E ) $ 49,403 $ 48,120 $ 41,267 $ 39,323 $ 41,498 $ 178,113 $ 151,540

Dec. Sept. Three Months Ended Twelve Months Ended Jun. Mar. Dec. Dec. Dec. 2015 2015 2015 2015 2014 2015 2014 YIELDS (1) (1) Interest and average rates are calculated on a tax - equivalent basis using an effective tax rate of 3 5 % (2) Rate calculated based on average earning assets. (3) Rate calculated based on total average funding including non - interest bearing liabilit i e 31 AMERIS BANCORP FINANCIAL HIGHLIGHTS (unaudited) (dollars in thousands except per share data and FTE headcount) Federal funds sold 0.36% 1.37% 0.36% 0.29% 0.25% 0.60% 0.24% Interest bearing deposits in banks 0.36% 0.45% 0.35% 0.32% 0.38% 0.37% 0.33% Investment securities - taxable 2.47% 2.41% 2.50% 2.63% 2.68% 2.48% 2.77% Investment securities - nontaxable 3.52% 3.54% 3.54% 3.60% 3.59% 3.55% 3.55% Mortgage loans held for sale 4.18% 3.74% 3.75% 3.70% 3.86% 3.94% 3.64% Loans 4.74% 4.86% 4.87% 4.76% 4.94% 4.77% 5.00% Purchased non - covered loans 6.39% 5.99% 6.33% 7.38% 7.59% 6.49% 7.18% Purchased non - covered loan pools 2.91% 3.68% 3.45% 0.00% 0.00% 3.21% 0.00% Covered loans 7.82% 6.49% 5.51% 6.17% 6.22% 6.83% 6.29% Total Earning Assets 4.30% 4.39% 4.49% 4.79% 5.08% 4.47% 5.03% Noninterest bearing deposit 0.00% 0.00% 0.00% 0.00% 0.00% 0.00% 0.00% NOW accoun t s 0.17% 0.13% 0.17% 0.20% 0.21% 0.17% 0.18% MMDA 0.30% 0.29% 0.31% 0.31% 0.36% 0.30% 0.37% Savings accoun t s 0.07% 0.07% 0.08% 0.09% 0.11% 0.08% 0.11% Retail CDs < $100,000 0.52% 0.50% 0.50% 0.56% 0.57% 0.52% 0.54% Retail CDs > $100,000 0.66% 0.71% 0.70% 0.73% 0.74% 0.70% 0.74% Brokered C D s 0.00% 0.00% 0.00% 0.00% 3.35% 0.00% 3.23% Total Deposi t s 0.23% 0.22% 0.24% 0.27% 0.30% 0.23% 0.30% FHLB advanc e s 0.00% 0.00% 0.37% 0.36% 0.29% 0.37% 0.30% Other borrowin g s 3.34% 3.28% 3.31% 3.38% 3.23% 3.33% 4.42% Subordinated debenture Federal funds purchased and securities sol under agreements to repurchas 5.26% 0.28% 5.22% 0.35% 5.17% 0.33% 5.16% 0.33% 5.40% 0.34% 5.20% 0.34% 5.19% 0.35% Total Non - Deposit Funding 3.01% 3.31% 2.76% 2.85% 2.72% 3.03% 2.67% Total funding ( 3 ) 0.32% 0.32% 0.36% 0.40% 0.43% 0.34% 0.43% Net interest spre a d 3.98% 4.07% 4.13% 4.39% 4.65% 4.13% 4.60% Net interest marg i n 3.98% 4.07% 4.14% 4.39% 4.64% 4.12% 4.59%

32 Three Months Ended Twelve Months Ended AMERIS BANCORP FINANCIAL HIGHLIGHTS (unaudited) (dollars in thousands except per share data and FTE headcount) Three Months Ended Twelve Months Ended Dec. Sept. Jun. Mar. Dec. Dec. Dec. Operating Net Income Reconciliation 2015 2015 2015 2015 2014 2015 2014 Net income available to common shareholders $ 14,148 $ 15,627 $ 1,308 $ 9,764 $ 10,580 $ 40,847 $ 38,437 Merger and conversion charges 1,807 446 5,712 15 67 7,980 3,940 Non - recurring credit resolution related expenses - - 11,241 - - 11,241 - Other non - recurring adjustments - - - - 188 - (682) Tax effect of non - recurring charges (632) (156) (5,934) (5) (89) (6,727) (1,140) Plus: After tax non - recurring charges 1,175 290 11,019 10 (22) 12,494 2,800 Operating Net income 15,323 15,917 12,327 9,774 10,558 53,341 41,237 Operating net income per diluted share: $ 0.47 $ 0.49 $ 0.38 $ 0.32 $ 0.39 $ 1.66 $ 1.57 Return on average assets 1.12% 1.21% 1.11% 0.97% 1.04% 1.11% 1.18% Return on average common tangible equity 14.97% 16.23% 12.83% 10.40% 14.40% 13.66% 16.50% Three Months Ended Twelve Months Ended Net Interest Margin and Yields on Total Loan Dec. 2015 Sept. Jun. 2015 2015 Mar. 2015 Dec. 2014 Dec. Dec. 2015 2014 Excluding Accretion Reconciliatio Total Interest Income (T E ) $ 53,386 $ 51,916 $ 44,808 $ 42,859 $ 45,391 $ 192,969 $ 166,220 Accretion Inco m e 2,912 3,037 2,635 3,097 4,280 11,681 12,543 Total Interest Income (TE) Excluding Accretio $ 50,474 $ 48,879 $ 42,173 $ 39,762 $ 41,111 $ 181,288 $ 153,677 Total Interest Expen s e $ 3,983 $ 3,796 $ 3,541 $ 3,536 $ 3,893 $ 14,856 $ 14,680 Net Interest Income (TE) Excluding Accretio $ 46,491 $ 45,083 $ 38,632 $ 36,226 $ 37,218 $ 166,432 $ 138,997 Yield on Total Loans Excluding Accretio 4.92% 4.83% 4.86% 5.01% 5.05% 4.90% 5.11% Net Interest Margin Excluding Accretio 3.74% 3.81% 3.87% 4.05% 4.17% 3.85% 4.21% Core Earnings Reconciliation Dec. 2015 Sept. 2015 Jun. 2015 Mar. 2015 Dec. 2014 Dec. 2015 Dec. 2014 Pre - tax operating profit/(los s ) Plus: Credit Related Cos t s Provision for loan loss e s $ 17,444 553 $ 22,995 986 $ 1,794 2,656 $ 14,511 1,069 $ 14,747 888 $ 56,744 5,264 $ 56,205 5,648 (Gains)/Losses on the sale of legacy OR E O 535 36 436 110 (228) 1,117 (3) (Gains)/Losses on the sale of covered OR E O 610 56 194 20 344 880 527 Problem loan and OREO expen s e 1,078 991 10,632 3,031 5,175 15,732 12,984 Interest reversed (received) on non - accrual loan 58 17 413 156 (6) 644 405 Total Credit - Related Cos t s 2,834 2,086 14,331 4,386 6,173 23,637 19,561 Plus: Conversion charg e s Less: Non - recurring gai n s Gains on sales of securiti e s 1,807 - 446 (115) 5,712 (10) 15 (12) 67 - 7,980 (137) 3,940 (138) Gains on sales of bank premise (267) - - - - (267) (616) Other non - recurring adjustment - - - - 188 - (682) Pretax, Pre - provision earnin g s $ 21,818 $ 25,412 $ 21,827 $ 18,900 $ 21,175 $ 87,957 $ 78,270 As percentage of average assets, annualize 1.59% 1.93% 1.96% 1.88% 2.09% 1.62% 1.95% Three Months Ended Twelve Months Ended Dec. Sept. Jun. Mar. Dec. Dec. Dec. Recurring Operating Expenses 2015 2015 2015 2015 2014 2015 2014 Total Operating Expens e s Less: Credit costs & non - recurring charge Gains/(Losses) on the sale of legacy OR E O 53,028 (535) 48,396 (36) 56,864 (436) 40,827 (110) 41,733 228 199,115 (1,117) 150,869 3 Gains/(Losses) on the sale of covered OR E O (610) (56) (194) (20) (344) (880) (527) Problem loan and OREO expen s e (1,078) (991) (10,632) (3,031) (5,175) (15,732) (12,984) Severance paymen t s - - - - (188) - (188) Conversion expense (1,807) (446) (5,712) (15) (67) (7,980) (3,940) Gains/(Losses) on the sale of premise 267 - - - - 267 616 Other non - recurring adjustment - - - - (188) - 682 Recurring operating expense $ 49,265 $ 46,867 $ 39,890 $ 37,651 $ 35,999 $ 173,673 $ 134,531

Net income available to common sharehold e r 1,992 $ 3,108 $ 2,247 $ 1,925 $ 1,336 $ 9,272 $ 4,921 $ Warehouse Lending Net income available to common sharehold e r 731 $ 845 $ 925 $ 592 $ 470 $ 3,092 $ 1,280 $ SBA Division: Net income available to common sharehold e r 732 $ 716 $ 854 $ 533 $ 521 $ 2,835 $ 2,274 $ Total Consolidated Net income available to common sharehold e r 14,148 $ 15,627 $ 1,308 $ 9,764 $ 10,580 $ 40,847 $ 38,437 $ AMERIS BANCORP FINANCIAL HIGHLIGHTS (unaudited) (dollars in thousands except per share data and FTE headcount) 33 Three Months Ended Twelve Months Ended Dec. Sept. Jun. Mar. Dec. Dec. Dec. Segment Reporting 2015 2015 2015 2015 2014 2015 2014 Banking Division Net interest inco m e $ 44,088 $ 43,044 $ 36,806 $ 35,839 $ 38,045 $ 159,777 $ 140,460 Provision for loan loss e s 504 960 2,456 927 737 4,847 4,822 Noninterest inco m e Noninterest expense Salaries and employee benefit 12,739 19,225 13,470 17,921 9,262 15,675 8,780 15,362 8,595 14,196 44,251 68,183 32,337 55,101 Occupancy 5,356 5,444 4,376 4,144 4,319 19,320 16,097 Data Processing 5,759 4,998 3,913 4,011 3,901 18,681 14,436 Other expens e s 13,853 11,379 24,048 10,356 12,320 59,636 39,175 Total noninterest expen s e 44,193 39,742 48,012 33,873 34,736 165,820 124,809 Income before income taxe 12,130 15,812 (4,400) 9,819 11,167 33,361 43,166 Income T a x 1,436 4,854 (1,682) 3,105 2,914 7,713 12,918 Net inco m e 10,694 10,958 (2,718) 6,714 8,253 25,648 30,248 Preferred stock dividend - - - - - - 286 Net income available to common sharehold e r $ 10,694 $ 10,958 $ (2,718) $ 6,714 $ 8,253 $ 25,648 $ 29,962 Retail Mortgage Division Net interest inco m e $ 2,812 $ 2,485 $ 1,979 $ 1,545 $ 1,822 $ 8,821 $ 5,344 Provision for loan loss e s 49 26 200 142 151 417 826 Noninterest inco m e Noninterest expense Salaries and employee benefit 7,966 5,855 9,827 6,138 9,095 5,592 7,610 4,527 6,076 4,175 34,498 22,112 24,959 15,918 Occupancy 501 397 396 380 373 1,674 1,342 Data Processing 266 308 279 212 315 1,065 1,043 Other expens e s 1,043 662 1,150 932 828 3,787 3,603 Total noninterest expen s e 7,665 7,505 7,417 6,051 5,691 28,638 21,906 Income before income taxe 3,064 4,781 3,457 2,962 2,056 14,264 7,571 Income T a x 1,072 1,673 1,210 1,037 720 4,992 2,650 Net inco m e 1,992 3,108 2,247 1,925 1,336 9,272 4,921 Preferred stock dividend - - - - - - - Net interest inco m e $ 995 $ 1,128 $ 1,179 $ 835 $ 752 $ 4,137 $ 2,016 Provision for loan loss e s - - - - - - - Noninterest inco m e 336 372 383 273 237 1,364 655 Noninterest expense Salaries and employee benefit 156 137 99 127 84 519 255 Occupancy 3 1 1 2 - 7 1 Data Processing 20 22 20 33 11 95 54 Other expens e s 28 40 19 36 171 123 392 Total noninterest expen s e 207 200 139 198 266 744 702 Income before income taxe 1,124 1,300 1,423 910 723 4,757 1,969 Income T a x 393 455 498 319 253 1,665 689 Net inco m e 731 845 925 592 470 3,092 1,280 Preferred stock dividend - - - - - - - Net interest inco m e $ 723 $ 742 $ 724 $ 613 $ 387 $ 2,802 $ 2,066 Provision for loan loss e s - - - - - - - Noninterest inco m e 1,366 1,309 1,886 912 1,454 5,473 4,885 Noninterest expense Salaries and employee benefit 736 738 1,099 616 861 3,189 2,604 Occupancy 57 73 36 28 25 194 81 Data Processing 1 1 2 4 2 8 18 Other expens e s 169 137 159 57 152 522 749 Total noninterest expen s e 963 949 1,296 705 1,040 3,913 3,452 Income before income taxe 1,126 1,102 1,314 820 801 4,362 3,499 Income T a x 394 386 460 287 280 1,527 1,225 Net inco m e 732 716 854 533 521 2,835 2,274 Preferred stock dividend - - - - - - - Net interest inco m e $ 48,618 $ 47,399 $ 40,688 $ 38,832 $ 41,006 $ 175,537 $ 149,886 Provision for loan loss e s 553 986 2,656 1,069 888 5,264 5,648 Noninterest inco m e 22,407 24,978 20,626 17,575 16,362 85,586 62,836 Noninterest expense Salaries and employee benefit 25,972 24,934 22,465 20,632 19,316 94,003 73,878 Occupancy 5,917 5,915 4,809 4,554 4,717 21,195 17,521 Data Processing 6,046 5,329 4,214 4,260 4,229 19,849 15,551 Other expens e s 15,093 12,218 25,376 11,381 13,471 64,068 43,919 Total noninterest expen s e 53,028 48,396 56,864 40,827 41,733 199,115 150,869 Income before income taxe 17,444 22,995 1,794 14,511 14,747 56,744 56,205 Income T a x 3,296 7,368 486 4,747 4,167 15,897 17,482 Net inco m e 14,148 15,627 1,308 9,764 10,580 40,847 38,723 Preferred stock dividend - - - - - - 286
Ameris Bancorp (NASDAQ:ABCB)
Historical Stock Chart
From Mar 2024 to Apr 2024

Ameris Bancorp (NASDAQ:ABCB)
Historical Stock Chart
From Apr 2023 to Apr 2024
