UNITED STATES
SECURITIES AND EXCHANGE COMMISSION
Washington, D.C. 20549
FORM 8-K
CURRENT REPORT
Pursuant
to Section 13 or 15(d)
of the Securities Exchange Act of 1934
Date of Report (Date of earliest event reported): January 13, 2016
CECO Environmental Corp.
(Exact Name of registrant as specified in its charter)
|
|
|
|
|
| Delaware |
|
000-7099 |
|
13-2566064 |
| (State or other jurisdiction
of in corporation) |
|
(Commission
File Number) |
|
(IRS Employer
Identification No.) |
|
|
|
| 4625 Red Bank Road
Cincinnati, OH |
|
45227 |
| (Address of principal executive offices) |
|
(Zip Code) |
Registrant’s telephone number, including area code: (513) 458-2600
Not applicable
(Former
Name or Former Address, if Changed Since Last Report)
Check the appropriate box below
if the Form 8-K filing is intended to simultaneously satisfy the filing obligation of the registrant under any of the following provisions:
| ¨ |
Written communications pursuant to Rule 425 under the Securities Act (17 CFR 230.425) |
| ¨ |
Soliciting material pursuant to Rule 14a-12 under the Exchange Act (17 CFR 240.14a-12) |
| ¨ |
Pre-commencement communications pursuant to Rule 14d-2(b) under the Exchange Act (17 CFR 240.14d-2(b)) |
| ¨ |
Pre-commencement communications pursuant to Rule 13e-4(c) under the Exchange Act (17 CFR 240.13e-4(c)) |
Item 7.01 Regulation FD Disclosure.
CECO
Environmental Corp.’s President & CEO, Jeff Lang, as well as Ed Prajzner, CFO and Secretary, and Tracy Krumme, Vice President of Investor Relations, will give presentations to investors on January 13 and 14, 2016. A copy of the
slide presentation they will use in their presentations is furnished as Exhibit 99.1 to this Current Report, and is incorporated herein by this reference.
The information furnished herewith pursuant to Item 7.01 of this Current Report, including Exhibit 99.1, shall not be deemed to be “filed” for
the purposes of Section 18 of the Securities Exchange Act of 1934, as amended (the “Exchange Act”), or otherwise subject to the liabilities of that section. The information in Item 7.01 of this Current Report shall not be
incorporated by reference into any filing under the Securities Act of 1933, as amended, or the Exchange Act, whether made before or after the date of this Current Report, regardless of any general incorporation language in the filing.
Item 9.01 Financial Statements and Exhibits
(d) Exhibits
|
|
|
| Exhibit
Number |
|
Exhibit Title |
|
|
| 99.1 |
|
Investor Presentation, dated January 14, 2016. |
Signatures
Pursuant to
the requirements of the Securities Exchange Act of 1934, the registrant has duly caused this report to be signed on its behalf by the undersigned hereunto duly authorized.
|
|
|
|
|
|
|
| Date: January 13, 2016 |
|
|
|
CECO Environmental Corp. |
|
|
|
|
|
|
|
|
By: |
|
/s/ Edward J. Prajzner |
|
|
|
|
|
|
Edward J. Prajzner |
|
|
|
|
|
|
Chief Financial Officer |
Exhibit Index
|
|
|
| Exhibit
Number |
|
Exhibit Title |
|
|
| 99.1 |
|
Investor Presentation, dated January 14, 2016. |
Exhibit 99.1
ENVIRONMENTAL A global industrial technology company focused on Environmental, energy, fluid handling and filtration industries NEEDHAM GROWTH CONFERENCE January 14, 2016
NOTES TO INVESTORS Forward-Looking Statements and Non-GAAP Information Any statements contained in this presentation other than statements of historical fact, including statements about
management’s beliefs and expectations, are forward-looking statements and should be evaluated as such. These statements are made on the basis of management’s views and assumptions regarding future events and business performance. Words
such as “estimate,” “believe,” “anticipate,” “expect,” “intend,” “plan,” “target,” “project,” “should,” “may,” “will” and similar
expressions are intended to identify forward-looking statements. Forward-looking statements (including oral representations) involve risks and uncertainties that may cause actual results to differ materially from any future results, performance or
achievements expressed or implied by such statements. These risks and uncertainties include, but are not limited to: our ability to successfully integrate acquired businesses and realize the synergies from acquisitions, including PMFG, as well as a
number of factors related to our business including economic and financial market conditions generally and economic conditions in CECO’s service areas; dependence on fixed price contracts and the risks associated therewith, including actual
costs exceeding estimates and method of accounting for contract revenue; fluctuations in operating results from period to period due to seasonality of the business; the effect of growth on CECO’s infrastructure, resources, and existing sales;
the ability to expand operations in both new and existing markets; the potential for contract delay or cancellation; changes in or developments with respect to any litigation or investigation; the potential for fluctuations in prices for
manufactured components and raw materials; the substantial amount of debt incurred in connection with our recent acquisitions and our ability to repay or refinance it or incur additional debt in the future; the impact of federal, state or local
government regulations; economic and political conditions generally; and the effect of competition in the product recovery, air pollution control and fluid handling and filtration industries. These and other risks and uncertainties are discussed in
more detail in CECO’s filings with the Securities and Exchange Commission, including our reports on Form 10-K and Form 10-Q. Many of these risks are beyond management’s ability to control or predict. Should one or more of these risks or
uncertainties materialize, or should the assumptions prove incorrect, actual results may vary in material aspects from those currently anticipated. Investors are cautioned not to place undue reliance on such forward-looking statements as they speak
only to our views as of the date the statement is made. All forward-looking statements attributable to CECO or persons acting on behalf of CECO are expressly qualified in their entirety by the cautionary statements and risk factors contained in this
presentation and CECO’s respective filings with the Securities and Exchange Commission. Furthermore, forward-looking statements speak only as of the date they are made. Except as required under the federal securities laws or the rules and
regulations of the Securities and Exchange Commission, CECO undertakes no obligation to update or review any forward-looking statements, whether as a result of new information, future events or otherwise. While CECO reports its results in accordance
with generally accepted accounting principles in the U.S. (GAAP), comments made during this conference call and these materials will include the following “non-GAAP” measures: Non-GAAP gross margin, non-GAAP operating income, non-GAAP net
income, non-GAAP adjusted EBITDA, non-GAAP gross profit margin, non-GAAP operating margin, non-GAAP earnings per basic and diluted share, and selected measures expressed on a constant currency basis. These measures are included to provide additional
useful information regarding CECO’s financial results and are not a substitute for their comparable GAAP measures. Explanations of these non-GAAP measures and reconciliations of these non-GAAP measures to their directly comparable GAAP measures
are included in the accompanying “Supplementary Non-GAAP Materials.” Descriptions of many of these non-GAAP measures are also included in CECO’s SEC reports.
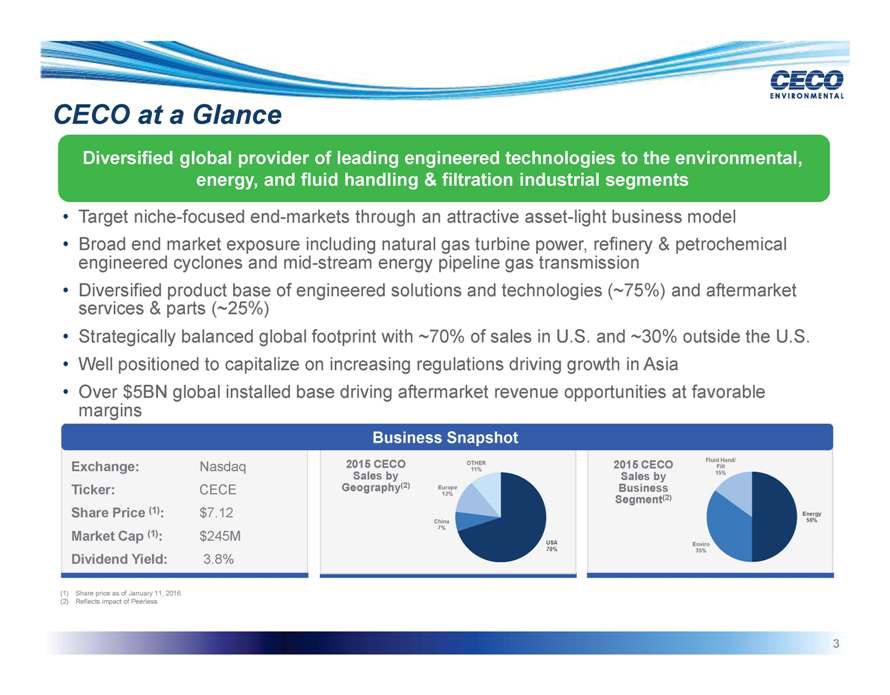
CECO at a Glance Diversified global provider of leading engineered technologies to the environmental, energy, and fluid handling & filtration industrial segments • Target
niche-focused end-markets through an attractive asset-light business model • Broad end market exposure including natural gas turbine power, refinery & petrochemical engineered cyclones and mid-stream energy pipeline gas transmission
• Diversified product base of engineered solutions and technologies (~75%) and aftermarket services & parts (~25%) • Strategically balanced global footprint with ~70% of sales in U.S. and ~30% outside the U.S. • Well
positioned to capitalize on increasing regulations driving growth in Asia • Over $5BN global installed base driving aftermarket revenue opportunities at favorable margins Business Snapshot Exchange: Nasdaq Ticker: CECE Share Price (1): $ 7.12
Market Cap (1): $ 245M Dividend Yield: 3.8% 2015 CECO Sales by Geography(2) 2015 CECO Sales by Business Segment(2)
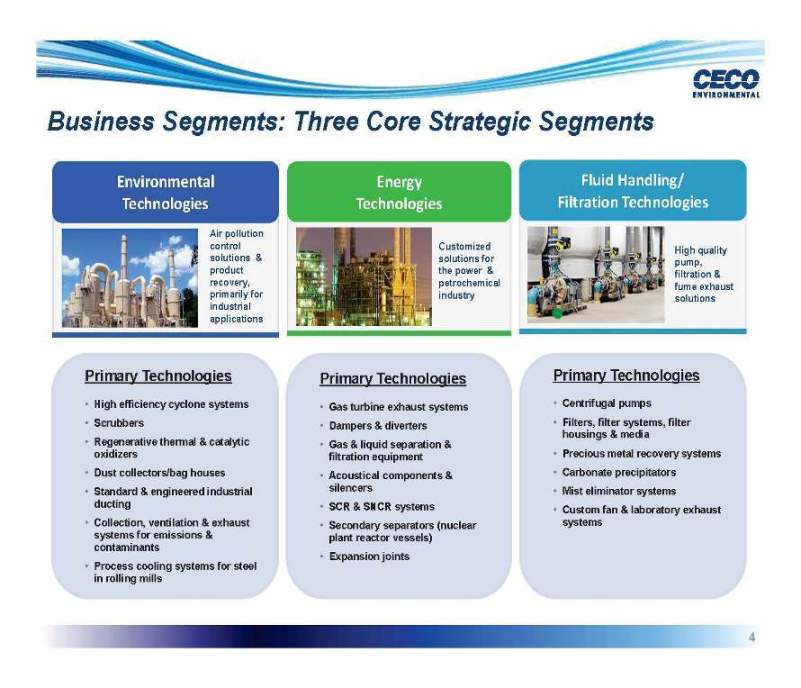
Business Segments: Three Core Strategic Segments Environmental Technologies Air pollution control solutions & product recovery, primarily for industrial applications Energy
Technologies Customized solutions for the power & petrochemical industry Fluid Handling/ Filtration Technologies High quality pump, filtration & fume exhaust solutions Primary Technologies • High efficiency cyclone systems
• Scrubbers • Regenerative thermal & catalytic oxidizers • Dust collectors/bag houses • Standard & engineered industrial ducting • Collection, ventilation & exhaust systems for emissions &
contaminants • Process cooling systems for steel in rolling mills Primary Technologies • Gas turbine exhaust systems • Dampers & diverters • Gas & liquid separation & filtration equipment •
Acoustical components & silencers • SCR & SNCR systems • Secondary separators (nuclear plant reactor vessels) • Expansion joints Primary Technologies • Centrifugal pumps • Filters, filter systems, filter
housings & media • Precious metal recovery systems • Carbonate precipitators • Mist eliminator systems • Custom fan & laboratory exhaust systems
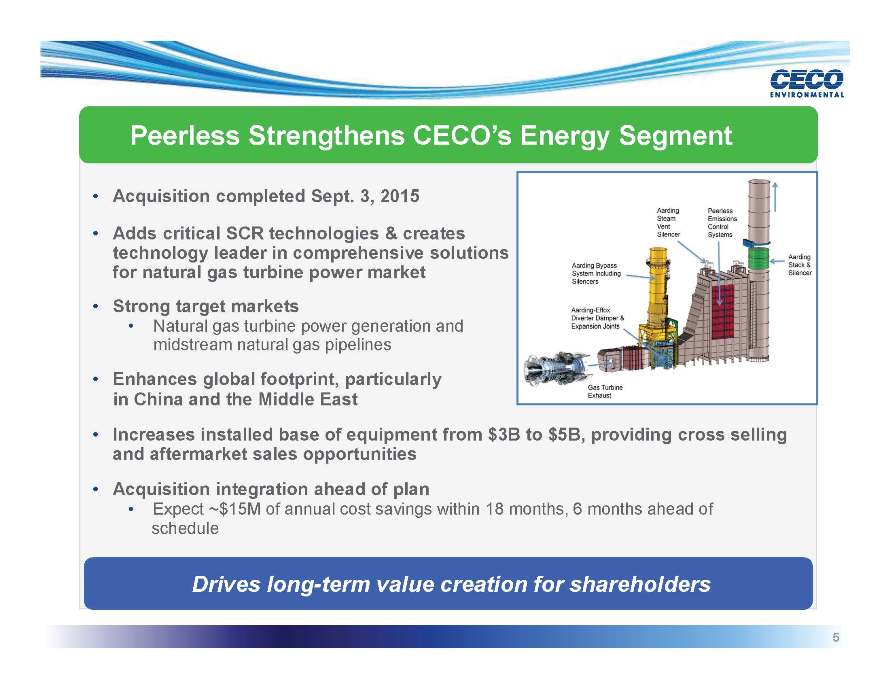
Peerless Strengthens CECO’s Energy Segment • Acquisition completed Sept. 3, 2015 • Adds critical SCR technologies & creates technology leader in comprehensive
solutions for natural gas turbine power market • Strong target markets • Natural gas turbine power generation and midstream natural gas pipelines • Enhances global footprint, particularly in China and the Middle East • Increases
installed base of equipment from $3B to $5B, providing cross selling and aftermarket sales opportunities • Acquisition integration ahead of plan • Expect ~$15M of annual cost savings within 18 months, 6 months ahead of schedule Drives
long-term value creation for shareholders
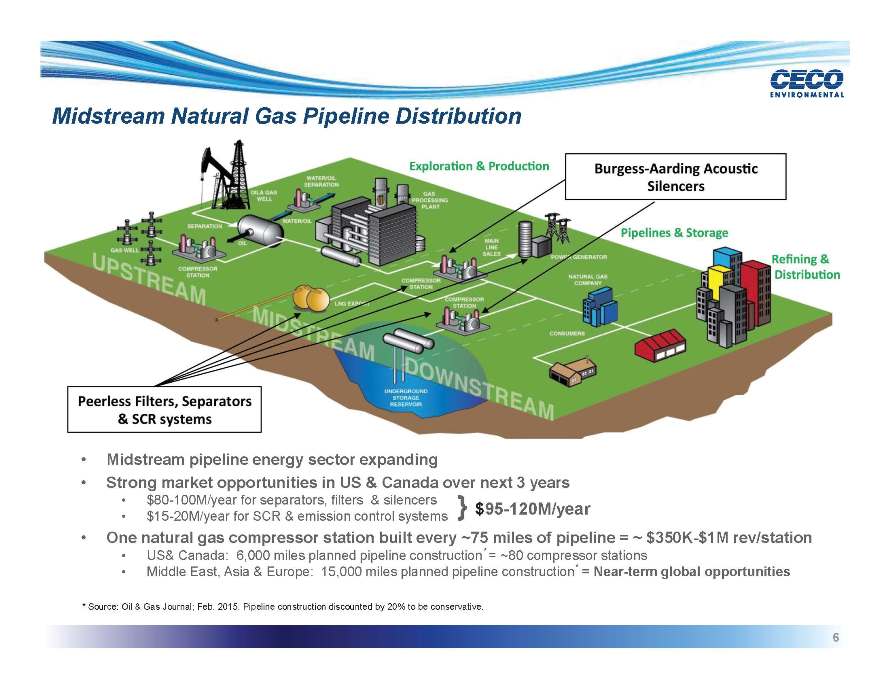
Midstream Natural Gas Pipeline Distribution • Midstream pipeline energy sector expanding • Strong market opportunities in US & Canada over next 3 years •
$80-100M/year for separators, filters & silencers } $95-120M/year • $15-20M/year for SCR & emission control systems • One natural gas compressor station built every ~75 miles of pipeline = ~ $350K-$1M rev/station •
US& Canada: 6,000 miles planned pipeline construction* = ~80 compressor stations • Middle East, Asia & Europe: 15,000 miles planned pipeline construction* = Near-term global opportunities * Source: Oil & Gas Journal; Feb.
2015. Pipeline construction discounted by 20% to be conservative.
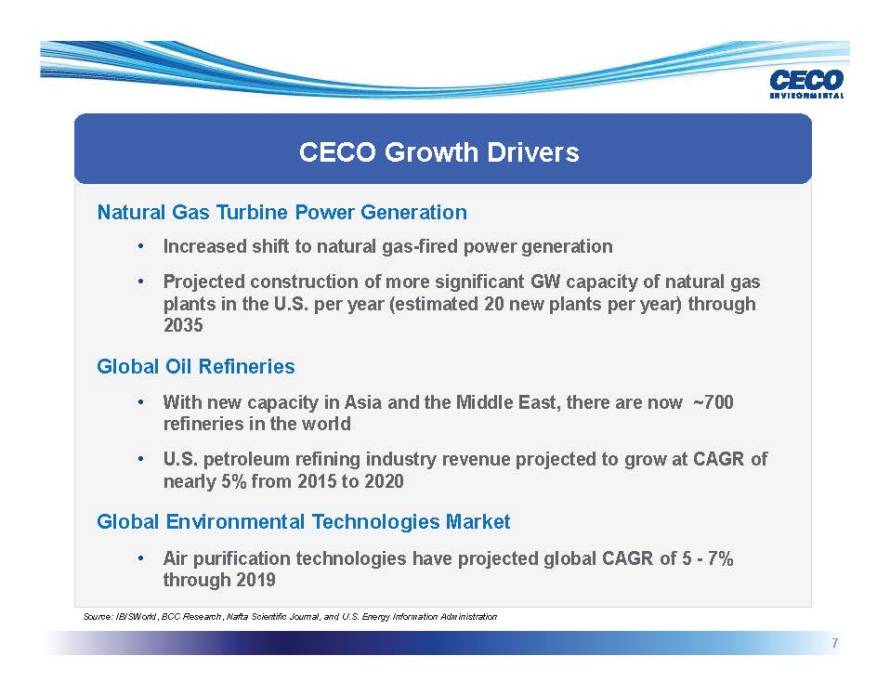
CECO Growth Drivers Natural Gas Turbine Power Generation • Increased shift to natural gas-fired power generation • Projected construction of more significant GW capacity of
natural gas plants in the U.S. per year (estimated 20 new plants per year) through 2035 Global Oil Refineries • With new capacity in Asia and the Middle East, there are now ~700 refineries in the world • U.S. petroleum refining industry
revenue projected to grow at CAGR of nearly 5% from 2015 to 2020 Global Environmental Technologies Market • Air purification technologies have projected global CAGR of 5—7% through 2019 Source: IBISWorld, BCC Research, Nafta Scientific
Journal, and U.S. Energy Information Administration
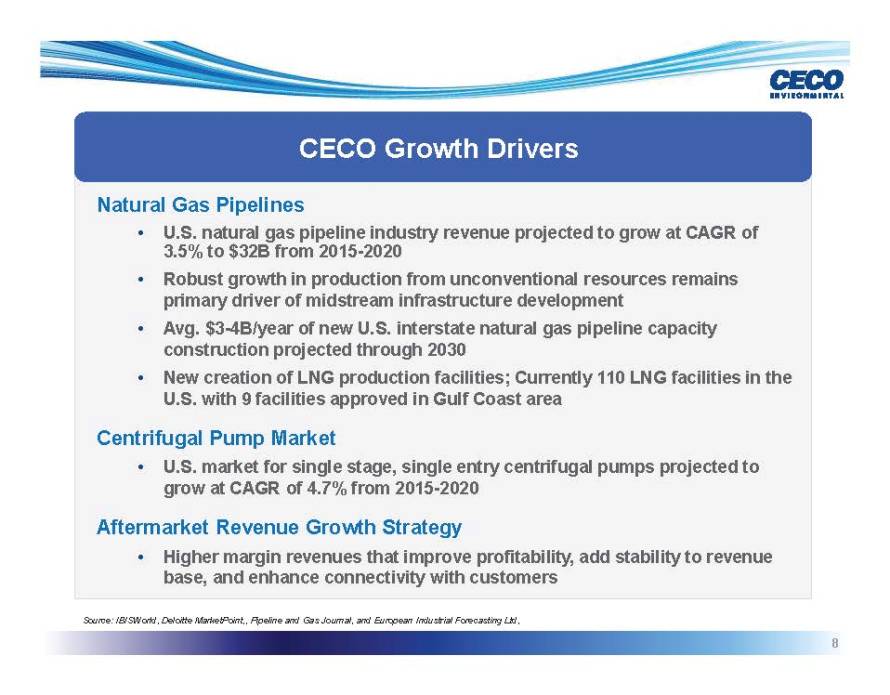
CECO Growth Drivers Natural Gas Pipelines • U.S. natural gas pipeline industry revenue projected to grow at CAGR of 3.5% to $32B from 2015-2020 • Robust growth in production from
unconventional resources remains primary driver of midstream infrastructure development • Avg. $3-4B/year of new U.S. interstate natural gas pipeline capacity construction projected through 2030 • New creation of LNG production facilities;
Currently 110 LNG facilities in the U.S. with 9 facilities approved in Gulf Coast area Centrifugal Pump Market • U.S. market for single stage, single entry centrifugal pumps projected to grow at CAGR of 4.7% from 2015-2020 Aftermarket Revenue
Growth Strategy • Higher margin revenues that improve profitability, add stability to revenue base, and enhance connectivity with customers Source: IBISWorld, Deloitte MarketPoint,, Pipeline and Gas Journal, and European Industrial Forecasting
Ltd,
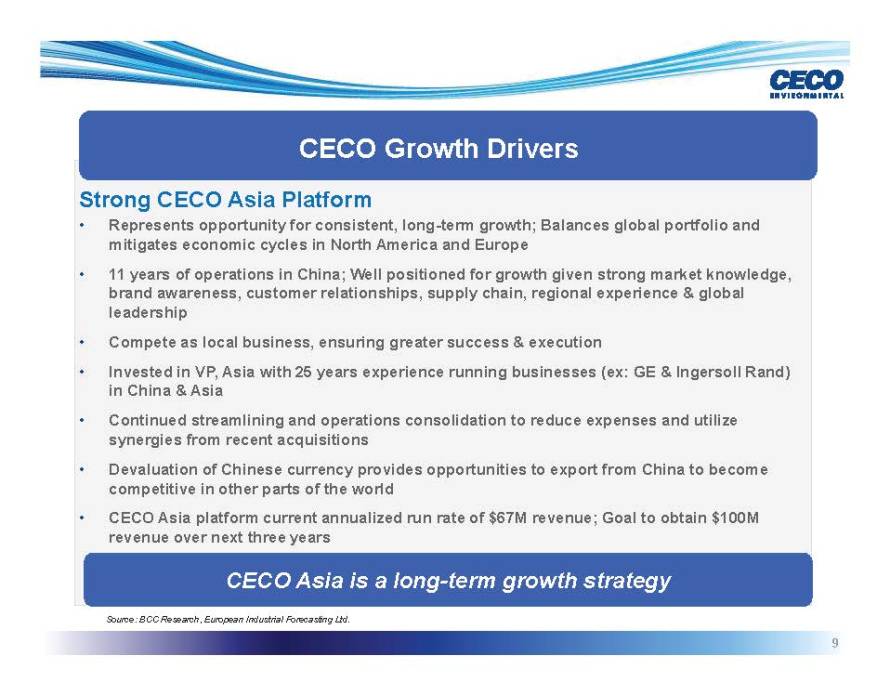
CECO Growth Drivers Strong CECO Asia Platform • Represents opportunity for consistent, long-term growth; Balances global portfolio and mitigates economic cycles in North America and
Europe • 11 years of operations in China; Well positioned for growth given strong market knowledge, brand awareness, customer relationships, supply chain, regional experience & global leadership • Compete as local business,
ensuring greater success & execution • Invested in VP, Asia with 25 years experience running businesses (ex: GE & Ingersoll Rand) in China & Asia • Continued streamlining and operations consolidation to reduce
expenses and utilize synergies from recent acquisitions • Devaluation of Chinese currency provides opportunities to export from China to become competitive in other parts of the world • CECO Asia platform current annualized run rate of
$67M revenue; Goal to obtain $100M revenue over next three years CECO Asia is a long-term growth strategy Source: BCC Research, European Industrial Forecasting Ltd.
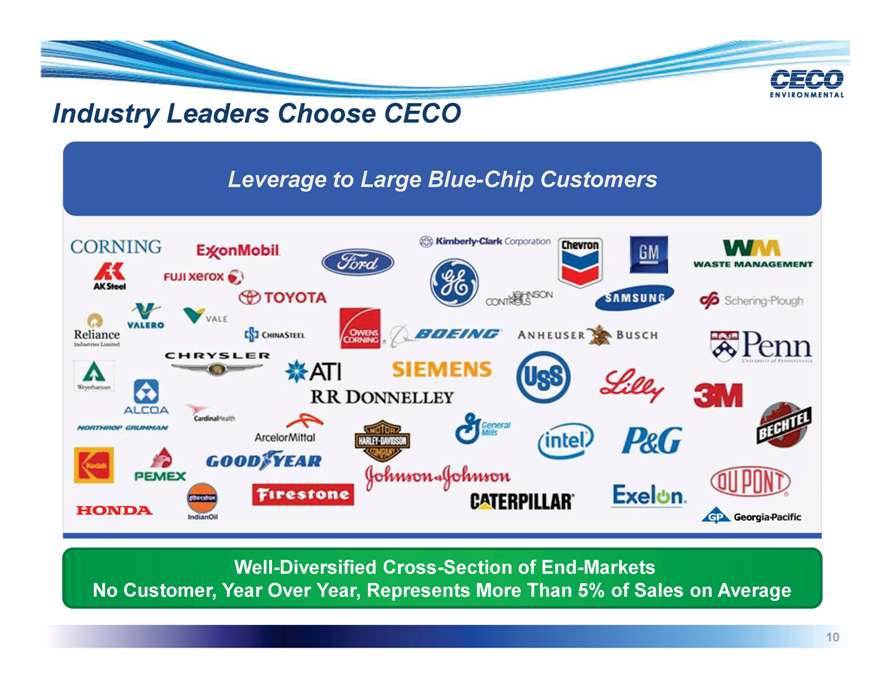
Industry Leaders Choose CECO Leverage to Large Blue-Chip Customers Well-Diversified Cross-Section of End-Markets No Customer, Year Over Year, Represents More Than 5% of Sales on Average
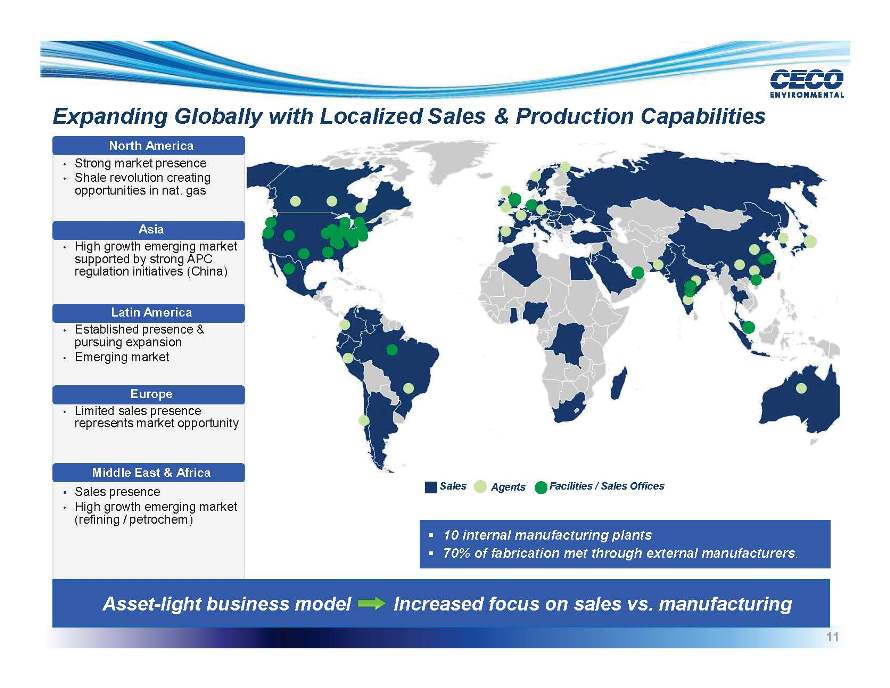
Expanding Globally with Localized Sales & Production Capabilities North America • Strong market presence • Shale revolution creating opportunities in nat. gas Asia
• High growth emerging market supported by strong APC regulation initiatives (China) Latin America • Established presence & pursuing expansion • Emerging market Europe • Limited sales presence represents market
opportunity Middle East & Africa • Sales presence • High growth emerging market (refining / petrochem) Sales Agents Facilities / Sales Offices n 10 internal manufacturing plants n 70% of fabrication met through external manufacturers. Asset-light business model Increased focus on sales vs. manufacturing
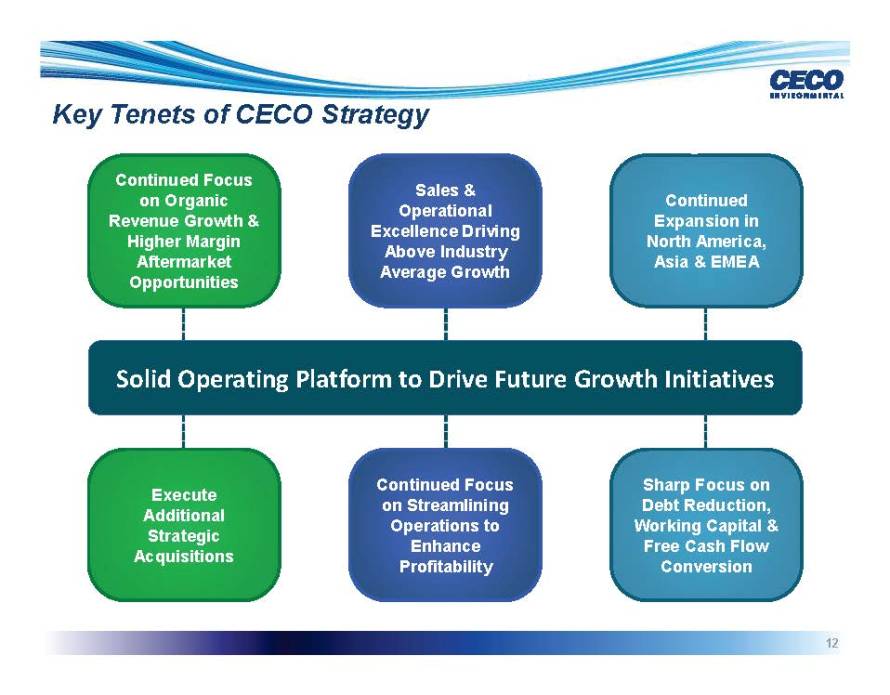
Key Tenets of CECO Strategy Continued Focus on Organic Continued Focus Sales & on Organic Continued Operational Revenue Growth & Expansion in Excellence Driving Higher
Margin North America, Above Industry Aftermarket Asia & EMEA Average Growth Opportunities Solid Operating Platform to Drive Future Growth Initiatives Continued Focus Sharp Focus on Execute on Streamlining Debt Reduction, Additional
Operations to Working Capital & Strategic Enhance Free Cash Flow Acquisitions Profitability Conversion
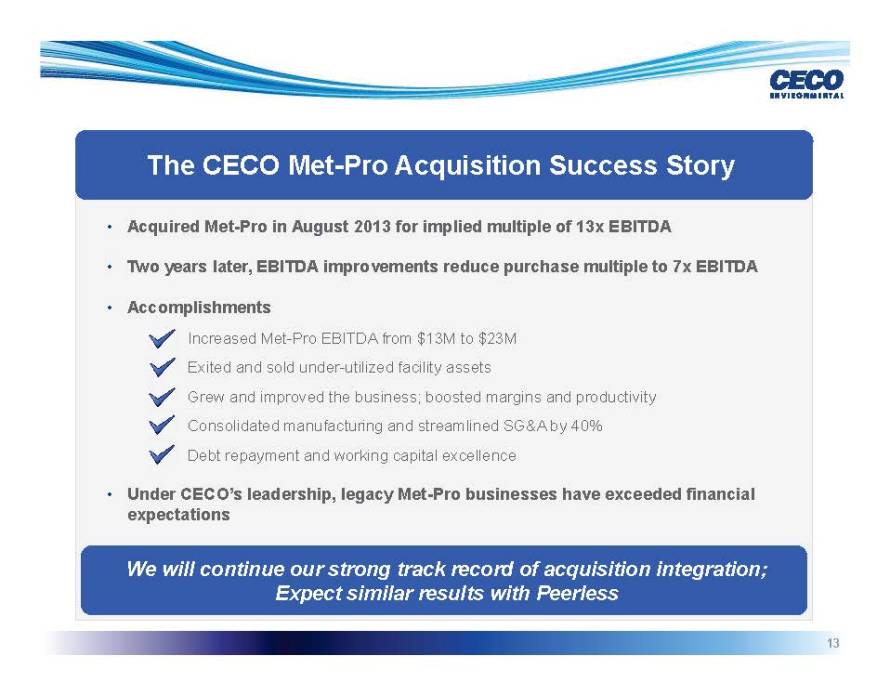
The CECO Met-Pro Acquisition Success Story • Acquired Met-Pro in August 2013 for implied multiple of 13x EBITDA • Two years later, EBITDA improvements reduce purchase multiple to
7x EBITDA • Accomplishments Increased Met-Pro EBITDA from $13M to $23M Exited and sold under-utilized facility assets Grew and improved the business; boosted margins and productivity Consolidated manufacturing and streamlined SG&A by 40%
Debt repayment and working capital excellence • Under CECO’s leadership, legacy Met-Pro businesses have exceeded financial expectations We will continue our strong track record of acquisition integration; Expect similar results with
Peerless
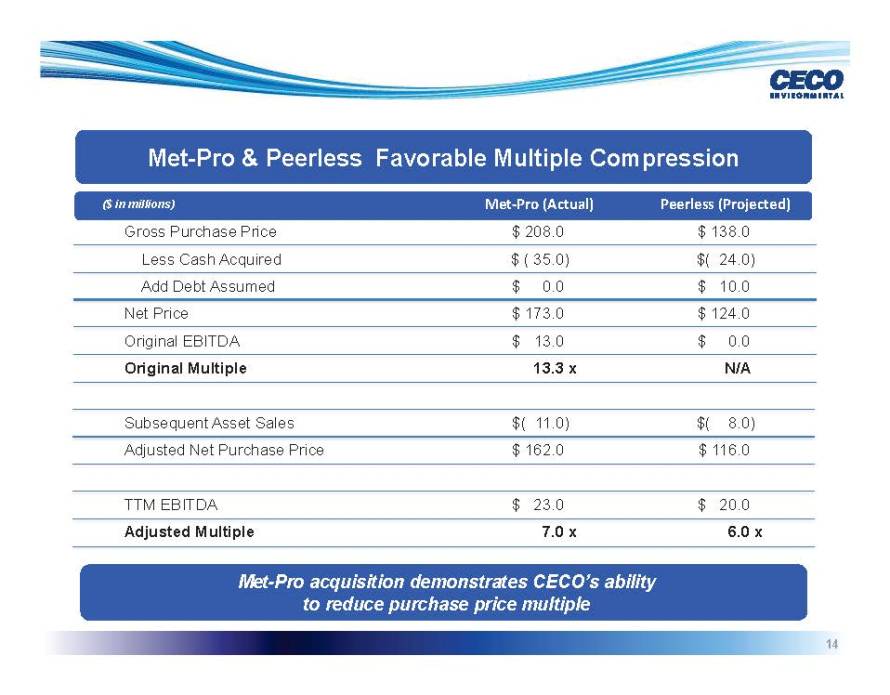
Met-Pro & Peerless Favorable Multiple Compression ($ in millions) Met-Pro (Actual) Peerless (Projected) Gross Purchase Price $ 208.0 $ 138.0 Less Cash Acquired $ ( 35.0) $( 24.0)
Add Debt Assumed $ 0.0 $ 10.0 Net Price $ 173.0 $ 124.0 Original EBITDA $ 13.0 $ 0.0 Original Multiple 13.3 x N/A Subsequent Asset Sales $ ( 11.0) $( 8.0) Adjusted Net Purchase Price $ 162.0 $ 116.0 TTM EBITDA $ 23.0 $ 20.0 Adjusted Multiple 7.0 x
6.0 x Met-Pro acquisition demonstrates CECO’s ability to reduce purchase price multiple
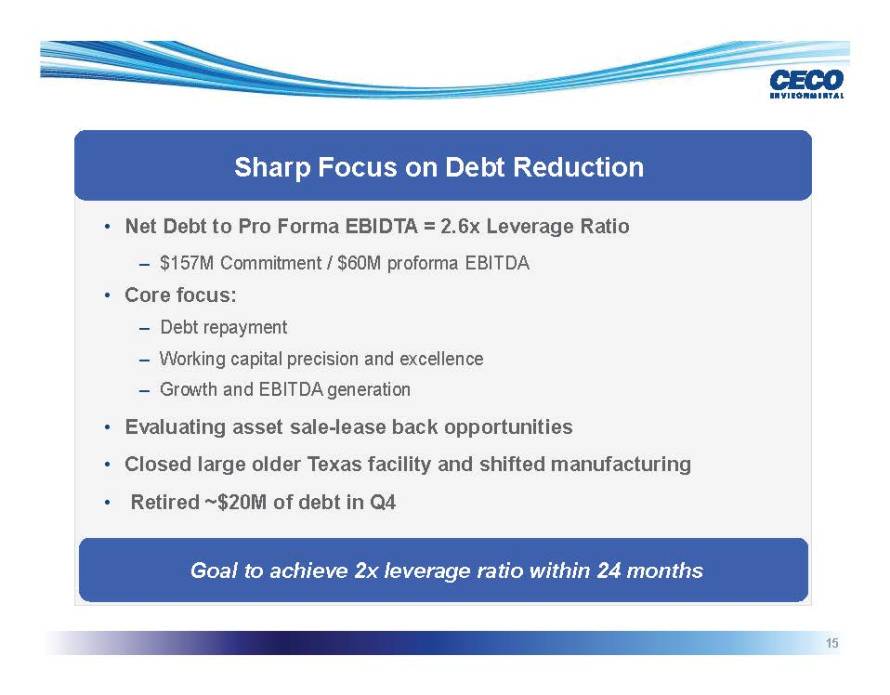
Sharp Focus on Debt Reduction • Net Debt to Pro Forma EBIDTA = 2.6x Leverage Ratio – $157M Commitment / $60M proforma EBITDA • Core focus: – Debt repayment –
Working capital precision and excellence – Growth and EBITDA generation • Evaluating asset sale-lease back opportunities • Closed large older Texas facility and shifted manufacturing • Retired ~$20M of debt in Q4 Goal to achieve
2x leverage ratio within 24 months
ENVIRONMENTAL A global industrial technology company focused on Environmental, energy, fluid handling and filtration industries FINANCIAL OVERVIEW
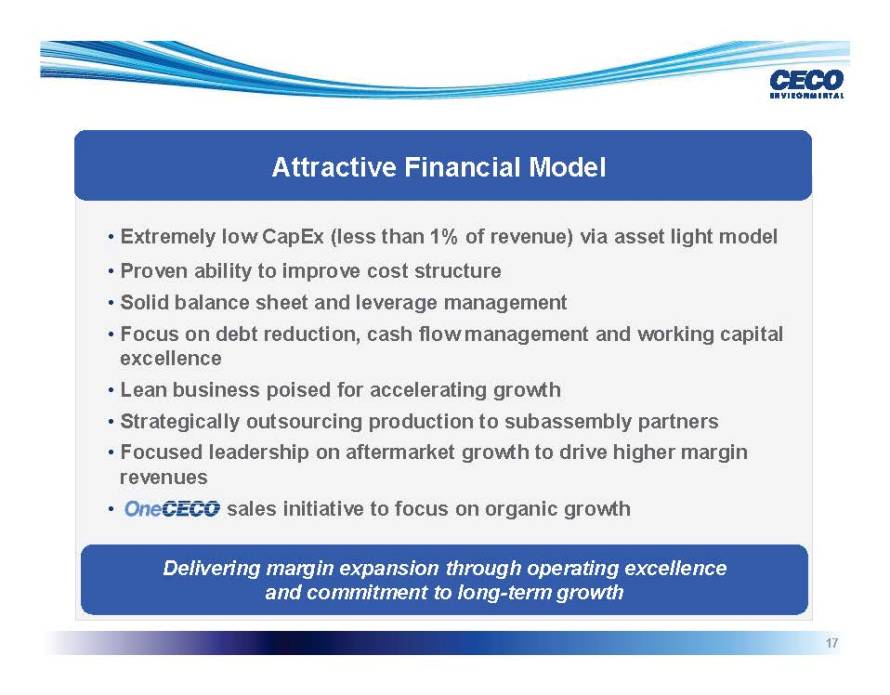
Attractive Financial Model • Extremely low CapEx (less than 1% of revenue) via asset light model • Proven ability to improve cost structure • Solid balance sheet and
leverage management • Focus on debt reduction, cash flow management and working capital excellence • Lean business poised for accelerating growth • Strategically outsourcing production to subassembly partners • Focused leadership
on aftermarket growth to drive higher margin revenues • sales initiative to focus on organic growth Delivering margin expansion through operating excellence and commitment to long-term growth
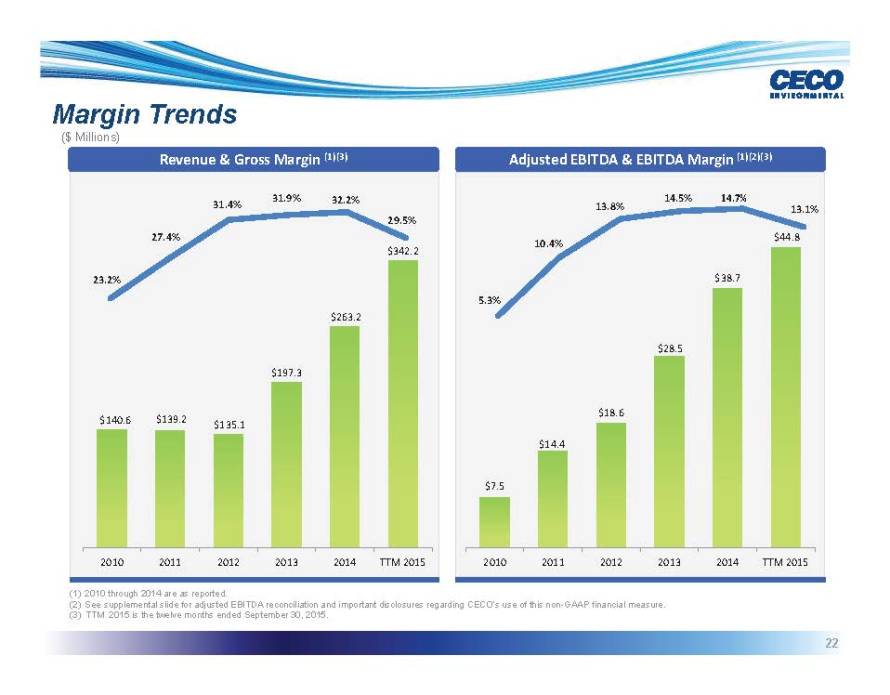
Margin Trends ($ Millions) Revenue & Gross Margin (1)(3) Adjusted EBITDA & EBITDA Margin (1)(2)(3) (1) 2010 through 2014 are as reported. (2) See
supplemental slide for adjusted EBITDA reconciliation and important disclosures regarding CECO’s use of this non-GAAP financial measure. (3) TTM 2015 is the twelve months ended September 30, 2015.
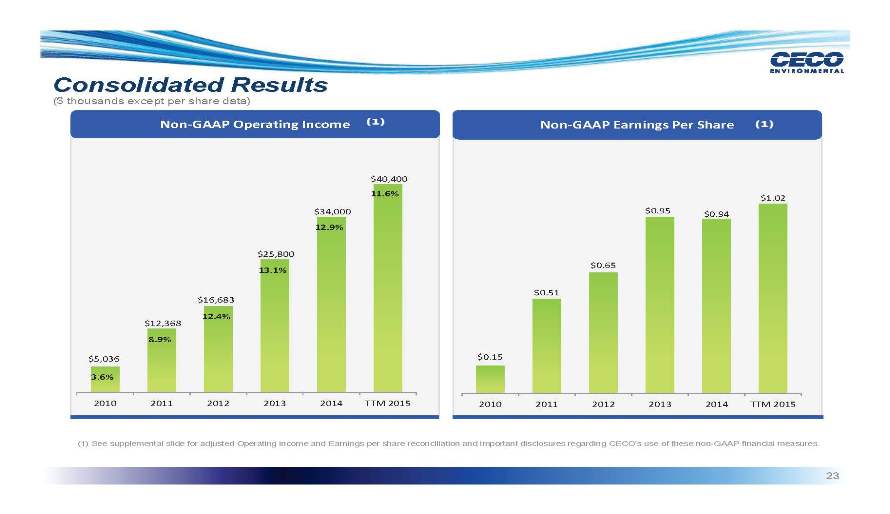
Consolidated Results ($ thousands except per share data) Non-GAAP Operating Income Non-GAAP Earnings Per Share $40,400 11.6% $1.02 $34,000 $0.95 $0.94 12.9% $25,800 $0.65 13.1% $0.51
$16,683 12.4% $12,368 8.9% $5,036 $0.15 3.6% 2010 2011 2012 2013 2014 TTM 2015 2010 2011 2012 2013 2014 TTM 2015 (1) See supplemental slide for adjusted Operating income and Earnings per share reconciliation and important disclosures regarding
CECO’s use of these non-GAAP financial measures.
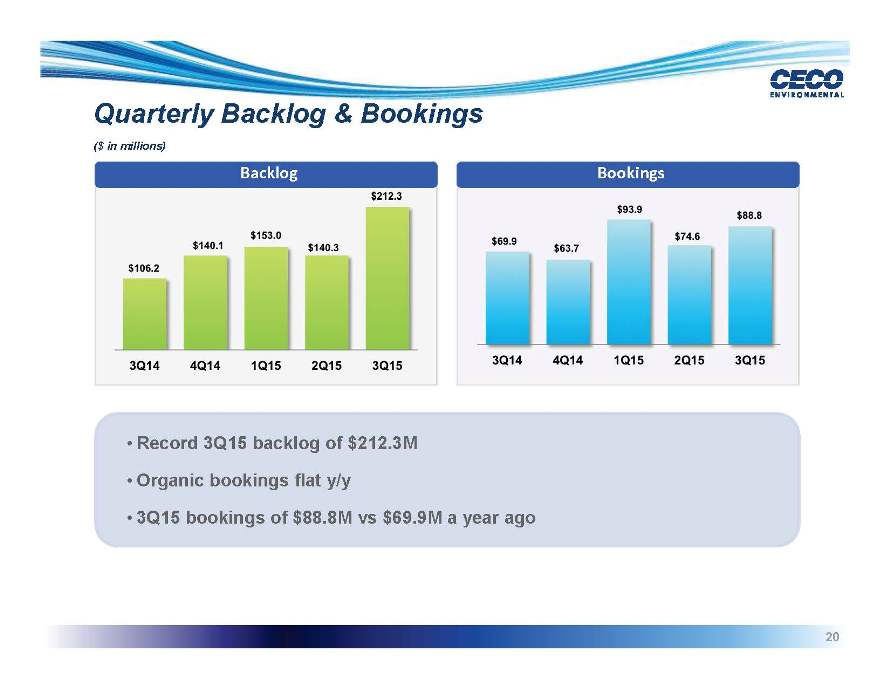
Quarterly Backlog & Bookings ($ in millions) Bookings • Record 3Q15 backlog of $212.3M • Organic bookings flat y/y • 3Q15 bookings of $88.8M vs $69.9M a year ago
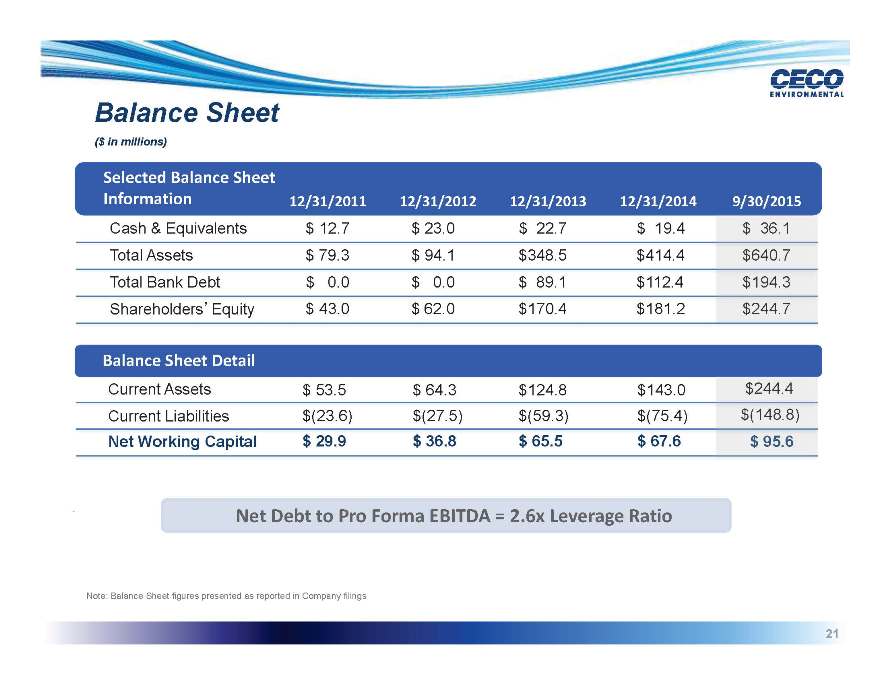
Balance Sheet ($ in millions) Selected Balance Sheet Information 12/31/2011 12/31/2012 12/31/2013 12/31/2014 9/30/2015 Cash & Equivalents $ 12.7 $ 23.0 $ 22.7 $ 19.4 Total Assets
$ 79.3 $ 94.1 $ 348.5 $ 414.4 Total Bank Debt $ 0.0 $ 0.0 $ 89.1 $ 112.4 Shareholders’Equity $ 43.0 $ 62.0 $ 170.4 $ 181.2 Balance Sheet Detail Current Assets $ 53.5 $ 64.3 $ 124.8 $143.0 Current Liabilities $(23.6) $ (27.5) $
(59.3) $(75.4) Net Working Capital $ 29.9 $ 36.8 $ 65.5 $ 67.6 . Net Debt to Pro Forma EBITDA = 2.6x Leverage Ratio Note: Balance Sheet figures presented as reported in Company filings
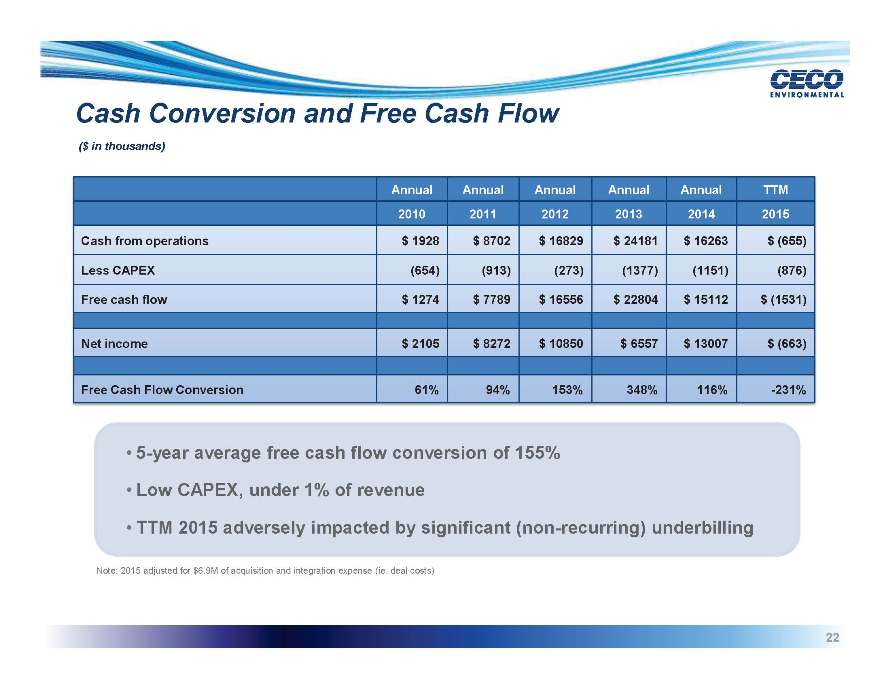
Cash Conversion and Free Cash Flow ($ in thousands) Annual Annual Annual Annual Annual TTM 2010 2011 2012 2013 2014 2015 Cash from operations $ 1928 $ 8702 $ 16829 $ 24181 $ 16263 $
(655) Less CAPEX (654) (913) (273) (1377) (1151) (876) Free cash flow $ 1274 $ 7789 $ 16556 $ 22804 $ 15112 $ (1531) Net income $ 2105 $ 8272 $ 10850 $ 6557 $ 13007 $ (663) Free Cash Flow Conversion 61%
94% 153% 348% 116% -231% • 5-year average free cash flow conversion of 155% • Low CAPEX, under 1% of revenue • TTM 2015 adversely impacted by significant (non-recurring) underbilling Note: 2015 adjusted for $6.9M of acquisition and
integration expense (ie. deal costs)
Supplemental
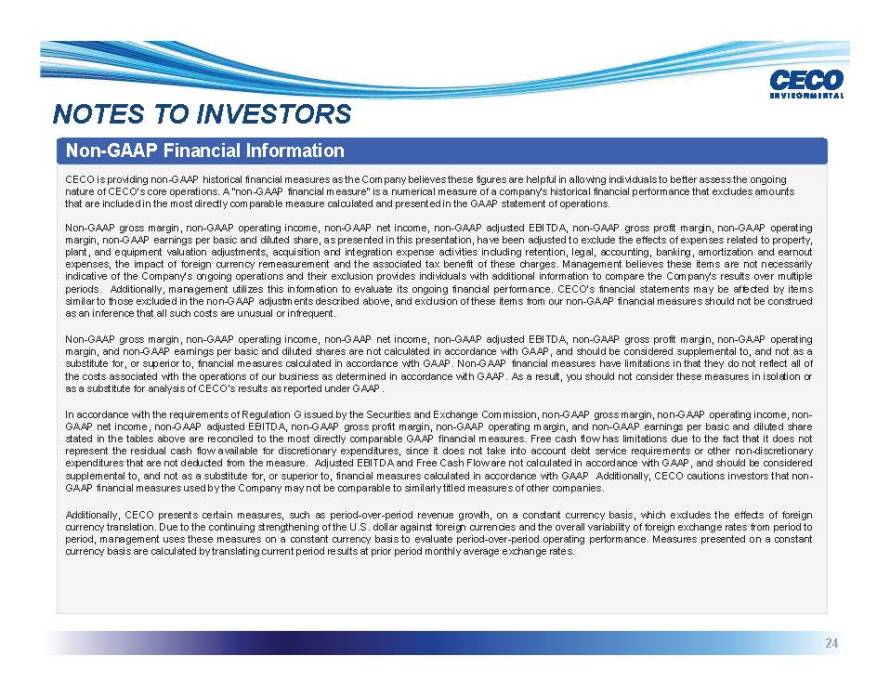
NOTES TO INVESTORS Non-GAAP Financial Information CECO is providing non-GAAP historical financial measures as the Company believes these figures are helpful in allowing individuals to
better assess the ongoing nature of CECO’s core operations. A “non-GAAP financial measure” is a numerical measure of a company’s historical financial performance that excludes amounts that are included in the most directly
comparable measure calculated and presented in the GAAP statement of operations. Non-GAAP gross margin, non-GAAP operating income, non-GAAP net income, non-GAAP adjusted EBITDA, non-GAAP gross profit margin, non-GAAP operating margin, non-GAAP
earnings per basic and diluted share, as presented in this presentation, have been adjusted to exclude the effects of expenses related to property, plant, and equipment valuation adjustments, acquisition and integration expense activities including
retention, legal, accounting, banking, amortization and earnout expenses, the impact of foreign currency remeasurement and the associated tax benefit of these charges. Management believes these items are not necessarily indicative of the
Company’s ongoing operations and their exclusion provides individuals with additional information to compare the Company’s results over multiple periods. Additionally, management utilizes this information to evaluate its ongoing financial
performance. CECO’s financial statements may be affected by items similar to those excluded in the non-GAAP adjustments described above, and exclusion of these items from our non-GAAP financial measures should not be construed as an inference
that all such costs are unusual or infrequent. Non-GAAP gross margin, non-GAAP operating income, non-GAAP net income, non-GAAP adjusted EBITDA, non-GAAP gross profit margin, non-GAAP operating margin, and non-GAAP earnings per basic and diluted
shares are not calculated in accordance with GAAP, and should be considered supplemental to, and not as a substitute for, or superior to, financial measures calculated in accordance with GAAP. Non-GAAP financial measures have limitations in that
they do not reflect all of the costs associated with the operations of our business as determined in accordance with GAAP. As a result, you should not consider these measures in isolation or as a substitute for analysis of CECO’s results as
reported under GAAP. In accordance with the requirements of Regulation G issued by the Securities and Exchange Commission, non-GAAP gross margin, non-GAAP operating income, non-GAAP net income, non-GAAP adjusted EBITDA, non-GAAP gross profit margin,
non-GAAP operating margin, and non-GAAP earnings per basic and diluted share stated in the tables above are reconciled to the most directly comparable GAAP financial measures. Free cash flow has limitations due to the fact that it does not represent
the residual cash flow available for discretionary expenditures, since it does not take into account debt service requirements or other non-discretionary expenditures that are not deducted from the measure. Adjusted EBITDA and Free Cash Flow are not
calculated in accordance with GAAP, and should be considered supplemental to, and not as a substitute for, or superior to, financial measures calculated in accordance with GAAP Additionally, CECO cautions investors that non-GAAP financial measures
used by the Company may not be comparable to similarly titled measures of other companies. Additionally, CECO presents certain measures, such as period-over-period revenue growth, on a constant currency basis, which excludes the effects of foreign
currency translation. Due to the continuing strengthening of the U.S. dollar against foreign currencies and the overall variability of foreign exchange rates from period to period, management uses these measures on a constant currency basis to
evaluate period-over-period operating performance. Measures presented on a constant currency basis are calculated by translating current period results at prior period monthly average exchange rates.
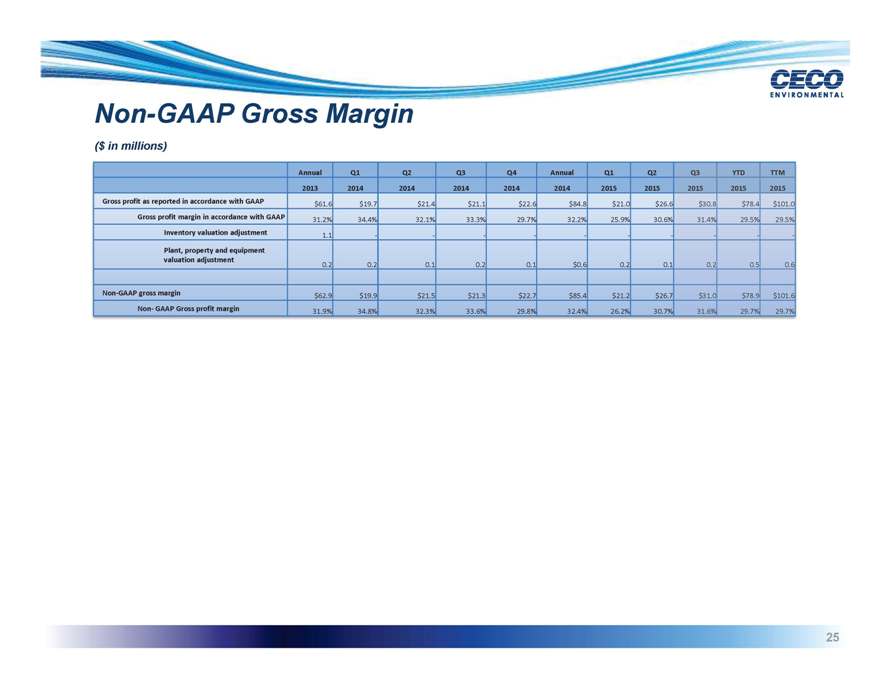
Non-GAAP Gross Margin ($ in millions) Annual Q1 Q2 Q3 Q4 Annual Q1 Q2 2013 2014 2014 2014 2014 2014 2015 2015 Gross profit as reported in accordance with GAAP $61.6 $19.7 $21.4 $21.1 $22.6
$84.8 $21.0 $26. Gross profit margin in accordance with GAAP 31.2% 34.4% 32.1% 33.3% 29.7% 32.2% 25.9% 30.6% Inventory valuation adjustment 1.1 — — — Plant, property and equipment valuation adjustment 0.2 0.2 0.1 0.2 0.1 $0.6 0.2 0.
Non-GAAP gross margin $62.9 $19.9 $21.5 $21.3 $22.7 $85.4 $21.2 $26. Non- GAAP Gross profit margin 31.9% 34.8% 32.3% 33.6% 29.8% 32.4% 26.2% 30.7%
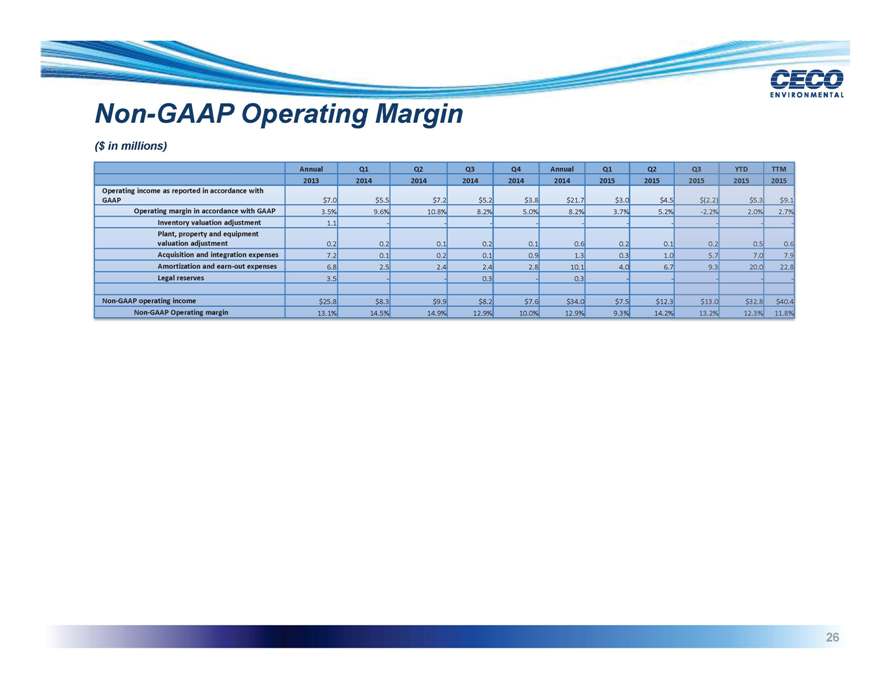
Non-GAAP Operating Margin ($ in millions) Annual Q1 Q2 Q3 Q4 Annual Q1 Q2 2013 2014 2014 2014 2014 2014 2015 2015 Operating income as reported in accordance with GAAP $7.0 $5.5 $7.2 $5.2
$3.8 $21.7 $3.0 $4. Operating margin in accordance with GAAP 3.5% 9.6% 10.8% 8.2% 5.0% 8.2% 3.7% 5.2 Inventory valuation adjustment 1.1 — — — Plant, property and equipment valuation adjustment 0.2 0.2 0.1 0.2 0.1 0.6 0.2 0.
Acquisition and integration expenses 7.2 0.1 0.2 0.1 0.9 1.3 0.3 1. Amortization and earn-out expenses 6.8 2.5 2.4 2.4 2.8 10.1 4.0 6. Legal reserves 3.5 — 0.3—0.3—Non-GAAP operating income $25.8 $8.3 $9.9 $8.2 $7.6 $34.0 $7.5 $12.
Non-GAAP Operating margin 13.1% 14.5% 14.9% 12.9% 10.0% 12.9% 9.3% 14.2
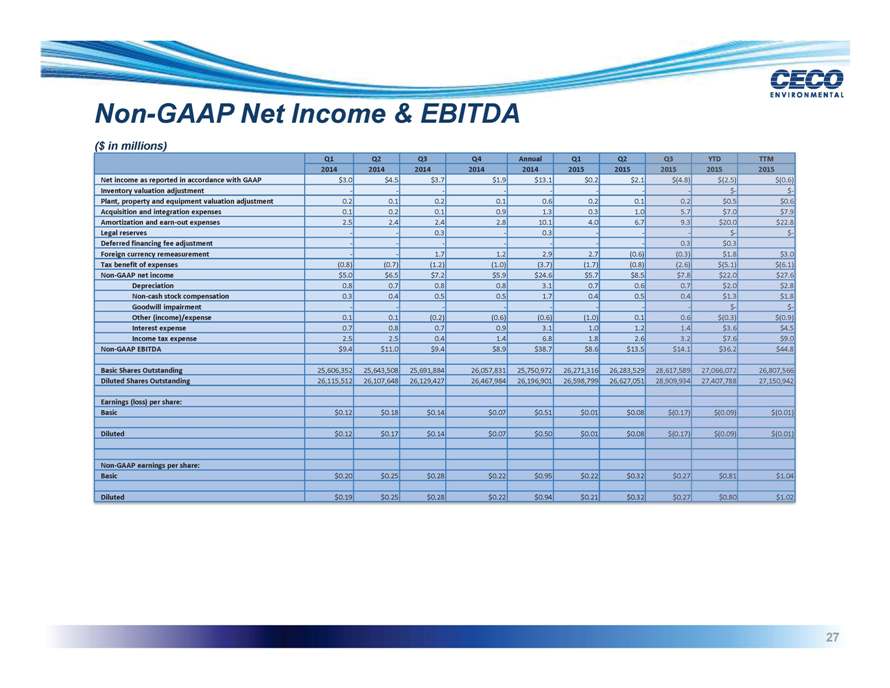
Non-GAAP Net Income & EBITDA ($ in millions) Q1 Q2 Q3 Q4 Annual Q1 Q2 2014 2014 2014 2014 2014 2015 2015 Net income as reported in accordance with GAAP $3.0 $4.5 $3.7 $1.9 $13.1
$0.2 $2. Inventory valuation adjustment — — — Plant, property and equipment valuation adjustment 0.2 0.1 0.2 0.1 0.6 0.2 0. Acquisition and integration expenses 0.1 0.2 0.1 0.9 1.3 0.3 1. Amortization and earn-out expenses 2.5 2.4 2.4
2.8 10.1 4.0 6. Legal reserves — 0.3—0.3—Deferred financing fee adjustment — — — Foreign currency remeasurement — 1.7 1.2 2.9 2.7 (0.6 Tax benefit of expenses (0.8) (0.7)
(1.2) (1.0) (3.7) (1.7) (0.8 Non-GAAP net income $5.0 $6.5 $7.2 $5.9 $24.6 $5.7 $8. Depreciation 0.8 0.7 0.8 0.8 3.1 0.7 0. Non-cash stock compensation 0.3 0.4 0.5 0.5 1.7 0.4 0. Goodwill impairment — — — Other
(income)/expense 0.1 0.1 (0.2) (0.6) (0.6) (1.0) 0. Interest expense 0.7 0.8 0.7 0.9 3.1 1.0 1. Income tax expense 2.5 2.5 0.4 1.4 6.8 1.8 2. Non-GAAP EBITDA $9.4 $11.0 $9.4 $8.9 $38.7 $8.6 $13. Basic Shares Outstanding 25,606,352 25,643,508
25,691,884 26,057,831 25,750,972 26,271,316 26,283,52 Diluted Shares Outstanding 26,115,512 26,107,648 26,129,427 26,467,984 26,196,901 26,598,799 26,627,05 Earnings (loss) per share: Basic $0.12 $0.18 $0.14 $0.07 $0.51 $0.01 $0.0 Diluted $0.12
$0.17 $0.14 $0.07 $0.50 $0.01 $0.0 Non-GAAP earnings per share: Basic $0.20 $0.25 $0.28 $0.22 $0.95 $0.22 $0.3 Diluted $0.19 $0.25 $0.28 $0.22 $0.94 $0.21 $0.3

Investor Contact Tracy Krumme VP, Investor Relations 513.458.2610 tkrumme@cecoenviro.com
CECO Environmental (NASDAQ:CECE)
Historical Stock Chart
From Mar 2024 to Apr 2024

CECO Environmental (NASDAQ:CECE)
Historical Stock Chart
From Apr 2023 to Apr 2024
