UNITED STATES
SECURITIES
AND EXCHANGE COMMISSION
Washington, D.C. 20549
FORM 8-K
CURRENT
REPORT
PURSUANT TO SECTION 13 OR 15(d) OF
THE SECURITIES EXCHANGE ACT OF 1934
Date of Report (Date of earliest event reported) November 30, 2015
|
|
|
|
|
| Commission
File Number |
|
Registrant; State of Incorporation;
Address; and Telephone
Number |
|
IRS Employer
Identification
No. |
| 1-9513 |
|
CMS ENERGY CORPORATION
(A Michigan Corporation)
One Energy Plaza Jackson,
Michigan 49201 (517) 788-0550 |
|
38-2726431 |
|
|
|
| 1-5611 |
|
CONSUMERS ENERGY COMPANY
(A Michigan Corporation)
One Energy Plaza Jackson,
Michigan 49201 (517) 788-0550 |
|
38-0442310 |
Check the appropriate box below if the Form 8-K filing is intended to simultaneously satisfy the filing obligation of the
registrant under any of the following provisions:
| ¨ |
Written communications pursuant to Rule 425 under the Securities Act (17 CFR 230.425) |
| ¨ |
Soliciting material pursuant to Rule 14a-12 under the Exchange Act (17 CFR 240.14a-12) |
| ¨ |
Pre-commencement communications pursuant to Rule 14d-2(b) under the Exchange Act (17 CFR 240.14d-2(b)) |
| ¨ |
Pre-commencement communications pursuant to Rule 13e-4(c) under the Exchange Act (17 CFR 240.13e-4(c)) |
| Item 7.01. |
Regulation FD Disclosure. |
On November 30 – December 1, 2015, CMS Energy
Corporation’s (“CMS Energy”) management will be meeting with investors. A copy of the CMS Energy handout is furnished as Exhibit 99.1 to this report.
In accordance with General Instruction B.2 of Form 8-K, the information in this Current Report on Form 8-K, including Exhibit 99.1, shall not be deemed
“filed” for the purposes of Section 18 of the Securities Exchange Act of 1934, or otherwise subject to the liabilities of that section, nor shall it be deemed incorporated by reference in any filing under the Securities Act of 1933.
Investors and others should note that CMS Energy routinely posts important information on its website and considers the Investor Relations section,
www.cmsenergy.com/investor-relations, a channel of distribution.
| Item 9.01. |
Financial Statements and Exhibits. |
(d) Exhibits.
|
|
|
| 99.1 |
|
CMS Energy handout dated November 30 – December 1, 2015 |
SIGNATURES
Pursuant to the requirements of the Securities Exchange Act of 1934, the Registrants have duly caused this report to be signed on their behalf by the
undersigned hereunto duly authorized.
|
|
|
|
|
|
|
|
|
|
|
|
|
CMS ENERGY CORPORATION |
|
|
|
|
| Dated: November 30, 2015 |
|
|
|
By: |
|
/s/ Thomas J. Webb |
|
|
|
|
|
|
Thomas J. Webb |
|
|
|
|
|
|
Executive Vice President and |
|
|
|
|
|
|
Chief Financial Officer |
|
|
|
|
|
|
|
|
|
|
CONSUMERS ENERGY COMPANY |
|
|
|
|
| Dated: November 30, 2015 |
|
|
|
By: |
|
/s/ Thomas J. Webb |
|
|
|
|
|
|
Thomas J. Webb |
|
|
|
|
|
|
Executive Vice President and |
|
|
|
|
|
|
Chief Financial Officer |
Exhibit Index
|
|
|
|
|
| 99.1 |
|
CMS Energy handout dated November 30 – December 1, 2015 |
Exhibit 99.1
CMS ENERGY
CMS
LISTED
NYSE
Investor Meetings
November 30 – December 1,
2015
Ludington Pumped Storage
Fourth largest in the world
Ray Compressor
Station
#1 LDC in gas storage
Cross Winds ®Energy Park
#2 in renewable
sales in the Great Lakes area
CMS ENERGY
This presentation is made as of the date hereof and contains “forward-looking statements” as defined in Rule 3b-6 of the
Securities Exchange Act of 1934, Rule 175 of the Securities Act of 1933, and relevant legal decisions. The forward-looking
statements are subject to risks and uncertainties. All forward-looking statements should be considered in the context of the risk and other factors detailed from time to time in CMS Energy’s and Consumers Energy’s Securities and Exchange
Commission filings. Forward-looking statements should be read in conjunction with “FORWARD-LOOKING STATEMENTS AND
INFORMATION” and “RISK FACTORS” sections of CMS Energy’s and Consumers Energy’s Form 10-K for the year ended
December 31, 2014 and as updated in subsequent 10-Qs. CMS Energy’s and Consumers Energy’s “FORWARD-LOOKING
STATEMENTS AND INFORMATION” and “RISK FACTORS” sections are incorporated herein by reference
and discuss important factors that could cause CMS Energy’s and Consumers Energy’s results to differ materially from those anticipated in such statements. CMS Energy and Consumers Energy undertake no obligation to update any of the
information presented herein to reflect facts, events or circumstances after the date hereof.
The presentation
also includes non-GAAP measures when describing CMS Energy’s results of operations and financial performance. A reconciliation of each of these measures to the most directly comparable GAAP measure is included in the appendix and posted on our
website at www.cmsenergy.com.
CMS Energy provides historical financial results on both a reported (Generally
Accepted Accounting Principles) and adjusted (non-GAAP) basis and provides forward-looking guidance on an adjusted basis. Management views adjusted earnings as a key measure of the company’s present operating financial performance, unaffected
by discontinued operations, asset sales, impairments, regulatory items from prior years, or other items. These items have the potential to impact, favorably or unfavorably, the company’s reported earnings in future periods.
Investors and others should note that CMS Energy routinely posts important information on its website and considers the
Investor Relations section, www.cmsenergy.com/investor-relations, a channel of distribution.
1

CMS ENERGY
We Cross The Finish Line Together
CMS ENERGY
THANK YOU
For your support
BETTER THAN WE FOUND IT

CMS ENERGY
Looking Back — CMS Energy Consistent Growth . . . .
7% CAGR
a
EPS
Recession
Recession
Weather Help Hurt
We work with anyone and in any condition
2003
2004 2005 2006 2007 2008 2009 2010 2011 2012 2013 2014 2015
Cold winter Mild summer Hot summer Warm winter
Mild summer Cold winter Summer- “less” Hot summer Hot summer
Warm winter Mild summer Polar vortex
Cold Feb.
Governor (D) Governor (R) Commission (R) New Commission (D) Commission (D)
a Adjusted EPS (non-GAAP)
. . . . through recession, adverse weather, changing policy leaders . . . . 3
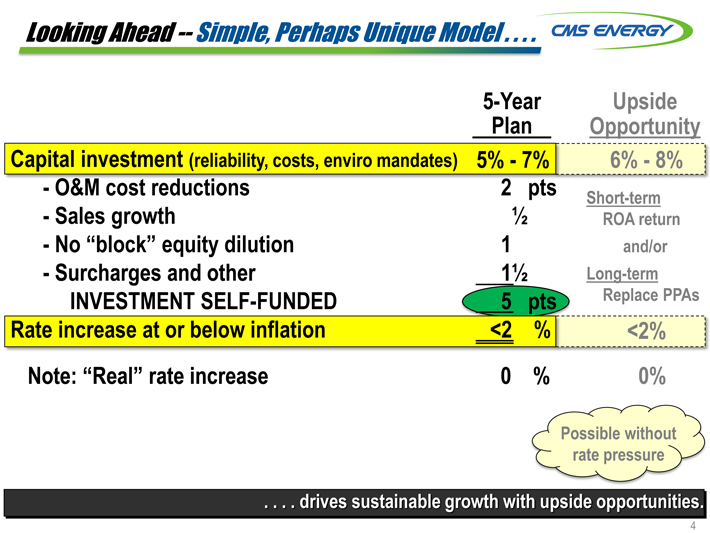
Looking Ahead -- Simple, Perhaps Unique Model . . . . CMS ENERGY
5-Year Plan Upside Opportunity
Capital investment (reliability, costs, enviro mandates) 5% - 7% 6% - 8%
- O&M cost reductions 2 pts Short-term
-
Sales growth 1/2 ROA return
- No “block” equity dilution 1 and/or
- Surcharges and other 1 1/2 Long-term
INVESTMENT SELF-FUNDED 5pts Replace PPAs
Rate
increase at or below inflation <2 % <2%
Note: “Real” rate increase 0 % 0%
Possible without rate pressure
. . . . drives sustainable growth with upside opportunities.
4
CMS ENERGY
We Earn Our Customers’ Business 24/7
CMS
ENERGY
THANK YOU
for your support
BETTER THAN WE FOUND IT

O&M Cost Performance . . . . CMS ENERGY
Actual Cost Reduction
(2014 over 2016)
Peer Average >5%
Consumers -2.7%
- - - - -
Source: SNL, Form 1, Electric Non-fuel
O&M
Future Cost Savings
2014 & 2015 (mils)
2014 2018 (mils)
Attrition $ - 35 $- 75
Productivity (Coal Gas) - 35 - 50
“Pole
Top” Hardening - 30 - 30
Smart Meters - 5 - 25
Eliminate Waste (UA’s) - 15 - 20
Mortality Tables & Discount Rates +50 + 50
Service Upgrades +10 +50
Net Savings $ - 60 $ - 100
Percent Savings -6% -
10%
FAST START! 2% a year!
. . . . best in industry and sustainable. 6
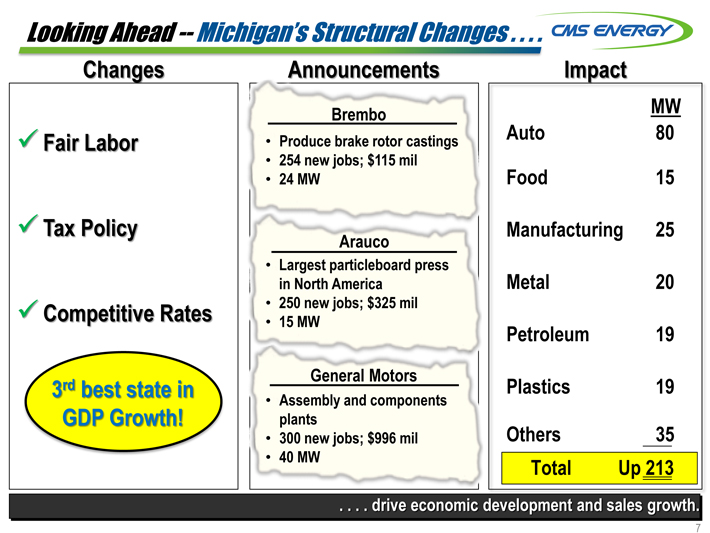
Looking Ahead -- Michigan’s Structural Changes . . . . CMS ENERGY
Changes Announcements Impact
Brembo MW
ü Fair Labor
Produce brake rotor castings
Auto
254 new jobs; $115 mil
Food
24 MW
ü Tax Policy
Arauco
Manufacturing
Largest particleboard press in
North America
Metal
ü Competitive Rates
15 250 MW new jobs; $325 mil
Petrolem
General Motors
Plastic
3rd best state in
Assembly and components
GDP Growth!
plants
Other
300 new jobs; $996 mil
40 MW
Total Up
80 15 25 20 19 19 35 213
. . . . drive economic
development and sales growth.
7

CMS ENERGY
We Leave It Better Than We Found It
CMS ENERGY
THANK YOU
for your support
BETTER THAN WE FOUND IT
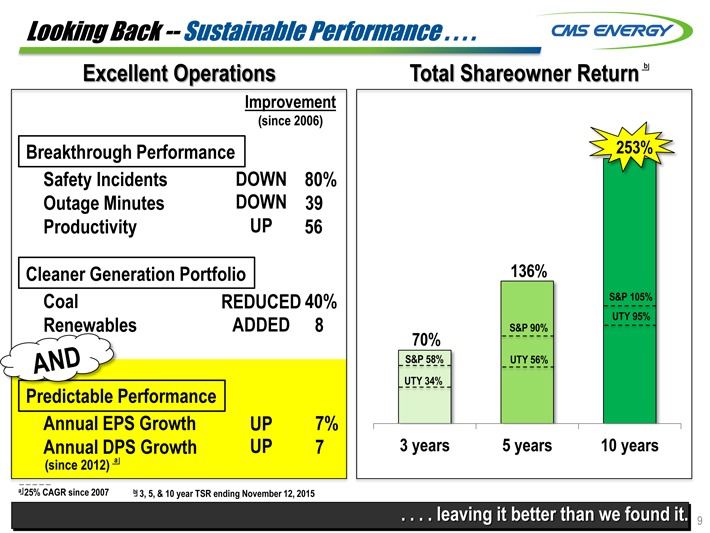
Looking Back -- Sustainable Performance . . . . CMS ENERGY
Excellent Operations
Improvement (since 2006)
Breakthrough Performance
Safety Incidents DOWN 80%
Outage Minutes DOWN 39
Productivity UP 56
Cleaner Generation Portfolio
Coal REDUCED 40%
Renewables ADDED 8
AND
Predictable Performance
Annual EPS Growth UP 7%
Annual DPS Growth UP 7
(since 2012) a
b
Total Shareowner Return
253%
136%
S&P 105%
UTY 95%
S&P 90%
70%
S&P 58%
UTY 56%
UTY 34%
3 years
5 years
10 years
a 25% CAGR since 2007 b 3, 5, & 10 year TSR ending November 12, 2015
. . . . leaving it better than we found it. 9
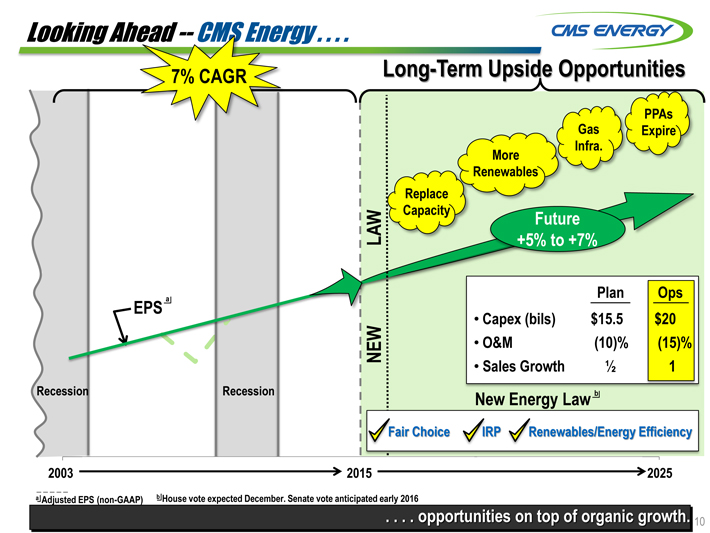
Looking Ahead -- CMS Energy . . . . CMS ENERGY
7% CAGR
EPSa
Recession Recession
Long-Term Upside Opportunities
NEW LAW
Replace Capacity
More Renewables
Gas Infra.
PPAs Expire
Future
+5% to +7%
Plan Ops
Capex (bils) $15.5 $20
O&M (10)% (15)%
Sales Growth 1/2 1
New Energy Law b
Fair Choice IRP Renewables/Energy Efficiency
2003
2015 2025
-----
a Adjusted EPS (non-GAAP) b House vote expected December. Senate vote anticipated early 2016
. . . . opportunities on top of organic growth. 10
GAAP Reconciliation
CMS ENERGY
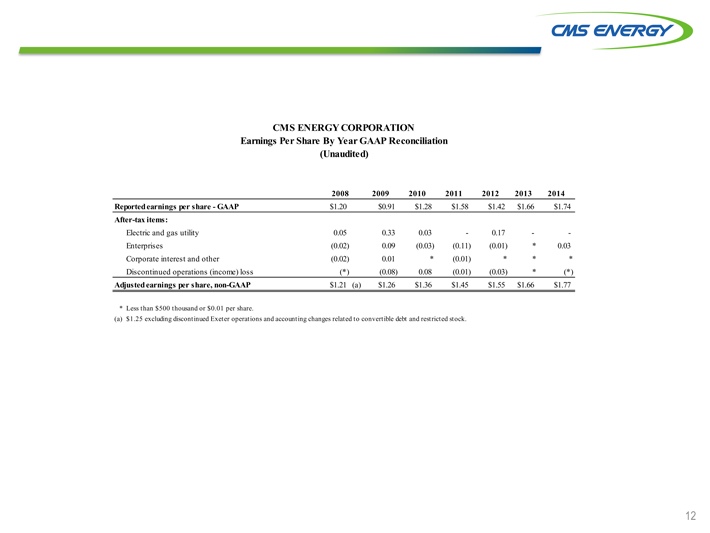
CMS ENERGY CORPORATION
Earnings Per Share By Year
GAAP Reconciliation
(Unaudited)
2008 2009 2010 2011 2012 2013 2014
Reported
earnings per share - GAAP $1.20 $0.91 $1.28 $1.58 $1.42 $1.66 $1.74
After-tax items:
Electric and gas utility 0.05 0.33 0.03 — 0.17 — —
Enterprises (0.02) 0.09 (0.03) (0.11) (0.01) * 0.03
Corporate interest and other (0.02) 0.01 * (0.01) * * *
Discontinued operations (income) loss (*) (0.08) 0.08 (0.01) (0.03) * (*)
Adjusted earnings per share, non-GAAP $1.21 (a) $1.26 $1.36 $1.45 $1.55 $1.66 $1.77
* Less than $500 thousand or $0.01 per share.
(a) $1.25 excluding discontinued Exeter operations and accounting changes related to convertible debt and restricted stock.
12
CMS ENERGY
Consumers Energy
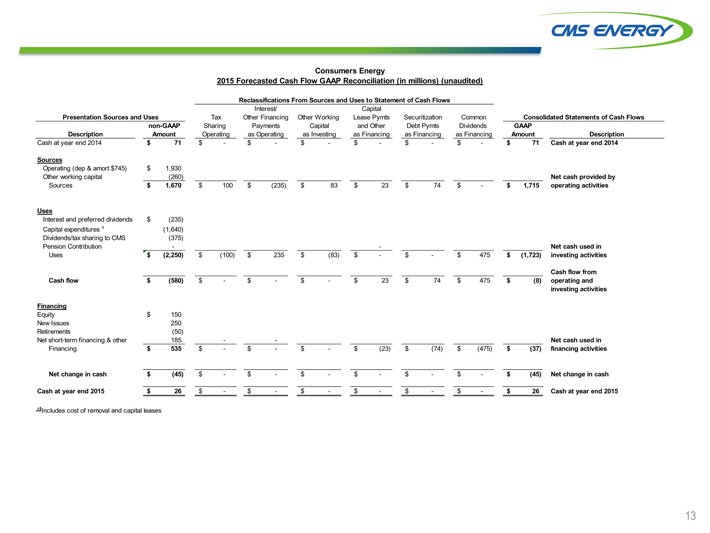
2015 Forecasted Cash Flow GAAP
Reconciliation (in millions) (unaudited)
Reclassifications From Sources and Uses to Statement of Cash Flows
Presentation Sources and Uses Description Cash at year end 2014 Sources Operating (dep & amort $745) Other
working capital Sources Uses Interest and preferred dividends Capital expenditures a Dividends/tax sharing to CMS Pension Contribution Uses Cash flow Financing Equity New Issues Retirements Net short-term financing & other Financing Net change
in cash Cash at year end 2015 non-GAAP Amount
$71 $1,930 (260) $1,670 $(235) (1,640) (375) — $(2,250)
$(580) $150 250 (50) 185 $535 $(45) $26
Tax Sharing Operating
$— $100 $(100) $— — $— $— $—
Interest/ Other Financing Payments as Operating
$— $(235) $235 $— — $— $— $—
Other Working Capital as Investing
$— $83
$(83) $— $— $— $—
Capital Lease Pymts and Other as Financing
$— $23 — $— $23 $(23) $— $—
Securitization Debt Pymts as Financing
$— $74 $— $74 $(74) $— $—
Common Dividends as Financing
$— $— $475 $475 $(475) $— $—
Consolidated Statements of Cash Flows
GAAP Amount $71 $1,715 $(1,723) $(8) $(37) $(45) $26
Description Cash at year end 2014 Net cash provided by operating activities Net cash used in investing activities Cash flow from operating and investing activities Net cash used in
financing activities Net change in cash Cash at year end 2015
a Includes cost of removal and capital leases
13

CMS ENERGY
CMS Energy Parent
2015 Forecasted Cash Flow GAAP
Reconciliation (in millions) (unaudited)
Reclassifications From Sources and Uses to Statement of Cash Flows
Presentation Sources and Uses
Description
Cash at year end 2014
Sources
Consumers Energy dividends/tax sharing
Enterprises
Sources
Uses
Interest and preferred dividends
Overhead and Federal tax payments
Equity
infusions
Pension Contribution
Uses (a)
Cash flow
Financing and dividends
New Issues
Retirements
Equity programs (DRP, continuous equity)
Net short-term financing & other
Common
dividend
Financing
Net change in cash
Cash at year end 2015
non-GAAP Amount Non Equity Uses as Operating Other GAAP Amount Consolidated Statements of Cash Flows
Description
$ 95 $—$ (95) $— Cash at year end 2014
$ 375 20 Net cash provided by operating activities
$ 395 $ (165) $ (50) $180
$ (130) (10) (150) — Net cash used in investing activities
$ (315) $165 $— $ (150)
Cash flow from
operating and investing activities
$ 80 $— $ (50) $ 30 $ 250 — 45
(5) — — (320) Net cash used in financing activities
$ (30) $— $— $ (30) $ 50$— $ (50) $— Net change in cash
$ 145 $— $ (145) $— Cash at year end 2015
(a) Includes other
14
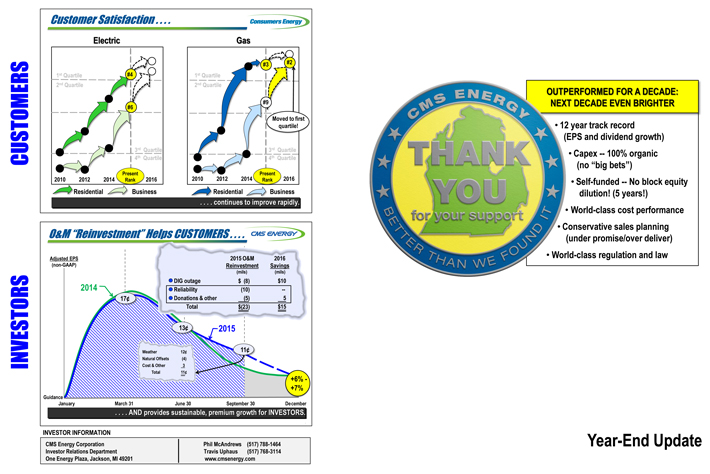
CMS ENERGY
Consolidated CMS Energy
2015 Forecasted
Consolidation of Consumers Energy and CMS Energy Parent Statements of Cash Flow (in millions) (unaudited)
Eliminations/Reclassifications/Consolidation to
Arrive at the Consolidated Statement of Cash Flows
Statements of Cash Flows
Description
Cash at year end 2014
Net cash provided by operating activities
Net cash used in investing activities
Cash flow
from operating and investing activities
Net cash used in financing activities
Net change in cash
Cash at year end 2015
Consumers Amount
$71 $1,715 (1,723) $(8) $(37) $(45) $26
CMS Parent Amount
$— $180 (150) $30 $(30) $— $—
Other Consolidated Entities
$136 $130 (334) $(204) $277 $73 $209
Consumers
Common Dividend as Financing
$— $(475) — $(475) $475 $— $—
Equity Infusions to Consumers
$— $— 150 $150 $(150) $— $—
Consolidated Statements of Cash Flows
Amount
$207 $1,550 (2,057) $(507) $535 $28 $235
Description
Cash at year end 2014
Net cash provided by
operating activities
Net cash used in investing activities
Cash flow from operating and investing activities
Net cash provided by financing activities
Net
change in cash
Cash at year end 2015
15

CMS ENERGY
CMS Energy
Reconciliation of Gross Operating Cash
Flow to GAAP Operating Activities
(unaudited)
(mils)
2014 2015 2016 2017 2018 2019 2020
Consumers
Operating Income + Depreciation & Amortization $1,813 $1,930 $2,027 $2,145 $2,266 $2,401 $2,515
Enterprises Project Cash Flows 20 20 40 58 62 67 71
Gross Operating Cash Flow $1,833 $1,950 $2,067 $2,203 $2,328 $2,468 $2,586
Other operating activities including taxes, interest payments and working capital (386) (400) (567) (603) (628) (668)
(686)
Net cash provided by operating activities $1,447 $1,550 $1,500 $1,600 $1,700 $1,800 $1,900
16
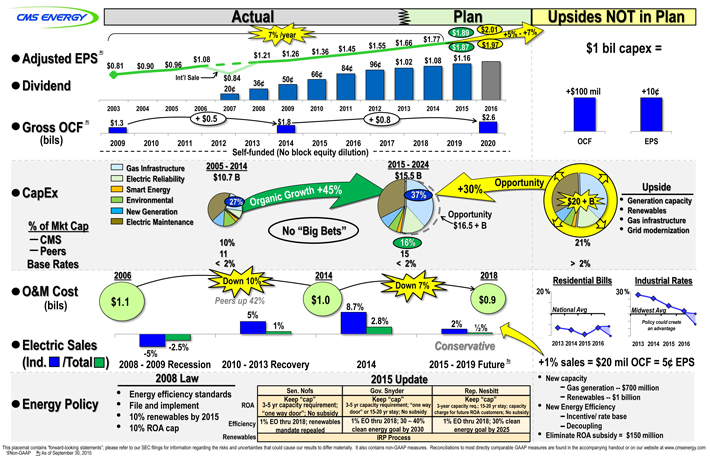
INVESTORS
CUSTOMERS
Customer Satisfaction . . . .
Consumers Energy
Electric
1st Quartile #4 2nd Quartile #6 3rd
Quartile 4th Quartile 2010 2012 2014 Present Rank 2016
Residential Business
Gas
#3 #2 1st Quartile 2nd Quartile #9 Moved to first quartile! 3rd Quartile 4th Quartile
2010 2012 2014 Present Rank 2016
Residential
Business
. . . . continues to improve rapidly.
O&M “Reinvestment” Helps CUSTOMERS . . . .
CMS ENERGY
Adjusted EPS (non-GAAP)
2015 O&M Reinvestment
2016 Savings
(mils) (mils)
DIG outage $(8) $10
Reliability (10) —
Donations & other (5) 5
Total $(23) $15
2014 17¢ 13¢ 2015
11¢
Weather 12¢
Natural Offsets (4)
Cost & Other 3
Total 11¢
+6% - +7%
Guidance
January March 31 June 30 September 30 December
. . . . AND provides sustainable, premium growth for INVESTORS.
INVESTOR INFORMATION CMS Energy Corporation Investor Relations Department One Energy Plaza, Jackson, MI 49201
Phil McAndrews Travis Uphaus www.cmsenergy.com
(517) 788-1464 (517) 768-3114
CMS ENERGY
THANK YOU
For your support
BETTER THAN WE FOUND IT
OUTPERFORMED FOR A DECADE: NEXT DECADE EVEN BRIGHTER
• 12 year track record (EPS and dividend growth)
• Capex — 100% organic (no “big bets”)
• Self-funded — No block equity dilution! (5 years!)
• World-class cost performance
• Conservative sales planning (under promise/over deliver)
• World-class regulation and law
Year-End
Update
CMS ENERGY
Actual Plan
7% /year
+5% — +7%
Adjusted EPS a Dividend Gross OCF a (bils)
$0.81
2003 $1.3 2009
$0.90 2004 2010
$0.96 Int’l Sale 2005 2011
$1.08 2006 + $0.5
$0.84 20¢ 2007 2012
$1.21 36¢ 2008 2013
$1.26 50¢ 2009 $1.8
2014
$1.36 66¢ 2010 2015
$1.45 84¢ 2011 2016
$1.55 96¢ 2012 +
$0.8 2017
$1.66 $1.02 2013
$1.77 $1.08 2014 2018
$1.89 $1.87 $1.16 2015 2019
$2.01 $1.97 2016 $2.6 2020
Self-funded (No block equity dilution)
Upsides
NOT in Plan
$1 bil capex =
+$100 mil +10¢
OCF EPS
CapEx
% of Mkt Cap
- CMS
- Peers
Base Rates
Gas Infrastructure
Electric Reliability
Smart Energy
Environmental
New Generation
Electric Maintenance
2005 — 2014 $10.7 B
27% Organic Growth +45%
10%
11
< 2%
No “Big Bets”
2015 — 2024 $15.5 B
37%
16% 15 < 2%
Opportunity $16.5 + B
Opportunity
+30%
$20 + B
21%
> 2%
Upside
• Generation capacity
• Renewables
• Gas infrastructure
• Grid modernization
O&M Cost (bils)
Electric Sales (Ind. /Total)
2006
$1.1
-2.5%
-5%
Down 10%
Peers up 42%
5%
1%
2014
$1.0
8.7%
2.8%
Down 7%
2018
$0.9
2%
1/2%
Conservative
2008 — 2009 Recession 2010 — 2013 Recovery 2014 2015 — 2019 Future b
Residential Bills Industrial Rates
20 % 30 %
National Avg Midwest Avg
Policy could create an advantage
2013 2014 2015 2016 2013 2014 2015 2016
+1% sales
= $20 mil OCF = 5¢ EPS
Energy Policy
2008 Law
• Energy efficiency standards
• File
and implement
• 10% renewables by 2015
• 10% ROA cap
ROA
Efficiency
Renewables
2015 Update
Sen. Nofs Gov. Snyder Rep. Nesbitt
Keep “cap” 3-5 yr capacity requirement; “one way door”; No subsidy Keep “cap”
3-5 yr capacity requirement; “one way door” or 15-20 yr stay; No subsidy Keep “cap” 3-year capacity req.; 15-20 yr stay; capacity charge for future ROA customers; No subsidy
1% EO thru 2018; renewables mandate repealed 1% EO thru 2018; 30 – 40% clean energy goal by 2030 1% EO thru 2018; 30%
clean energy goal by 2025
IRP Process
• New capacity
— Gas generation —
$700 million
— Renewables — $1 billion
• New Energy Efficiency
— Incentive/ rate base
— Decoupling
• Eliminate ROA subsidy = $150 million
This placemat contains “forward-looking statements”; please refer to our SEC filings for information regarding
the risks and uncertainties that could cause our results to differ materially. It also contains non-GAAP measures. Reconciliations to most directly comparable GAAP measures are found in the accompanying handout or on our website at www.cmsenergy.com
a Non-GAAP b As of September 30, 2015
CMS Energy (NYSE:CMS)
Historical Stock Chart
From Mar 2024 to Apr 2024

CMS Energy (NYSE:CMS)
Historical Stock Chart
From Apr 2023 to Apr 2024
