UNITED STATES
SECURITIES AND EXCHANGE COMMISSION
WASHINGTON, DC 20549
FORM 8-K
CURRENT REPORT
PURSUANT TO SECTION 13 OR 15(d) OF THE SECURITIES
EXCHANGE ACT
OF 1934
Date of Report (Date of earliest event reported):
November 23, 2015
US ECOLOGY, INC.
(Exact name of registrant as specified
in its charter)
| DELAWARE |
0-11688 |
95-3889638 |
|
(State or other jurisdiction of
incorporation or organization) |
(Commission File Number) |
(I.R.S. Employer
Identification Number) |
| |
|
|
|
251 E. Front St., Suite 400
Boise,
Idaho
(Address of principal executive offices) |
|
83702
(Zip Code) |
| |
|
|
| |
|
|
| |
|
|
(208) 331-8400
(Registrant’s telephone number, including
area code)
Check the appropriate box below if the Form 8-K filing is intended
to simultaneously satisfy the filing obligation of the registrant under any of the following provisions:
¨ Written communications
pursuant to Rule 425 under the Securities Act (17 CFR 230.425)
¨ Soliciting
material pursuant to Rule 14a-12 under the Exchange Act (17 CFR 240.14a-12)
¨ Pre-commencement
communications pursuant to Rule 14d-2(b) under the Exchange Act (17 CFR 240.14d-2(b))
¨ Pre-commencement
communications pursuant to Rule 13e-4(c) under the Exchange Act (17 CFR 240.13e-4(c))
Item 7.01. Regulation FD Disclosure
Attached as Exhibit 99.1 and furnished for purposes of
Regulation FD is an Investor Presentation to be given by US Ecology, Inc. at various investor events in November and December 2015.
In accordance with general instruction B.2 of Form 8-K,
the information in this report (including Exhibit 99.1) is furnished and shall not be deemed to be “filed” for
the purposes of Section 18 of the Securities Exchange Act of 1934 (the “Exchange Act”), or otherwise subject to
the liability of that section, nor shall it be deemed to be incorporated by reference in any filing under the Securities Act of
1933 or the Exchange Act.
Item 9.01. Financial Statements and Exhibits
The following exhibits relating to Item 7.01 shall be deemed
to be furnished, and not filed:
| 99.1 | US Ecology, Inc. Investor Presentation – November
2015. |
SIGNATURES
Pursuant to the requirements of the Securities Exchange Act
of 1934, the registrant has duly caused this report to be signed on its behalf by the undersigned thereunto duly authorized.
| |
US ECOLOGY, INC. |
| |
(Registrant) |
| |
|
| |
|
| Date: November 23, 2015 |
By:/s/ Eric L. Gerratt |
| |
Eric L. Gerratt |
| |
Executive Vice President & Chief Financial Officer |
| |
|
Exhibit 99.1

1 November 2015 Investor Presentation

2 SAFE HARBOR During the course of this presentation the Company will be making forward - looking statements (as such term is defined in the Private Securities Litigation Reform Act of 1995 ) that are based on our current expectations, beliefs and assumptions about the industry and markets in which US Ecology, Inc . and its subsidiaries operate . Such statements may include, but are not limited to, statements about the Company's ability to integrate its acquisition of EQ — The Environmental Quality Company (EQ), expected synergies from the transaction, projections of the financial results of the combined company and other statements that are not historical facts . Such statements involve known and unknown risks, uncertainties and other factors that could cause the actual results of the Company to differ materially from the results expressed or implied by such statements, including general economic and business conditions, conditions affecting the industries served by US Ecology, EQ and their respective subsidiaries, conditions affecting our customers and suppliers, competitor responses to our products and services, the overall market acceptance of such products and services, the integration and performance of acquisitions (including the acquisition of EQ) and other factors disclosed in the Company's periodic reports filed with the Securities and Exchange Commission . For information on other factors that could cause actual results to differ materially from expectations, please refer to US Ecology, Inc . 's December 31 , 2014 Annual Report on Form 10 - K and other reports filed with the Securities and Exchange Commission . Many of the factors that will determine the Company's future results are beyond the ability of management to control or predict . Readers should not place undue reliance on forward - looking statements, which reflect management's views only as of the date such statements are made . The Company undertakes no obligation to revise or update any forward - looking statements, or to make any other forward - looking statements, whether as a result of new information, future events or otherwise . Important assumptions and other important factors that could cause actual results to differ materially from those set forth in the forward - looking information include a loss of a major customer or contract, compliance with and changes to applicable laws, rules, or regulations, access to cost effective transportation services, access to insurance, surety bonds and other financial assurances, loss of key personnel, lawsuits, labor disputes, adverse economic conditions, government funding or competitive pressures, incidents or adverse weather conditions that could limit or suspend specific operations, implementation of new technologies, market conditions, average selling prices for recycled materials, our ability to replace business from recently completed large projects, our ability to perform under required contracts, our ability to permit and contract for timely construction of new or expanded disposal cells, our willingness or ability to pay dividends and our ability to effectively close, integrate and realize anticipated synergies from future acquisitions, which can be impacted by the failure of the acquired company to achieve anticipated revenues, earnings or cash flows, assumption of liabilities that exceed our estimates, potential compliance issues, diversion of management's attention or other resources from our existing business, risks associated with entering product / service areas in which we have limited experience, increases in working capital investment, unexpected capital expenditures, potential losses of key employees and customers of the acquired company and future write - offs of intangible and other assets, including goodwill, if the acquired operations fail to generate sufficient cash flows .

3 US ECOLOGY OVERVIEW Vision: To be the premier North American provider of environmental services where the highest caliber people work delivering sustainable solutions for our customers and long term value for stockholders and the communities in which we live and operate Fully Integrated North American Environmental Services Provider Unique and Irreplaceable Assets with Robust Waste Permits Diverse, Blue Chip Customer Base across a Broad Range of Industries with over 7,000 Customers 60 + year Commitment to Health, Safety and the Environment Strong Financial Performance Landfills Treatment & Recycling Service Centers Headquarters (4) Mexico Québec (2) ( 2 ) United States Retail Satellites

4 $24 Billion Industry Strong Growth Drivers Considerable Barriers to Entry Government Regulation Track Record of Execution Capex Requirements Talented Professionals Regulation Industrial Commercial Government Environmental Services: Hazardous Waste Field & Industrial Services $10 billion market Provides treatment, disposal & recycling services Radioactive waste constitutes $1 billion $14 billion market Consists of cleanup of operating facilities Government agencies a major customer Retail Hazardous Waste Logistics Industrial Cleaning & Maintenance In - Plant Total Waste Management Terminal Services Petroleum Services Airport Environmental Services Remediation & Construction Emergency Response Household Hazardous Waste Collection Lab - Pack TSDFs / Brokers Other Environmental Services Companies Truck & Rail Services Treatment, Storage & Disposal Facilities (“TSDFs”) Wastewater Treatment Facilities Mobile Recycling Operation Hazardous Landfill Solvent Recycling Oil Recycling Incineration Fuel Blending Non - Haz Landfill Cement Kiln Waste - to - Energy Sourcing from Intermediaries Direct Sourcing Waste Generation Services Transfer, Storage & Treatment Disposal Infrastructure Support LTL Logistics

5 Hazardous Waste is Generated by Diverse End Markets Aerospace / Defense Paint Sludge / Radium Industry Example Waste Streams Industrial Manufacturing Steel & Aluminum Precious Metals Oil Exploration & Production Utilities Acids & Caustics, Heavy Metals Emission Control, Dust, Spent Pot Liners Mercury, Crucible Waste, Unused Chemicals Spent Catalysts, Refinery Tank Bottoms, Drill Cuttings Unused Household Chemicals, Sludge from Battery Production, Heavy Metals from Pigments Consumer Products PCBs, Decommissioned Transformer Waste Etching Solutions for Semiconductors Technology PCBs, Radioactive Government

6 US Ecology Focuses on the Most Complex Waste Streams Waste Stream Pricing Continuum Price per Ton MSW LLRW Refinery Sludges / Catalysts Hazardous Containerized Fission Products / SNM Hazardous Debris NORM PCB / Hazardous Solids High Low Volume Low High Non Haz / State Regulated TENORM Heavy Metals High Level Radium 6

7 Our Transformation… Limited Geographic Footprint Acquire Valuable Assets Narrow Service Offering (Haz/Rad Waste Disposal) Event - Centric, Customer - Concentrated Model Limited Growth Prospects Given Idaho Focus National TSDF Footprint Broad Service Capabilities Flexible & Diversified Business Model Ability to Support Customer Needs is Driving Growth Expand Permits / Services Invest in Infrastructure Execute x x x x Dynecol Creating the Premier North American Provider of Environmental Services Our Strategy “Then” – 2008 Today – 2015

8 …Into a North American Leader ■ 5 Haz/Non - Haz Landfills ■ 1 Radioactive Waste Landfill ( Class A, B, C) ■ 21 Treatment & Recycling Facilities 1 ■ Rail - accessible Facilities & Infrastructure ■ 24 Field Service Centers & Retail Satellites 1 Five treatment facilities and one recycling facility co - located with disposal sites Landfills Treatment & Recycling Service Centers Headquarters Retail Satellites (4) Mexico Québec (2) ( 2 ) United States

9 A Full Service Platform Technical Services Emergency Response Remedial Construction Packaging & Collection Brokering Transportation Beneficial Re - use Thermal Recycling Incineration Treatment & Disposal Field / On - Site Services x Customer - Centric Approach x National TSDF Footprint x Broad Set of Environmental Service Solutions x Emphasis on Solving Customer Needs Field & Industrial Services Environmental Services 34% 66% Field & Industrial Services Environmental Services US Ecology Business Mix YTD Revenue September 30, 2015 Services not offered by USE

10 Coast to Coast Disposal Network ■ Facilities Positioned throughout North America ▪ 5 Haz / Non - Haz Landfills (All Co - Located with Treatment ) ▪ 1 Radioactive Waste Landfill (Class A, B, C) ■ Located near Industrial Centers in the West, Northeast, Midwest and Gulf Regions ■ Broad Range of Permits and Acceptance Criteria ■ Infrastructure to Support High Volume Transfer ■ Rail and Truck Access Idaho (Grand View) Washington (Richland) Radioactive Landfill Michigan (Belleville) Nevada (Beatty) Texas (Robstown) Stablex (Quebec - Blainville)

11 Large Treatment Network ■ F acilities throughout the Northeast, Midwest, West, South and Gulf regions ■ Five co - located with disposal facilities ■ Ability to manage a wide range of liquid and solid waste streams ■ Broad range of de - characterization and de - listing capabilities ■ State - of - the - Art Air Handling 14 Treatment Facilities Located at Landfills • Idaho • Michigan • Nevada • Quebec • Texas Standalone • Michigan (2) • Ohio • Penn. • Illinois • Alabama • Oklahoma • Georgia • Florida Michigan (Detroit) Treatment / Stabilization and WWT Penn., Ohio and Illinois Liquid and Solid Waste Treatment Nevada (Beatty) Treatment / Stabilization

12 Recycling ■ Seven recovery / recycling operations in the Gulf, Midwest, Northeast and Southern Regions ■ Market Oriented Solutions: ▪ Thermal Desorption – Oil / Catalyst Recovery ▪ Solvent Distillation – Airline De - icing, Other Solvents ▪ Mobile Distillation – On - site Solvent Recovery for Manufacturing facilities in the South and Midwest ▪ Selective Precipitation – Valuable Metals Recovery Resource Recovery Glycol & NMP Solvent Recycling (MI) Two Airport Recovery Sites (MN & PA) Texas (Robstown) Thermal Recycling North Carolina (Mt. Airy) Mobile Solvent Recovery – South & Midwest Pennsylvania (York) Ohio (Canton) Selective Precipitation Metals Recovery

13 Field Services Remediation Management of remedial construction projects from start to finish Retail End - to - end management of retail hazardous waste programs Transportation & Logistics Transport of waste from point of generation to ultimate disposal Lab Pack Small quantity chemical management services Total Waste Management Outsourced management, tracking and reporting all waste streams for generators LTL / HHW Household hazardous waste collection and Less - than - truckload container management

14 Industrial Services ■ Divested the majority of our Industrial Services Business – viewed as Non - Core ■ Sale of Allstate Power Vac. completed November 1, 2015 ▪ Cash consideration of approximately $58.0 million (before adjustments for working capital and capital expenditures) ▪ Represents 12% of YTD revenue, 5 % YTD Adjusted EBITDA ▪ Majority of the proceeds used to pay down debt to approximately 2.5x EBITDA/debt level ▪ Improves free cash flow ▪ Acquired as part of EQ ■ Remaining industrial services include Greater Michigan area business and on - site terminal services Refinery Services Tank farm cleaning, maintenance, centrifugation and temporary storage Emergency Response 24/7 spill response. Emergency clean - outs, sampling and analysis Marine & Terminal Services 24/7 spill response. Containment booming, saltwater intake cleaning and de - silting
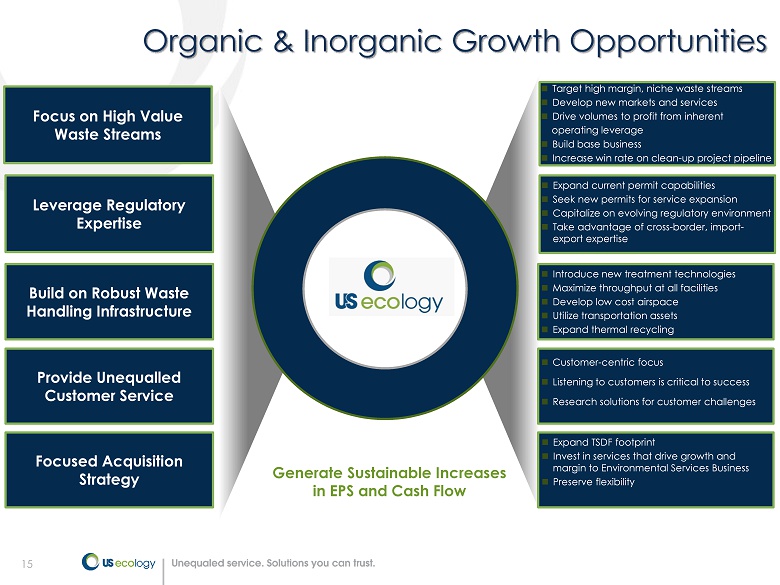
15 Organic & Inorganic Growth Opportunities Build on Robust Waste Handling Infrastructure Leverage Regulatory Expertise Provide Unequalled Customer Service Generate Sustainable Increases in EPS and Cash F low Focus on High Value Waste Streams Target high margin, niche waste streams Develop new markets and services Drive volumes to profit from inherent operating leverage Build base business Increase win rate on clean - up project pipeline Expand current permit capabilities Seek new permits for service expansion Capitalize on evolving regulatory environment Take advantage of cross - border , import - export expertise Introduce new treatment technologies Maximize throughput at all facilities Develop low cost airspace Utilize transportation assets Expand thermal recycling Customer - centric focus Listening to customers is critical to success Research solutions for customer challenges Focused Acquisition Strategy Expand TSDF footprint Invest in services that drive growth and margin to Environmental Services Business Preserve flexibility Focus on High Value Waste Streams

16 Financial Overview

17 ($ in Millions) Revenue Growth (YoY) $105 $155 $169 $201 $447 $425 $0 $100 $200 $300 $400 $500 2010 2011 2012 2013 2014 2015 Total Company excl. APV APV Revenue Q3 YTD ‘15 48% 9% 19% 122% 46% (1) (1) Based on Q3 YTD ‘15 YoY comparison Growing Revenue & Adj. EBITDA (2) See definition and reconciliation of Adjusted EBITDA on pages 31 - 38 of this presentation and pro forma reconciliation on page 27 (3) Excludes the Allstate PowerVac business which was sold on November 1, 2015. (4) Based on Q3 YTD ’15 year to date margin ( includes $2.1 million of business development expenses) $31 $50 $58 $71 $109 $92 $0 $25 $50 $75 $100 $125 2010 2011 2012 2013 2014 2015 Total Company excl. APV APV $104 $87 ($ in Millions) Adj. EBITDA (2) 32% 35% 24% 22% Adj. EBITDA Margin (4) 34% $122 $125 2015 Guidance Range (3) Q3 YTD ‘15 $410 $374 $37 $51

18 Track Record for Extracting Returns in Acquisitions Return on Invested Capital Return on Equity 25% 25% 15% 13% 20% 23% 19% 16% 13% 2007 2008 2009 2010 2011 2012 2013 2014 2015 Stablex Acquisition EQ Acquisition (1) Includes EQ results for the four quarters ended December 31, 2014 (2) Includes EQ results for the four quarters ended September 30, 2015 and excludes the goodwill impairment charge of $6.7 mill ion recorded in the second quarter of 2015 (1) 17% 19% 14% 12% 12% 15% 17% 6% 6% 2007 2008 2009 2010 2011 2012 2013 2014 2015 (2) (1) (2)

19 Strong Free Cash Flow Cash on hand: $9.4 million Net Borrowing’s outstanding: $350.6 million Free Cash Flow (1) ($ in Millions) $18 $14 $8 $27 $27 $30 $47 $36 $0 $10 $20 $30 $40 $50 $60 2008 2009 2010 2011 2012 2013 2014 2015 Q3 YTD‘15 $48 $52 2015 Guidance Range (2) Continued repayment of debt will accrue to cash flow and EPS over time Capex investments continue to support future growth and stable operations Attractive Dividend $0.72 - Yield ~ 1.9% (1) Free cash flow is calculated as net income plus/(minus) foreign currency losses/(gains), plus non - cash impairment charges, plus depreciation and amortization, plus stock compensation expenses, plus closure/post - closure accretion/adjustments, less capital expenditures. See reconciliation on page 39. (2) Full year free cash flow guidance excludes the Allstate PowerVac business which was sold on November 1, 2015. Cash and Debt (as of 9/30/15)

20 ■ Total revenue $424.8 million compared with $290.2 million last year ■ FIS revenue $145.9million , up from $71.0 million in prior year ▪ Allstate contributed $51.0 million versus $19.6 million ■ ES revenue $278.9 million, up from $219.3 million in prior year ▪ 18% lower Event Business (28% of revenue) ▪ 2% decline in Base Business (72% of revenue) ▪ Decline related to chemical and metal manufacturing, mining and E&P and transportation verticals ▪ Decline partially offset by increases in refining, government and utilities industries Q3 ‘15 YTD Financial Review 66% 34% Revenue by Segment ES FIS Percent Change Q3 '15 Q3 '14 Q3 '15 vs. Q3 '14 Chemical Manufacturing 16% 23% -38% Metal Manufacturing 14% 15% -15% Broker / TSDF 14% 13% -7% General Manufacturing 12% 10% 5% Refining 10% 8% 10% Government 8% 7% 4% Utilities 4% 3% 30% Transportation 3% 3% -11% Mining and E&P 2% 4% -43% Waste Management & Remediation 2% 3% -39% Other 15% 11% 12% Environmental Services T&D Revenue by Industry Percent of Total

21 21 Q3 ‘15 YTD Income Statement without APV (1) 1 Excludes the Allstate PowerVac business which was sold on November 1, 2015. See pro forma reconciliation on page 27 2015 2014 Revenue 373,798$ 270,659$ Direct operating costs 257,335 175,335 Gross profit 116,463 95,324 Selling, general and administrative expenses 61,165 42,627 Impairment charges 333 - Operating income 54,965 52,697 Other income (expense): Interest income 64 94 Interest expense (16,181) (5,405) Foreign currency loss (1,769) (1,027) Other 1,057 778 Total other income (expense) (16,829) (5,560) Income before income taxes 38,136 47,137 Income tax expense 16,872 17,766 Net income 21,264$ 29,371$ Adjusted EBITDA 87,854$ 75,250$ Nine Months Ended September 30,

22 22 Financial Position, Cash Flow & Return Metrics ■ Exited quarter with cash of $9.4 million ■ Net borrowings on credit agreement of $350.6 million ■ Working Capital (excl. assets held for sale) = $54.5 million ($63.1 million at December 31, 2014) ■ YTD Cash generated from operations = $57.0 million ■ YTD Capital expenditures = $25.7 million ■ YTD Dividends paid = $11.7 million ■ YTD Payments on long - term debt = $34.8 million Rolling 4 - Quarter Return Metrics (excl. $6.7 million of Q2 ‘15 impairment charges ): ■ Return on total capital = 5.5% (6.0%) ■ Return on total assets = 3.0% (3.7%) ■ Return on total equity = 10.6% (13.1%)

23 Expect headwinds in Q3 to continue into Q4; Q4 results to look similar to Q3 Base Business faces difficult Q4 comparison ■ Chemical and Metal Manufacturing verticals down on lower business activity ■ Other industry verticals healthy Event Business continues to see emerging opportunities with a solid pipeline ■ Deferments from Q3 to favorably impact Q4 results ■ Continued project deferrals factored into Q4 given recent trends Revising Full Year 2015 Guidance ■ Diluted Earnings Per Share 1 of $1.73 to $1.80 − Down from $1.76 to $1.92 and including $0.03 per diluted share from Allstate ■ Adjusted EBITDA 1 of $122 to $ 125 million excluding Allstate; − Down from $128 to $132 million − Allstate expected to contribute $ 5 - 6 million EBITDA for our ownership period Capital Expenditures Guidance Reaffirmed at $3 4 to $39 million ■ Includes capital expenditures for Allstate for expected ownership period ■ $25.7 million of capital investment in first six months of 2015 23 2015 Business Outlook 1 Guidance excludes non - cash foreign currency translation gains or losses, goodwill impairment charges and business development expenses

24 US Ecology Investment Highlights Unique and high value set of disposal assets Highly leveragable business model with earnings upside Experienced management team with strong execution track record Strong cash flow generation Attractive dividend yield at 1.9% Strong balance sheet EQ acquisition provides levers for future growth
25 Appendix

26 Environmental Services Segment (“ES”) Provides hazardous and non - hazardous materials management services at Company - owned treatment and disposal facilities Services include waste disposal, treatment, recycling and transportation Key assets include: ― 5 hazardous waste landfills ― 1 commercially licensed radioactive waste landfill ― 21 Treatment and Recycling Facilities Included in this segment: Legacy US Ecology business Legacy EQ’s treatment, disposal and recycling facilities 2014 Statistics for ES Segment (includes legacy EQ ES results from acquisition date) Revenue: $319.8 million Adjusted EBITDA 1 : $123.3 million Adjusted EBITDA Margin : 40% 26 Field and Industrial Services (“FIS”) Field Services: Provides packaging, collection and waste management solutions at customer sites and our 10 - day storage facilities Sample services include: ― LTL Collection ― Lab pack ― Transportation ― Onsite total waste management ― Retail services ― Remediation Industrial Services: Provides specialty cleaning, maintenance and excavation services at customers’ industrial sites Sample Services include: ― Industrial Cleaning ― Refinery services / tank cleaning ― Decontamination services ― Emergency response services Performed through 24 service centers and retail satellites 2014 Statistics for FIS Segment (acquired in June 2014) Revenue: $127.6 million (including $37.0 from APV) Adjusted EBITDA 1 : $8.5 million (including $5.0 from APV) Adjusted EBITDA Margin: 7 % Corporate Cost center providing sales and administrative support across segments 2014 Adjusted EBITDA 1 : ($22.8) million Segment Overview 1 See definition and reconciliation of Adjusted EBITDA and Adjusted earnings per share on pages 31 – 38 of this presentation

27 27 Q3YTD Pro Forma Income Statement Refer to Form 8 - K filed with the SEC on November 4, 2015 for footnotes and more detail Reported Allstate Pro Forma Reported Allstate Pro Forma Revenue 424,797$ 50,999$ 373,798$ 290,237$ 19,578$ 270,659$ Direct operating costs 297,543 40,208 257,335 190,664 15,329 175,335 Gross profit 127,254 10,791 116,463 99,573 4,249 95,324 Selling, general and administrative expenses 71,075 9,910 61,165 46,271 3,644 42,627 Impairment charges 6,700 6,367 333 - - - Operating income 49,479 (5,486) 54,965 53,302 605 52,697 Other income (expense): Interest income 64 - 64 94 - 94 Interest expense (16,208) (27) (16,181) (5,488) (83) (5,405) Foreign currency loss (1,769) - (1,769) (1,027) - (1,027) Other 1,156 99 1,057 557 (221) 778 Total other income (expense) (16,757) 72 (16,829) (5,864) (304) (5,560) Income before income taxes 32,722 (5,414) 38,136 47,438 301 47,137 Income tax expense (benefit) 14,815 (2,057) 16,872 17,880 114 17,766 Net income 17,907$ (3,357)$ 21,264$ 29,558$ 187$ 29,371$ Earnings per share: Basic 0.83$ ( 0.16 )$ 0.99$ 1.37$ 0.01$ 1.36$ Diluted 0.82$ ( 0.15 )$ 0.99$ 1.37$ 0.01$ 1.36$ Shares used in earnings per share calculation: Basic 21,619 21,619 21,619 21,526 21,526 21,526 Diluted 21,723 21,723 21,723 21,649 21,649 21,649 Net Income 17,907$ (3,357)$ 21,264$ 29,558$ 187$ 29,371$ Income tax expense (benefit) 14,815 (2,057) 16,872 17,880$ 114$ 17,766 Interest expense 16,208 27 16,181 5,488 83 5,405 Interest income (64) - (64) (94) - (94) Foreign currency loss 1,769 - 1,769 1,027 - 1,027 Other (income) expense (1,156) (99) (1,057) (557) 221 (778) Impairment charges 6,700 6,367 333 - - - Depreciation and amortization of plant and equipment 21,726 2,243 19,483 16,730 1,233 15,497 Amortization of intangible assets 9,558 1,373 8,185 5,233 714 4,519 Stock-based compensation 1,736 56 1,680 869 7 862 Accretion and non-cash adjustments of closure & post- closure obligations 3,208 - 3,208 1,675 - 1,675 Adjusted EBITDA 92,407$ 4,553$ 87,854$ 77,809 2,559$ 75,250$ Nine Months Ended September 30, 2014Nine Months Ended September 30, 2015

28 28 Allstate PowerVac Quarterly Income Statements June 30, 2014 September 30, 2014 December 31, 2014 March 31, 2015 June 30, 2015 September 30, 2015 Revenue 2,603$ 16,975$ 17,445$ 13,935$ 16,925$ 20,139$ Direct operating costs 2,035 13,294 13,469 11,293 13,666 15,249 Gross profit 568 3,681 3,976 2,642 3,259 4,890 Selling, general and administrative expenses 439 3,205 2,979 3,040 3,657 3,213 Impairment charges - - - - 6,367 - Operating income 129 476 997 (398) (6,765) 1,677 Other income (expense): Interest income - - - - - - Interest expense (61) (22) (24) (21) (6) - Foreign currency loss - - - - - - Other (32) (189) (188) 33 33 33 Total other income (expense) (93) (211) (212) 12 27 33 Income before income taxes 36 265 785 (386) (6,738) 1,710 Income tax expense (benefit) 14 101 298 (147) (2,560) 650 Net income 22$ 164$ 487$ (239)$ (4,178)$ 1,060$ Earnings per share: Basic 0.00$ 0.01$ 0.02$ ( 0.01 )$ ( 0.19 )$ 0.05$ Diluted 0.00$ 0.01$ 0.02$ ( 0.01 )$ ( 0.19 )$ 0.05$ Shares used in earnings per share calculation: Basic 21,528 21,570 21,571 21,583 21,617 21,655 Diluted 21,667 21,680 21,673 21,689 21,748 21,749 Net Income 22$ 164$ 487$ (239)$ (4,178)$ 1,060$ Income tax expense 14 101 298 (147) (2,560) 650 Interest expense 61 22 24 21 6 - Interest income - - - - - - Foreign currency loss - - - - - - Other income 32 189 188 (33) (33) (33) Impairment charges - - - - 6,367 - Depreciation and amortization of plant and equipment 214 1,019 828 899 967 377 Amortization of intangible assets 89 625 620 569 569 235 Stock-based compensation - 7 11 12 20 24 Accretion and non-cash adjustments of closure & post-closure obligations - - - - - - Adjusted EBITDA 432$ 2,127$ 2,456$ 1,082$ 1,158$ 2,313$ *Allstate was acquired on June 17, 2014 as part of the EQ acquistion For the Three Months Ended

29 29 Allstate PowerVac 9 month and 2014 Income Statements For the Year Ended September 30, 2015 September 30, 2014 December 31, 2014 Revenue 50,999$ 19,578$ 37,023$ Direct operating costs 40,208 15,329 28,798 Gross profit 10,791 4,249 8,225 Selling, general and administrative expenses 9,910 3,644 6,623 Impairment charges 6,367 - - Operating income (5,486) 605 1,602 Other income (expense): Interest income - - - Interest expense (27) (83) (107) Foreign currency loss - - - Other 99 (221) (409) Total other income (expense) 72 (304) (516) Income before income taxes (5,414) 301 1,086 Income tax expense (benefit) (2,057) 114 413 Net income (3,357)$ 187$ 673$ Earnings per share: Basic ( 0.16 )$ 0.01$ 0.03$ Diluted ( 0.15 )$ 0.01$ 0.03$ Shares used in earnings per share calculation: Basic 21,619 21,526 21,537 Diluted 21,723 21,649 21,655 Net Income (3,357)$ 187$ 673$ Income tax expense (2,057) 114 413 Interest expense 27 83 107 Interest income - - - Foreign currency loss - - - Other income (99) 221 409 Impairment charges 6,367 - - Depreciation and amortization of plant and equipment 2,243 1,233 2,061 Amortization of intangible assets 1,373 714 1,334 Stock-based compensation 56 7 18 Accretion and non-cash adjustments of closure & post-closure obligations - - - Adjusted EBITDA 4,553$ 2,559$ 5,015$ *Allstate was acquired on June 17, 2014 as part of the EQ acquistion For the Nine Months Ended

30 ■ “Base” and “Event” Business was redefined in Q 3 2015 as legacy EQ ES business was incorporated into these metrics ■ “ Base Business” now includes some historic “Event” business that had less than 1 , 000 tons ■ “Event business” now all non - recurring projects that are equal to, or greater than 1 , 000 tons ■ New definitions provide a better representation and better insight into the business ■ Prior periods presented will be recast based on the new definition as noted below Base Business Lends Stability to Revenue Q2 '15 Q1 '15 Q4 '14 Q3 '14 Q2 '14 Q1 '14 As previously defined: Base 68% 61% 61% 59% 61% 56% Event 32% 39% 39% 41% 39% 44% Increase/decrease from comparable quarter: Base 3% 7% n/a n/a n/a n/a Event -23% -17% n/a n/a n/a n/a As currently defined: Base 76% 67% 68% 70% 70% 65% Event 24% 33% 32% 30% 30% 35% Increase/decrease from comparable quarter: Base 3% 2% n/a n/a n/a n/a Event -26% -9% n/a n/a n/a n/a Legacy USE Environmental Services T&D Revenue

31 US Ecology reports adjusted EBITDA, adjusted earnings per diluted share, pro forma Adjusted EBITDA, pro forma earnings per diluted per share and pro forma revenue results, which are non - GAAP financial measures, as a complement to results provided in accordance with generally accepted accounting principles in the United States (GAAP) and believes that such information provides analysts, stockholders, and other users information to better understand the Company’s operating performance . Because adjusted EBITDA, adjusted earnings per diluted share, pro forma Adjusted EBITDA , pro forma earnings per diluted per share and pro forma revenue are not measurements determined in accordance with GAAP and are thus susceptible to varying calculations they may not be comparable to similar measures used by other companies . Items excluded from adjusted EBITDA, adjusted earnings per diluted share, pro forma Adjusted EBITDA , pro forma earnings per diluted per share and pro forma revenue are significant components in understanding and assessing financial performance . Adjusted EBITDA, adjusted earnings per diluted share, pro forma Adjusted EBITDA , pro forma earnings per diluted per share and pro forma revenue should not be considered in isolation or as an alternative to, or substitute for, revenue, net income, cash flows generated by operations, investing or financing activities, or other financial statement data presented in the consolidated financial statements as indicators of financial performance or liquidity . Adjusted EBITDA , adjusted earnings per diluted share, pro forma Adjusted EBITDA , pro forma earnings per diluted per share and pro forma revenue have limitations as analytical tools and should not be considered in isolation or a substitute for analyzing our results as reported under GAAP . 31 Adjusted and Pro Forma EBITDA, EPS & Revenue

32 Adjusted EBITDA The Company defines adjusted EBITDA as net income before interest expense, interest income, income tax expense, depreciation, amortization, stock based compensation, accretion of closure and post - closure liabilities, foreign currency gain/loss, non - cash impairment charges and other income/expense, which are not considered part of usual business operations . Adjusted Earnings Per Diluted Share The Company defines adjusted earnings per diluted share as net income plus the after tax impact of non - cash, non - operational impairment charges and foreign currency gains or losses (“Foreign Currency Gain/Loss”) plus the after tax impact of business development costs divided by the number of diluted shares used in the earnings per share calculation . Impairment charges excluded from the earnings per diluted share calculation are related to the Company’s decision to explore strategic alternatives for our Industrial Services business . The Foreign Currency Gain/Loss excluded from the earnings per diluted share calculation are related to intercompany loans between our Canadian subsidiary and the U . S . parent which have been established as part of our tax and treasury management strategy . These intercompany loans are payable in Canadian dollars (“CAD”) requiring us to revalue the outstanding loan balance through our consolidated income statement based on the CAD/United States currency movements from period to period . We believe excluding the currency movements for these intercompany financial instruments provides meaningful information to investors regarding the operational and financial performance of the Company . Business development costs relate to expenses incurred to evaluate businesses for potential acquisition or costs related to closing and integrating successfully acquired businesses . We believe excluding these non - cash impairment charges, foreign currency movements for intercompany financial instruments and business development costs provides meaningful information to investors regarding the operational and financial performance of the Company . 32 Definitions of Adjusted EBITDA and EPS

33 33 Financial Results: Q3‘15 vs. Q3‘14 1 Includes pre - tax Business Development expenses of $0.2 million and $0.3 million for the three months ended September 30, 2015 and 2014, respectively amounts in thousands except per share data 2015 2014 $ Change % Change Revenue $ 148,414 $ 170,864 $ (22,450) -13.1% Gross profit 45,940 52,308 (6,368) -12.2% SG&A 1 23,507 25,508 Operating income 1 22,433 26,800 (4,367) -16.3% Interest expense, net (5,064) (4,532) (532) 11.7% Foreign currency loss (994) (830) (164) 19.8% Other 387 301 86 28.6% Income before income taxes 16,762 21,739 (4,977) -22.9% Income tax expense 6,858 8,406 (1,548) -18.4% Net income $ 9,904 $ 13,333 $ (3,429) -25.7% Earnings per share: Basic $ 0.46 $ 0.62 $ (0.16) -25.8% Diluted $ 0.46 $ 0.61 $ (0.15) -24.6% Shares used in earnings per share calculation: Basic 21,655 21,570 Diluted 21,749 21,680 Adjusted EBITDA Reconciliation Net income 9,904$ 13,333$ Income tax expense 6,858 8,406 Interest expense, net 5,064 4,532 Foreign currency gain 994 830 Other income (387) (301) Impairment charges - - Depreciation and amortization 6,591 8,318 Amortization of intangibles 2,952 4,018 Stock-based compensation 646 344 Accretion and non-cash adjustments of closure & post-closure obligations 1,132 959 Adjusted EBITDA 1 33,754$ 40,439$ (6,685)$ -16.5% Three Months Ended September 30,

34 34 Financial Results: Q3‘15 vs. Q3‘14 (in thousands, except per share data) Adjusted Earnings Per Share Reconciliation per share per share Net income / earnings per diluted share 9,904$ 0.46$ 13,333$ 0.62$ Adjustments, net of tax: Impairment charges - - - - Non-cash foreign currency translation loss 722 0.04 679 0.03 Business development costs 93 - 211 0.01 Adjusted net income / adjusted earnings per diluted share 10,718$ $ 0.50 14,223$ $ 0.65 Shares used in earnings per diluted share calculation 21,749 21,680 Three Months Ended September 30, 2015 2014

35 35 Financial Results: Q3’15 Adjusted EBITDA 1 Includes pre - tax Business Development expenses of $0.2 million for the three months ended September 30, 2015 (in thousands) Legacy US Ecology Legacy EQ Consolidated US Ecology Net Income (loss) 3,117$ 6,787$ 9,904$ Income tax expense 1,544 5,314 6,858 Interest expense, net 5,061 3 5,064 Foreign currency gain 994 - 994 Other income (132) (255) (387) Impairment charges - - - Depreciation and amortization 3,634 2,957 6,591 Amortization of intangibles 300 2,652 2,952 Stock-based compensation 518 128 646 Accretion and non-cash adjustments of closure & post-closure obligations 498 634 1,132 Adjusted EBITDA 1 15,534$ 18,220$ 33,754$ Three Months Ended September 30, 2015

36 36 Financial Results: Q3’15 YTD vs. Q3’14 YTD 1 Includes pre - tax Business Development expenses of $2.1 million and $5.6 million for the nine months ended September 30, 2015 and 2014, respectively amounts in thousands except per share data 2015 2014 $ Change % Change Revenue $ 424,797 $ 290,237 $ 134,560 46.4% Gross profit 127,254 99,573 27,681 27.8% SG&A 1 71,075 46,271 Impairment charges 6,700 - 6,700 n/m Operating income 1 49,479 53,302 (3,823) -7.2% Interest expense, net (16,144) (5,394) (10,750) 199.3% Foreign currency loss (1,769) (1,027) (742) 72.2% Other 1,156 557 599 107.5% Income before income taxes 32,722 47,438 (14,716) -31.0% Income tax expense 14,815 17,880 (3,065) -17.1% Net income $ 17,907 $ 29,558 $ (11,651) -39.4% Earnings per share: Basic $ 0.83 $ 1.37 $ (0.54) -39.4% Diluted $ 0.82 $ 1.37 $ (0.55) -40.1% Shares used in earnings per share calculation: Basic 21,619 21,526 Diluted 21,723 21,649 Adjusted EBITDA Reconciliation Net Income 17,907$ 29,558$ Income tax expense 14,815 17,880 Interest expense, net 16,144 5,394 Foreign currency loss 1,769 1,027 Other income (1,156) (557) Impairment charges 6,700 - Depreciation and amortization 21,726 16,730 Amortization of intangibles 9,558 5,233 Stock-based compensation 1,736 869 Accretion and non-cash adjustments of closure & post-closure obligations 3,208 1,675 Adjusted EBITDA 1 92,407$ 77,809$ 14,598$ 18.8% Nine Months Ended June 30,
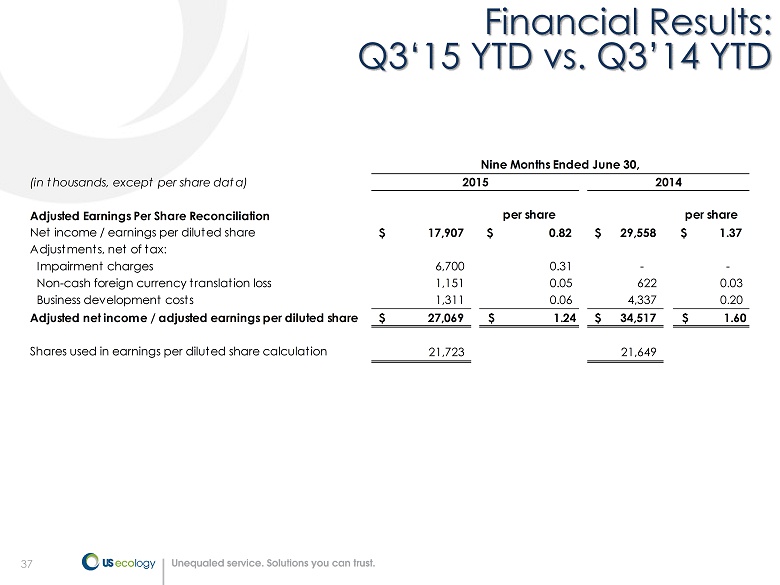
37 37 Financial Results: Q3‘15 YTD vs. Q3’14 YTD (in thousands, except per share data) Adjusted Earnings Per Share Reconciliation per share per share Net income / earnings per diluted share 17,907$ 0.82$ 29,558$ 1.37$ Adjustments, net of tax: Impairment charges 6,700 0.31 - - Non-cash foreign currency translation loss 1,151 0.05 622 0.03 Business development costs 1,311 0.06 4,337 0.20 Adjusted net income / adjusted earnings per diluted share 27,069$ $ 1.24 34,517$ $ 1.60 Shares used in earnings per diluted share calculation 21,723 21,649 Nine Months Ended June 30, 2015 2014

38 38 Financial Results: Q3’15 YTD Adjusted EBITDA 1 Includes pre - tax Business Development expenses of $2.1 million for the nine months ended September 30, 2015 (in thousands) Legacy US Ecology Legacy EQ Consolidated US Ecology Net income 11,043$ 6,864$ 17,907$ Income tax expense 5,257 9,558 14,815 Interest expense, net 15,966 178 16,144 Foreign currency loss 1,769 - 1,769 Other income (677) (479) (1,156) Impairment charges - 6,700 6,700 Depreciation and amortization 10,579 11,147 21,726 Amortization of intangibles 934 8,624 9,558 Stock-based compensation 1,397 339 1,736 Accretion and non-cash adjustments of closure & post-closure obligations 1,376 1,832 3,208 Adjusted EBITDA 1 47,644$ 44,763$ 92,407$ Nine Months Ended September 30, 2015

39 39 Financial Results: Free Cash Flow Nine Months Ended (in thousands) 9/30/2015 12/31/2014 12/31/2013 Net income 17,907$ 38,236$ 32,151$ Foreign currency loss, after tax 1,092 916 1,443 Impairment charges 6,700 - - Depreciation and amortization 21,726 24,413 14,815 Amortization of intangibles 9,558 8,207 1,461 Stock-based compensation 1,736 1,250 865 Accretion and non-cash adjustments of closure & post-closure obligations 3,208 2,656 1,114 Capital expenditures (25,693) (28,434) (21,373) Free Cash Flow 36,234$ 47,244$ 30,476$ Year Ended
US Ecology (NASDAQ:ECOL)
Historical Stock Chart
From Mar 2024 to Apr 2024

US Ecology (NASDAQ:ECOL)
Historical Stock Chart
From Apr 2023 to Apr 2024
