UNITED STATES
SECURITIES AND EXCHANGE COMMISSION
Washington, D.C. 20549
FORM 8-K
CURRENT REPORT
Pursuant
to Section 13 or 15(d)
of the Securities Exchange Act of 1934
Date of Report (Date of earliest event reported): November 10, 2015
ALBEMARLE CORPORATION
(Exact Name of Registrant as Specified in its Charter)
|
|
|
|
|
| Virginia |
|
001-12658 |
|
54-1692118 |
| (State or Other Jurisdiction
of Incorporation) |
|
(Commission
File Number) |
|
(I.R.S. Employer
Identification Number) |
451 Florida Street, Baton Rouge, Louisiana 70801
(Address of Principal Executive Offices, including Zip Code)
Registrant’s Telephone Number, including Area Code: (225) 388-8011
Not Applicable
(Former
Name or Former Address, if Changed Since Last Report)
Check the
appropriate box below if the Form 8-K filing is intended to simultaneously satisfy the filing obligation of the registrant under any of the following provisions:
| |
¨ |
Written communications pursuant to Rule 425 under the Securities Act (17 CFR 230.425) |
| |
¨ |
Soliciting material pursuant to Rule 14a-12 under the Exchange Act (17 CFR 240.14a-12) |
| |
¨ |
Pre-commencement communications pursuant to Rule 14d-2(b) under the Exchange Act (17 CFR 240.14d-2(b)) |
| |
¨ |
Pre-commencement communications pursuant to Rule 13e-4(c) under the Exchange Act (17 CFR 240.13e-4(c)) |
| Item 7.01 |
Regulation FD Disclosure. |
On November 10, 2015, President and CEO Luke Kissam will
present at the 4th Annual Morgan Stanley Global Chemicals and Agriculture Conference in Boston, MA at 2:20 p.m. EST. The presentation to be used during the event is attached as Exhibit 99.1 to
this Form 8-K. The presentation will also be available via webcast. Interested parties may register for the webcast through the Investors section of the Company’s website at www.albemarle.com.
In accordance with General Instruction B.2 of Form 8-K, the information in this Current Report on Form 8-K, including Exhibit 99.1, shall not
be deemed “filed” for the purposes of Section 18 of the Securities Exchange Act of 1934, as amended, or otherwise subject to the liability of that section, nor shall it be deemed incorporated by reference in any filing under the
Securities Act of 1933, as amended, except as shall be expressly set forth by specific reference in such a filing.
| Item 9.01. |
Financial Statements and Exhibits. |
|
|
|
|
|
| 99.1 |
|
Presentation November 10, 2015. |
SIGNATURE
Pursuant to the requirements of the Securities Exchange Act of 1934, as amended, the registrant has duly caused this report to be signed on
its behalf by the undersigned thereunto duly authorized.
|
|
|
|
|
|
|
|
|
|
|
ALBEMARLE CORPORATION |
|
|
|
|
| Date: November 9, 2015 |
|
|
|
By: |
|
/s/ Karen G. Narwold |
|
|
|
|
|
|
Karen G. Narwold |
|
|
|
|
|
|
Senior Vice President, General Counsel, Corporate & Government Affairs, Corporate Secretary |
EXHIBIT INDEX
|
|
|
| Exhibit
Number |
|
Description |
|
|
| 99.1 |
|
Presentation November 10, 2015. |
Exhibit 99.1
Albemarle Corporation Investor Presentation
November 2015
ALBEMARLE
Forward Looking Statements
Some of the
information presented in this presentation and the discussions that follow, including, without limitation, statements with respect to the transaction with Rockwood and the anticipated consequences and benefits of the transaction, product
development, changes in productivity, market trends, price, expected growth and earnings, input costs, surcharges, tax rates, stock repurchases, dividends, cash flow generation, costs and cost synergies, portfolio diversification, economic trends,
outlook and all other information relating to matters that are not historical facts may constitute forward-looking statements within the meaning of the Private Securities Litigation Reform Act of 1995. There can be no assurance that actual results
will not differ materially.
Factors that could cause actual results to differ materially include, without
limitation: changes in economic and business conditions; changes in financial and operating performance of our major customers and industries and markets served by us; the timing of orders received from customers; the gain or loss of significant
customers; competition from other manufacturers; changes in the demand for our products; limitations or prohibitions on the manufacture and sale of our products; availability of raw materials; changes in the cost of raw materials and energy; changes
in our markets in general; fluctuations in foreign currencies; changes in laws and government regulation impacting our operations or our products; the occurrence of claims or litigation; the occurrence of natural disasters; the inability to maintain
current levels of product or premises liability insurance or the denial of such coverage; political unrest affecting the global economy; political instability affecting our manufacturing operations or joint ventures; changes in accounting standards;
the inability to achieve results from our global manufacturing cost reduction initiatives as well as our ongoing continuous improvement and rationalization programs; changes in the jurisdictional mix of our earnings and changes in tax laws and
rates; changes in monetary policies, inflation or interest rates; volatility and substantial uncertainties in the debt and equity markets; technology or intellectual property infringement; decisions we may make in the future; the ability to
successfully operate and integrate Rockwood’s operations and realize estimated synergies; and the other factors detailed from time to time in the reports we file with the SEC, including those described under “Risk Factors” in the
joint proxy statement / prospectus we filed in connection with the transaction with Rockwood, and in our Annual Report on Form 10-K and our Quarterly Reports on Form 10-Q. These forward-looking statements speak only as of the date of this
presentation. We assume no obligation to provide any revisions to any forward-looking statements should circumstances change, except as otherwise required by securities and other applicable laws. ALBEMARLE
Non-GAAP Financial Measures
It should be noted
that adjusted net income attributable to Albemarle Corporation (“adjusted earnings”), adjusted diluted earnings per share, adjusted effective income tax rates, segment operating profit, segment income, EBITDA, adjusted EBITDA, adjusted
EBITDA by operating segment, EBITDA margin and adjusted EBITDA margin are financial measures that are not required by, or presented in accordance with, accounting principles generally accepted in the United States, or GAAP. These measures are
presented here to provide additional useful measurements to review our operations, provide transparency to investors and enable period-to-period comparability of financial performance.
A description of these and other non-GAAP financial measures that we use to evaluate our operations and financial
performance, and reconciliation of these non-GAAP financial measures to the most directly comparable financial measures calculated and reported in accordance with GAAP, can be found in the Appendix to this presentation, which is posted in the
Investors section of our website at www.albemarle.com, under “Non-GAAP Reconciliations” under “Financials.”
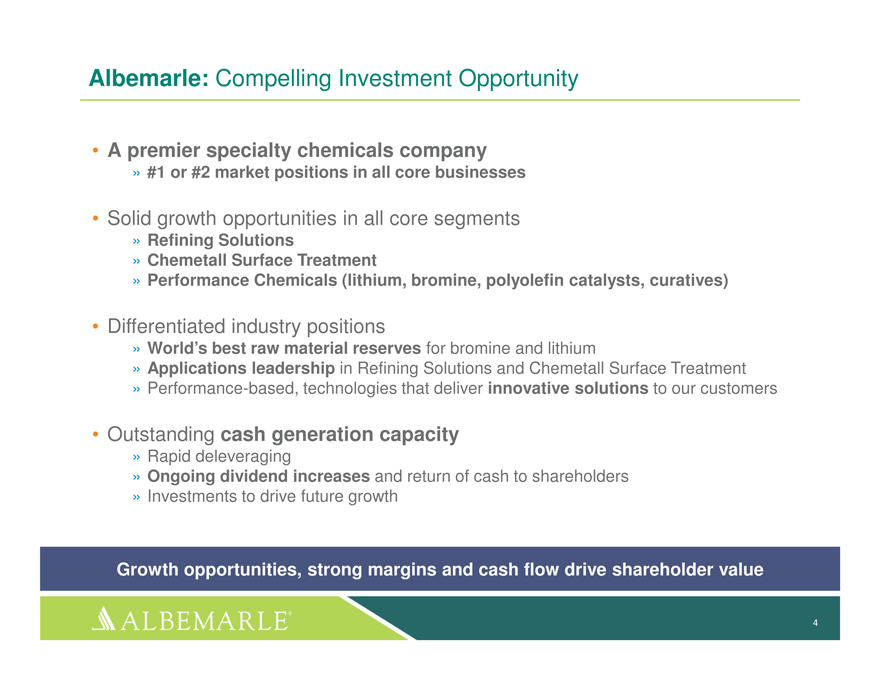
Albemarle: Compelling Investment Opportunity• A premier specialty chemicals company» #1 or #2 market positions in all core businesses• Solid growth opportunities in all
core segments» Refining Solutions » Chemetall Surface Treatment» Performance Chemicals (lithium, bromine, polyolefin catalysts, curatives)• Differentiated industry positions» World’s best raw material reserves for
bromine and lithium» Applications leadership in Refining Solutions and Chemetall Surface Treatment » Performance-based, technologies that deliver innovative solutions to our customers• Outstanding cash generation capacity »
Rapid deleveraging » Ongoing dividend increases and return of cash to shareholders» Investments to drive future growth Growth opportunities, strong margins and cash flow drive shareholder value4 ALBEMARLE
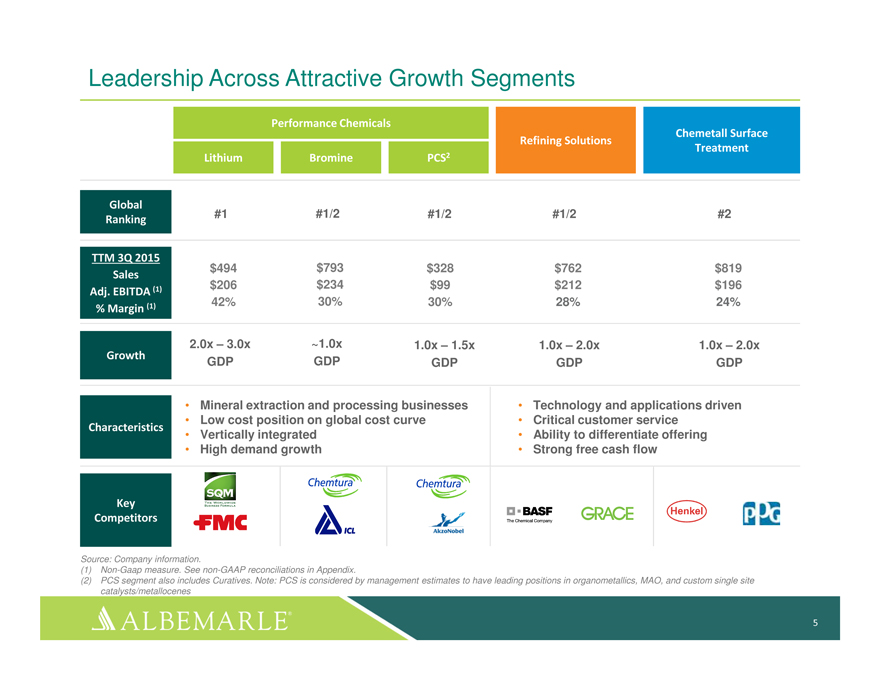
Leadership Across Attractive Growth SegmentsPerformance ChemicalsChemetall Surface Refining Solutions 2 Treatment Lithium Bromine PCSGlobal #1 #1/2 #1/2 #1/2 #2RankingTTM 3Q 2015 $494 $793
$328 $762 $819Sales(1) $206 $234 $99 $212 $196Adj. EBITDA (1) 42% 30% 30% 28% 24%% Margin 2.0x – 3.0x ~1.0x 1.0x – 1.5x 1.0x – 2.0x 1.0x – 2.0xGrowthGDP GDP GDP GDP GDP• Mineral extraction and processing businesses
• Technology and applications driven• Low cost position on global cost curve • Critical customer serviceCharacteristics• Vertically integrated • Ability to differentiate offering • High demand growth • Strong free
cash flowKey CompetitorsSource: Company information.(1) Non-Gaap measure. See non-GAAP reconciliations in Appendix.(2) PCS segment also includes Curatives. Note: PCS is considered by management estimates to have leading positions in organometallics,
MAO, and custom single site catalysts/metallocenes5 ALBEMARLE
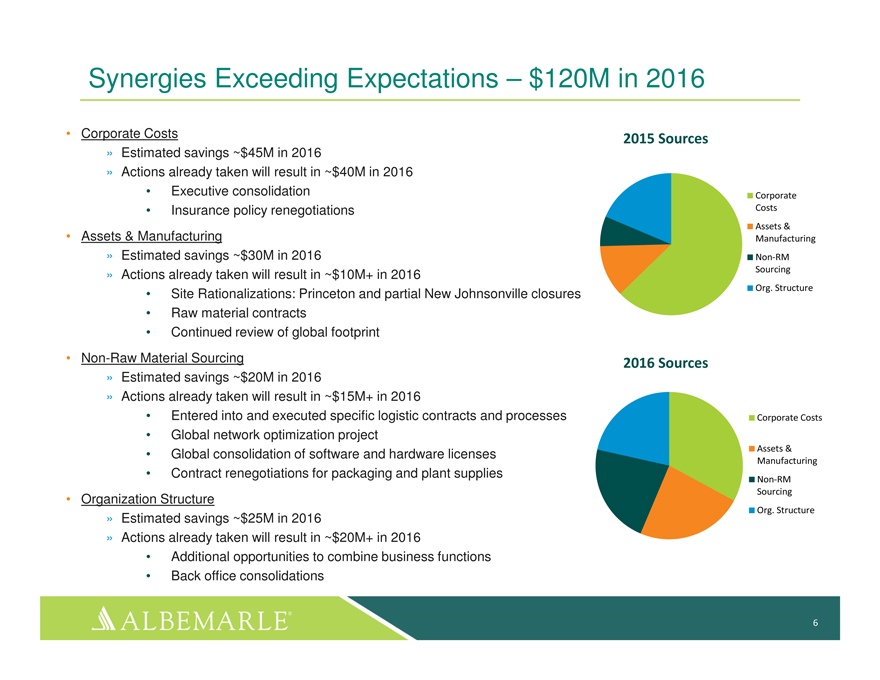
Synergies Exceeding Expectations – $120M in 2016
| • |
|
Corporate Costs 2015 Sources |
» Estimated savings ~$45M in 2016
» Actions already taken will result in ~$40M in 2016
| • |
|
Executive consolidation Corporate |
| • |
|
Insurance policy renegotiations Costs |
Assets &
| • |
|
Assets & Manufacturing Manufacturing |
» Estimated savings ~$30M in 2016 Non-RM
» Actions already taken will result in ~$10M+ in 2016 Sourcing
Org. Structure
| • |
|
Site Rationalizations: Princeton and partial New Johnsonville closures |
| • |
|
Continued review of global footprint |
| • |
|
Non-Raw Material Sourcing 2016 Sources |
» Estimated savings ~$20M in 2016
» Actions already taken will result in ~$15M+ in 2016
| • |
|
Entered into and executed specific logistic contracts and processes Corporate Costs
|
| • |
|
Global network optimization project |
Assets &
| • |
|
Global consolidation of software and hardware licenses |
Manufacturing
| • |
|
Contract renegotiations for packaging and plant supplies |
Non-RM Sourcing
Org. Structure
» Estimated savings ~$25M in 2016
»
Actions already taken will result in ~$20M+ in 2016
| • |
|
Additional opportunities to combine business functions |
| • |
|
Back office consolidations |
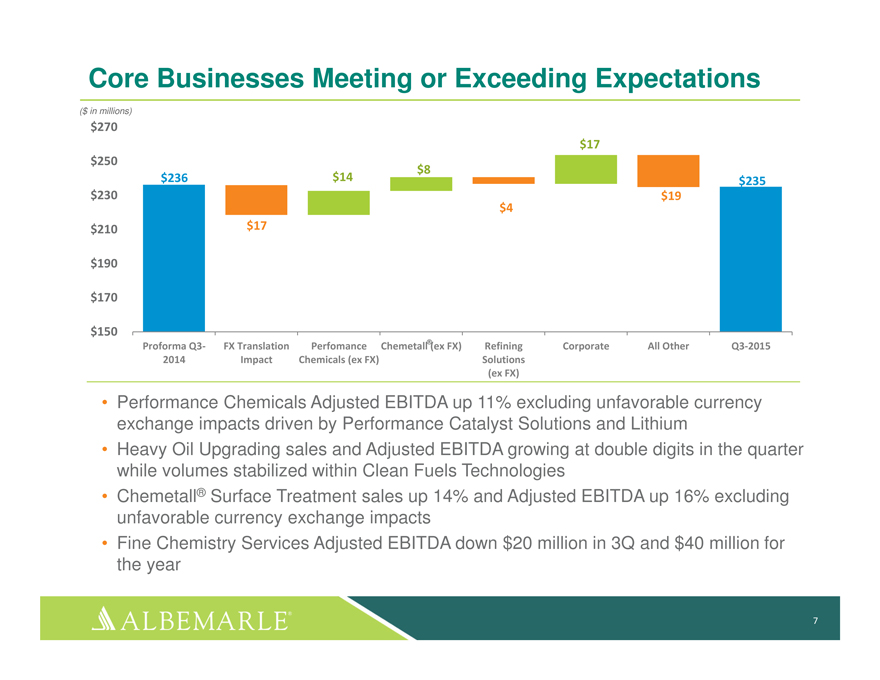
Core Businesses Meeting or Exceeding Expectations
($ in millions)
$270 $17 $250 $8 $236 $14 $235 $230 $19 $4 $210 $17
$190
$170
$150
Proforma Q3- FX Translation Perfomance Chemetall®(ex FX) Refining Corporate All Other Q3-2015 2014
Impact Chemicals (ex FX) Solutions (ex FX)
| • |
|
Performance Chemicals Adjusted EBITDA up 11% excluding unfavorable currency exchange impacts driven by
Performance Catalyst Solutions and Lithium |
| • |
|
Heavy Oil Upgrading sales and Adjusted EBITDA growing at double digits in the quarter while volumes stabilized
within Clean Fuels Technologies |
| • |
|
Chemetall® Surface Treatment sales up 14% and Adjusted EBITDA up 16% excluding unfavorable currency
exchange impacts |
| • |
|
Fine Chemistry Services Adjusted EBITDA down $20 million in 3Q and $40 million for the year
|
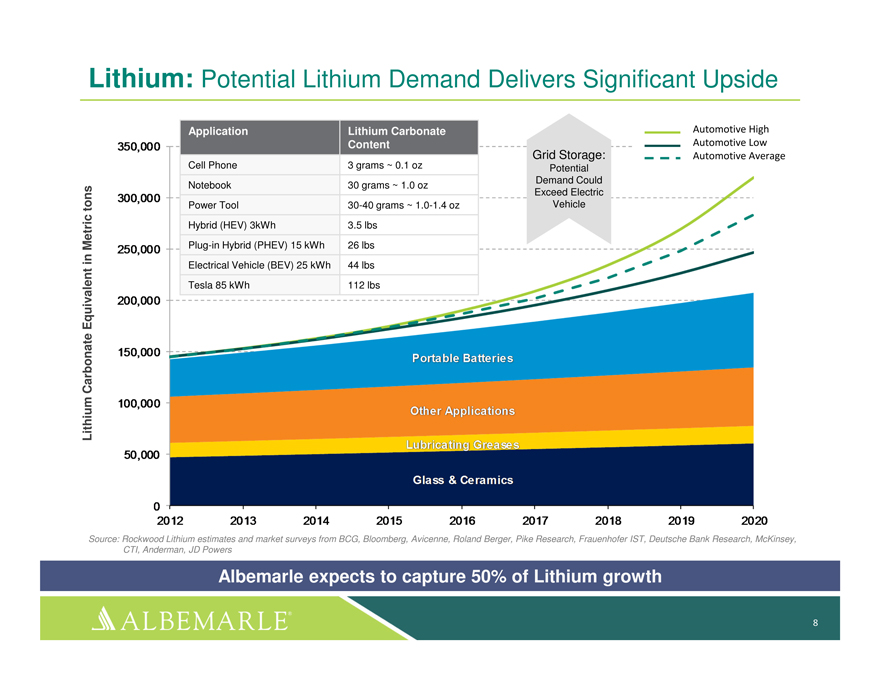
Lithium: Potential Lithium Demand Delivers Significant Upside
Application Lithium Carbonate Automotive High
Content Automotive Low Grid Storage: Automotive Average
Cell Phone 3 grams ~ 0.1 oz Potential Demand Could Notebook 30 grams ~ 1.0 oz Exceed Electric tons Power
Tool 30-40 grams ~ 1.0-1.4 oz Vehicle Hybrid (HEV) 3kWh 3.5 lbs Metric Plug-in Hybrid (PHEV) 15 kWh 26 lbs
in
Electrical Vehicle (BEV) 25 kWh 44 lbs Equivalent Tesla 85 kWh 112 lbs
Carbonate Lithium
Source: Rockwood Lithium estimates and market surveys from BCG, Bloomberg, Avicenne, Roland Berger, Pike Research, Frauenhofer IST, Deutsche Bank Research, McKinsey, CTI, Anderman, JD
Powers
Albemarle expects to capture 50% of Lithium growth
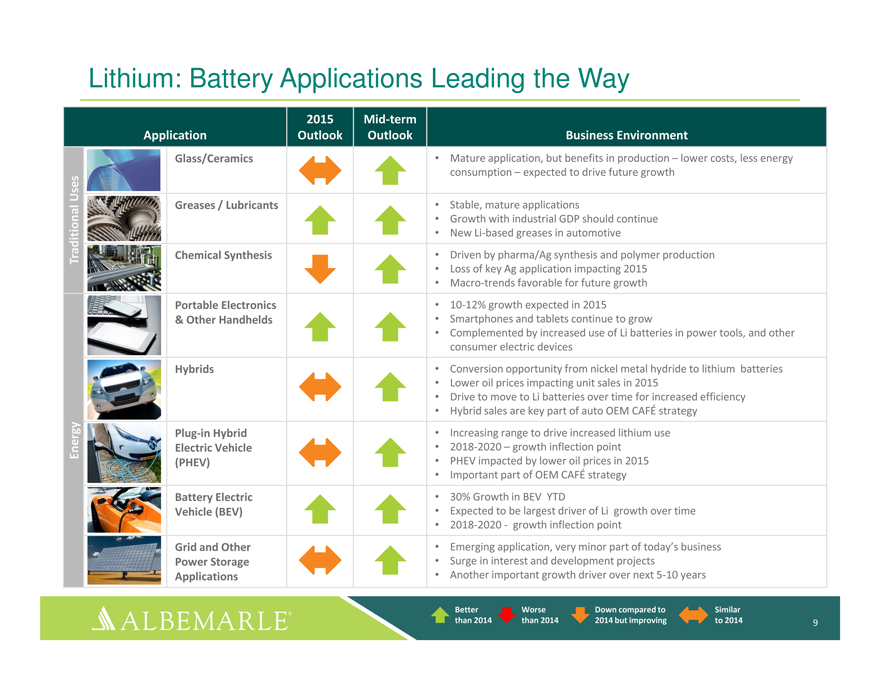
Lithium: Battery Applications Leading the Way
2015 Mid-term
Application Outlook Outlook Business Environment
Glass/Ceramics • Mature application, but benefits in production – lower costs, less energy Uses consumption
– expected to drive future growth Greases / Lubricants • Stable, mature applications
| • |
|
Growth with industrial GDP should continue |
| • |
|
New Li-based greases in automotive |
Traditional Chemical Synthesis • Driven by pharma/Ag synthesis and polymer production
| • |
|
Loss of key Ag application impacting 2015 |
| • |
|
Macro-trends favorable for future growth |
Portable Electronics • 10-12% growth expected in 2015
& Other Handhelds • Smartphones and tablets continue to grow
| • |
|
Complemented by increased use of Li batteries in power tools, and other consumer electric devices
|
Hybrids • Conversion opportunity from nickel metal hydride to lithium batteries
| • |
|
Lower oil prices impacting unit sales in 2015 |
| • |
|
Drive to move to Li batteries over time for increased efficiency |
| • |
|
Hybrid sales are key part of auto OEM CAFÉ strategy |
Plug-in Hybrid • Increasing range to drive increased lithium use Energy Electric Vehicle •
2018-2020 – growth inflection point (PHEV) • PHEV impacted by lower oil prices in 2015
| • |
|
Important part of OEM CAFÉ strategy |
Battery Electric • 30% Growth in BEV YTD
Vehicle (BEV) • Expected to be largest driver of Li growth over time
| • |
|
2018-2020—growth inflection point |
Grid and Other • Emerging application, very minor part of today’s business Power Storage • Surge in
interest and development projects Applications • Another important growth driver over next 5-10 years
Better Worse Down compared to Similar than 2014 than 2014 2014 but improving to 2014 9 ALBEMARLE
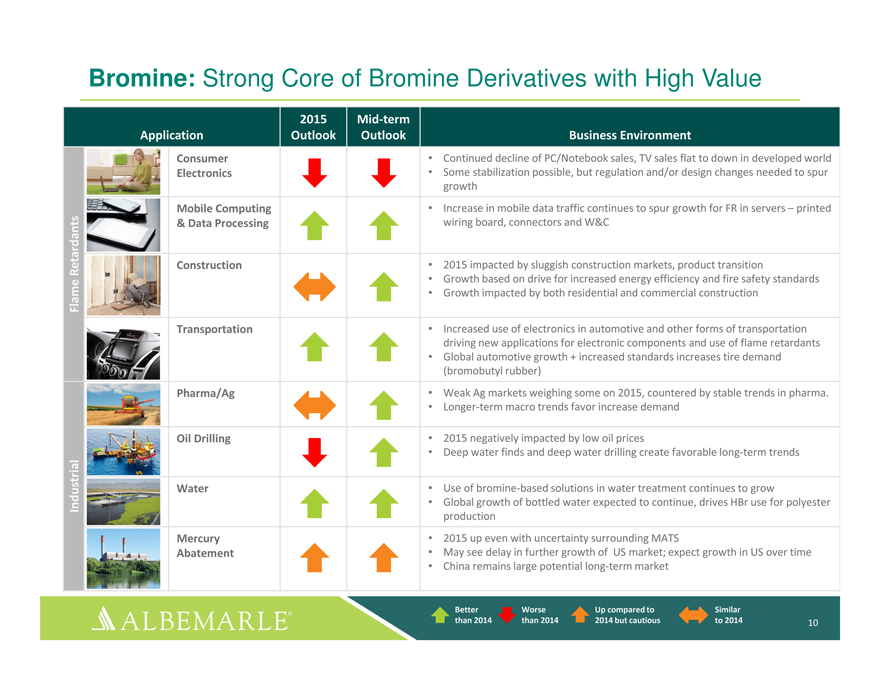
Bromine: Strong Core of Bromine Derivatives with High Value
2015 Mid-term
Application Outlook Outlook
Business Environment
Consumer • Continued decline of PC/Notebook sales, TV sales flat to
down in developed world Electronics • Some stabilization possible, but regulation and/or design changes needed to spur growth
Mobile Computing • Increase in mobile data traffic continues to spur growth for FR in servers – printed
& Data Processing wiring board, connectors and W&C
Retardants Construction • 2015 impacted by sluggish construction markets, product transition
• Growth based on drive for increased energy efficiency and fire safety standards Flame • Growth impacted by both residential and commercial construction Transportation •
Increased use of electronics in automotive and other forms of transportation driving new applications for electronic components and use of flame retardants
| • |
|
Global automotive growth + increased standards increases tire demand (bromobutyl rubber)
|
Pharma/Ag • Weak Ag markets weighing some on 2015, countered by stable trends in
pharma.
| • |
|
Longer-term macro trends favor increase demand |
Oil Drilling • 2015 negatively impacted by low oil prices
| • |
|
Deep water finds and deep water drilling create favorable long-term trends |
Water • Use of bromine-based solutions in water treatment continues to grow
Industrial • Global growth of bottled water expected to continue, drives HBr use for polyester production
Mercury • 2015 up even with uncertainty surrounding MATS
Abatement • May see delay in further growth of US market; expect growth in US over time
| • |
|
China remains large potential long-term market |
Better Worse Up compared to Similar than 2014 than 2014 2014 but cautious to 2014 10 ALBEMARLE
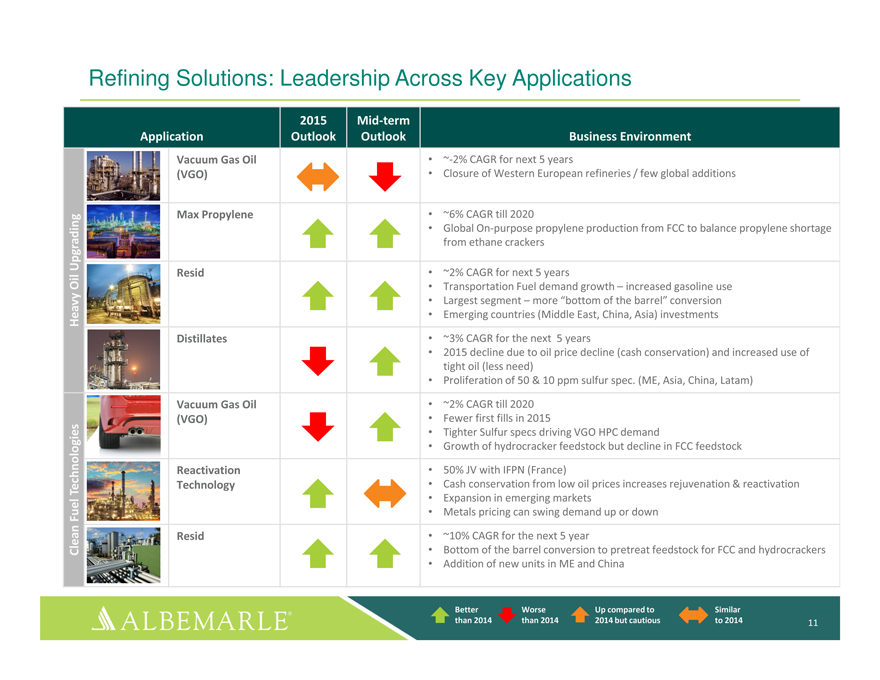
Refining Solutions: Leadership Across Key Applications
2015 Mid-term
Application Outlook Outlook
Business Environment
Vacuum Gas Oil • ~-2% CAGR for next 5 years
(VGO) • Closure of Western European refineries / few global additions
Max Propylene • ~6% CAGR till 2020
| • |
|
Global On-purpose propylene production from FCC to balance propylene shortage Upgrading from ethane crackers
Oil Resid ~2% CAGR for next 5 years |
• Transportation Fuel demand growth –
increased gasoline use
| • |
|
Largest segment – more “bottom of the barrel” conversion Heavy Emerging countries (Middle East,
China, Asia) investments Distillates ~3% CAGR for the next 5 years |
| • |
|
2015 decline due to oil price decline (cash conservation) and increased use of tight oil (less need)
|
| • |
|
Proliferation of 50 & 10 ppm sulfur spec. (ME, Asia, China, Latam) |
Vacuum Gas Oil • ~2% CAGR till 2020 (VGO) • Fewer first fills in 2015
| • |
|
Tighter Sulfur specs driving VGO HPC demand |
| • |
|
Growth of hydrocracker feedstock but decline in FCC feedstock |
Reactivation • 50% JV with IFPN (France)
Technologies Technology • Cash conservation from low oil prices increases rejuvenation & reactivation
• Expansion in emerging markets
Fuel •
Metals pricing can swing demand up or down Resid • ~10% CAGR for the next 5 year
Clean • Bottom of
the barrel conversion to pretreat feedstock for FCC and hydrocrackers
| • |
|
Addition of new units in ME and China |
Better Worse Up compared to Similar than 2014 than 2014 2014 but cautious to 2014 11 ALBEMARLE
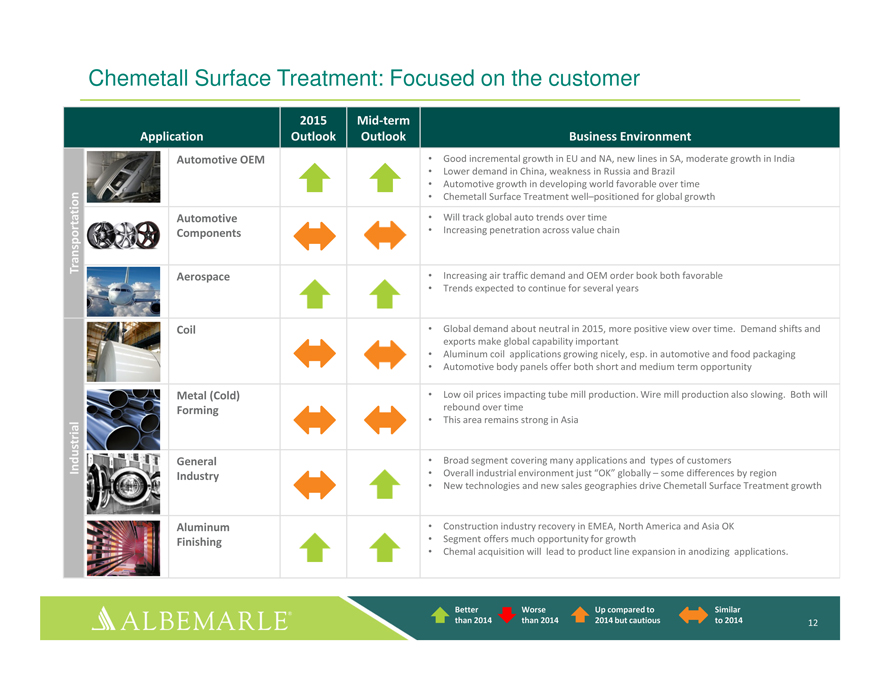
Chemetall Surface Treatment: Focused on the customer
2015 Mid-term
Application Outlook Outlook
Business Environment
Automotive OEM • Good incremental growth in EU and NA, new lines in SA, moderate
growth in India
| • |
|
Lower demand in China, weakness in Russia and Brazil |
| • |
|
Automotive growth in developing world favorable over time |
| • |
|
Chemetall Surface Treatment well–positioned for global growth |
Automotive • Will track global auto trends over time Transportation Components • Increasing penetration across
value chain
Aerospace • Increasing air traffic demand and OEM order book both favorable
| • |
|
Trends expected to continue for several years |
Coil • Global demand about neutral in 2015, more positive view over time. Demand shifts and exports make global
capability important
| • |
|
Aluminum coil applications growing nicely, esp. in automotive and food packaging |
| • |
|
Automotive body panels offer both short and medium term opportunity |
Metal (Cold) • Low oil prices impacting tube mill production. Wire mill production also slowing. Both will Forming
rebound over time
| • |
|
This area remains strong in Asia |
Industrial General • Broad segment covering many applications and types of customers
Industry • Overall industrial environment just “OK” globally – some differences by region
| • |
|
New technologies and new sales geographies drive Chemetall Surface Treatment growth
|
Aluminum • Construction industry recovery in EMEA, North America and Asia OK Finishing
• Segment offers much opportunity for growth
| • |
|
Chemal acquisition will lead to product line expansion in anodizing applications. |
Better Worse Up compared to Similar than 2014 than 2014 2014 but cautious to 2014 12 ALBEMARLE
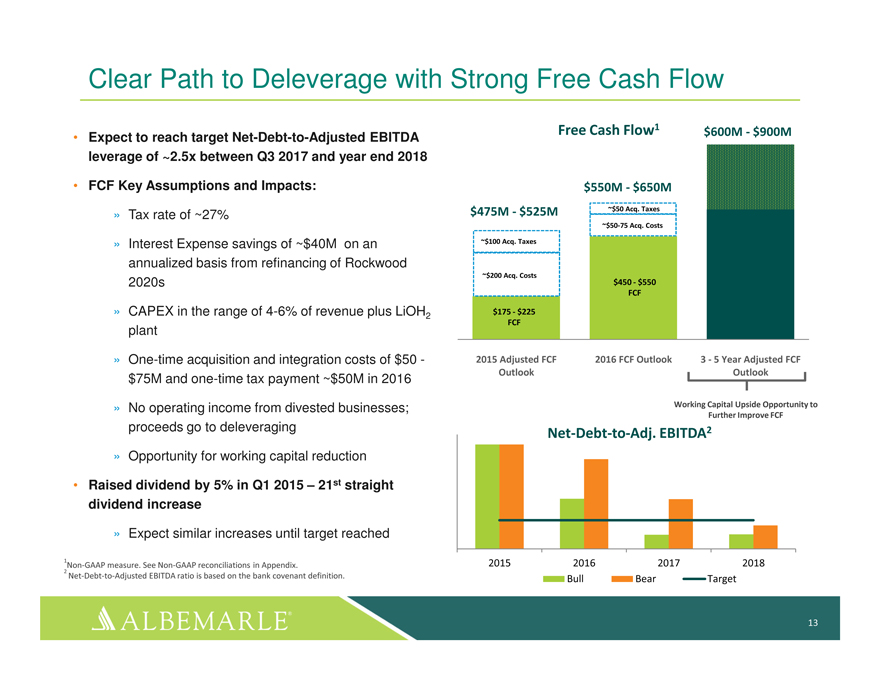
Clear Path to Deleverage with Strong Free Cash Flow
Free Cash Flow1 $600M—$900M
• Expect to reach target Net-Debt-to-Adjusted EBITDA leverage of ~2.5x between Q3 2017 and year end 2018
| • |
|
FCF Key Assumptions and Impacts: $550M—$650M |
$475M—$525M ~$50 Acq. Taxes
» Tax rate of ~27%
~$50-75 Acq. Costs
» Interest Expense savings of ~$40M on an ~$100 Acq. Taxes annualized basis from refinancing of Rockwood
~$200 Acq. Costs
2020s $450—$550 FCF
» CAPEX in the
range of 4-6% of revenue plus LiOH $175—$225
plant
» One-time acquisition and
integration costs of $50—2015 Adjusted FCF 2016 FCF Outlook 3—5 Year Adjusted FCF
Outlook Outlook
$75M and one-time tax payment ~$50M in 2016
» No operating income from divested businesses; Working Capital Upside Opportunity to
Further Improve FCF
proceeds go to deleveraging 2
Net-Debt-to-Adj.
EBITDA
» Opportunity for working capital reduction
• Raised dividend by 5% in Q1 2015 – 21st straight dividend increase
» Expect similar increases until target reached
Non-GAAP measure. See Non-GAAP reconciliations in Appendix.
Net-Debt-to-Adjusted EBITDA ratio is based on the bank covenant definition. Bull Bear Target
13 ALBEMARLE
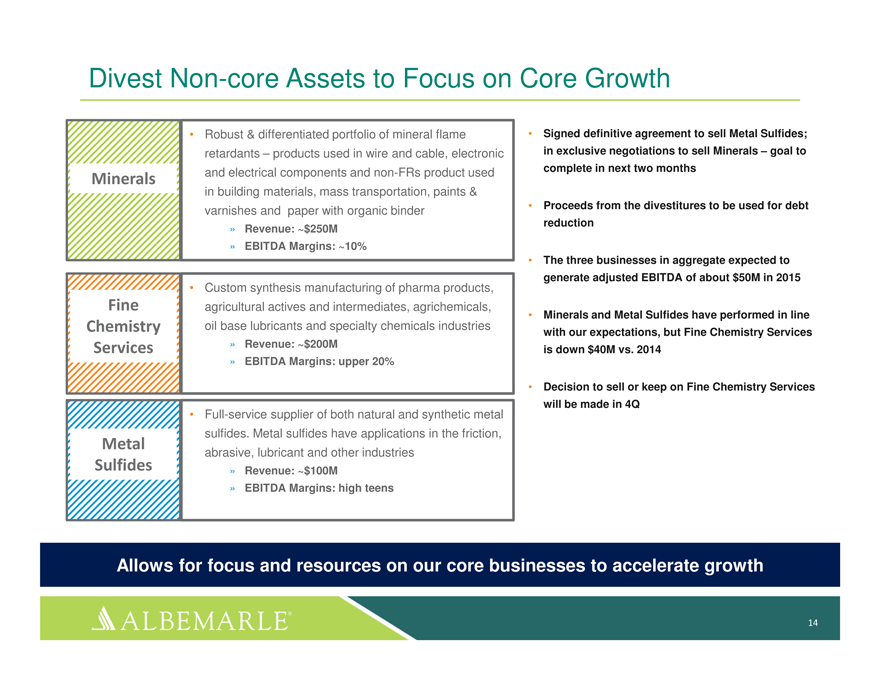
Divest Non-core Assets to Focus on Core Growth
• Robust & differentiated portfolio of mineral flame • Signed definitive agreement to sell Metal
Sulfides; retardants – products used in wire and cable, electronic in exclusive negotiations to sell Minerals – goal to and electrical components and non-FRs product used complete in next two months
Minerals
in building materials, mass transportation, paints &
• Proceeds from the divestitures to be used for debt varnishes and paper with organic binder reduction
»Revenue: ~$250M
»EBITDA Margins:
~10%
• The three businesses in aggregate expected to generate adjusted EBITDA of about $50M in 2015
Custom synthesis manufacturing of pharma products,
Fine agricultural actives and intermediates, agrichemicals, • Minerals and Metal Sulfides have performed in line
Chemistry oil base lubricants and specialty chemicals industries with our expectations, but Fine Chemistry Services Services »Revenue: ~$200M is down $40M vs. 2014
»EBITDA Margins: upper 20%
• Decision
to sell or keep on Fine Chemistry Services will be made in 4Q
Full-service supplier of both natural and
synthetic metal sulfides. Metal sulfides have applications in the friction,
Metal
abrasive, lubricant and other industries
Sulfides »Revenue: ~$100M
»EBITDA
Margins: high teens
Allows for focus and resources on our core businesses to accelerate growth
14 ALBEMARLE
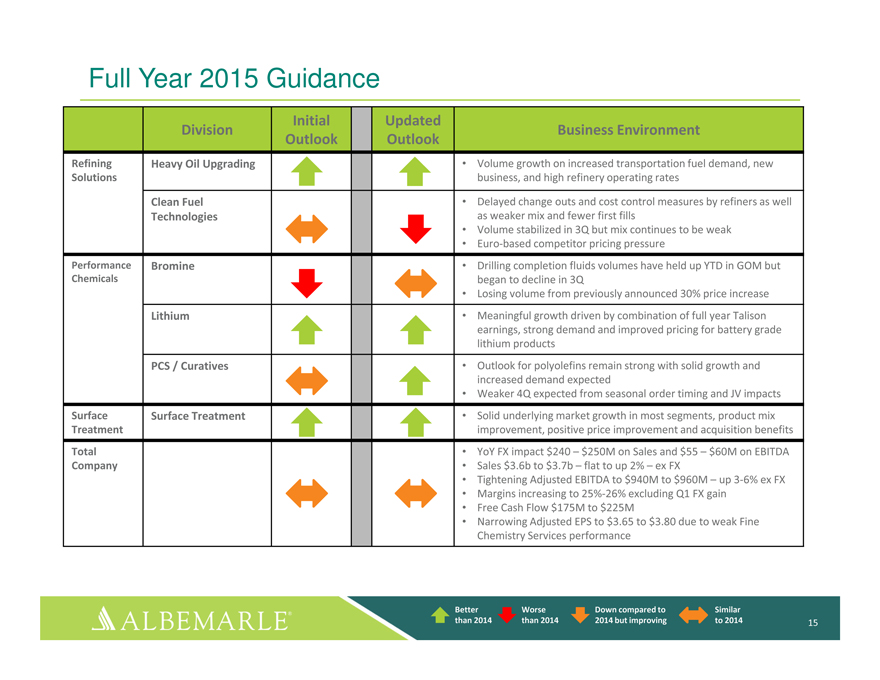
Full Year 2015 Guidance
Initial Updated
Division Business Environment Outlook Outlook
Refining Heavy Oil Upgrading • Volume growth on increased transportation fuel demand, new Solutions business, and
high refinery operating rates
Clean Fuel • Delayed change outs and cost control measures by refiners as
well Technologies as weaker mix and fewer first fills
| • |
|
Volume stabilized in 3Q but mix continues to be weak |
| • |
|
Euro-based competitor pricing pressure |
Performance Bromine • Drilling completion fluids volumes have held up YTD in GOM but Chemicals began to decline in 3Q
| • |
|
Losing volume from previously announced 30% price increase |
Lithium • Meaningful growth driven by combination of full year Talison earnings, strong demand and improved pricing
for battery grade lithium products
PCS / Curatives • Outlook for polyolefins remain strong with solid
growth and increased demand expected
| • |
|
Weaker 4Q expected from seasonal order timing and JV impacts |
Surface Surface Treatment • Solid underlying market growth in most segments, product mix Treatment improvement,
positive price improvement and acquisition benefits
Total • YoY FX impact $240 – $250M on Sales and
$55 – $60M on EBITDA Company • Sales $3.6b to $3.7b – flat to up 2% – ex FX
| • |
|
Tightening Adjusted EBITDA to $940M to $960M – up 3-6% ex FX |
| • |
|
Margins increasing to 25%-26% excluding Q1 FX gain |
| • |
|
Free Cash Flow $175M to $225M |
| • |
|
Narrowing Adjusted EPS to $3.65 to $3.80 due to weak Fine Chemistry Services performance
|
Better Worse Down compared to Similar than 2014 than 2014 2014 but improving to 2014 15
ALBEMARLE
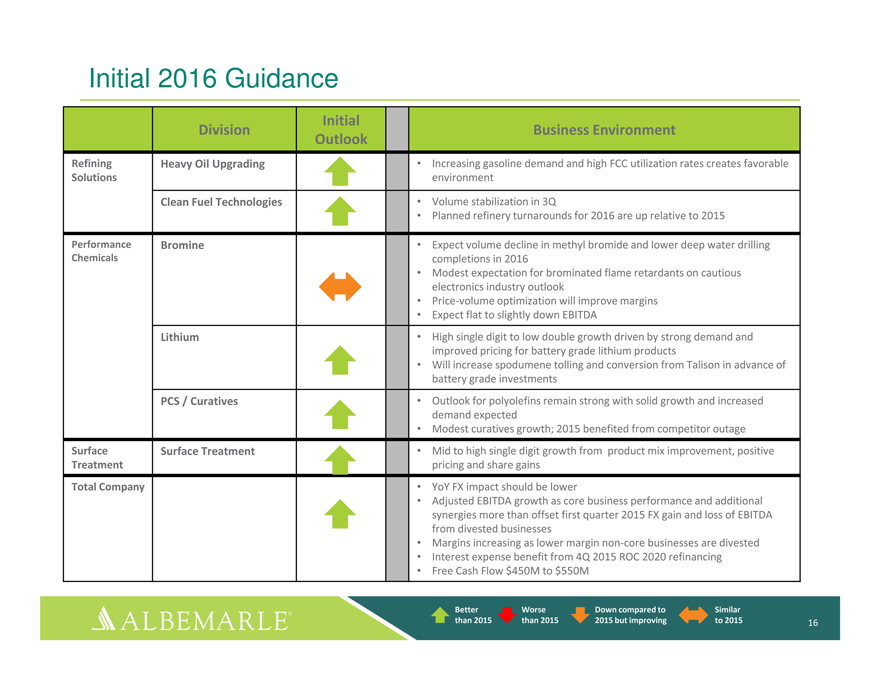
Initial 2016 Guidance
Initial
Division Business Environment Outlook
Refining Heavy Oil Upgrading • Increasing gasoline demand and high FCC utilization rates creates favorable Solutions environment
Clean Fuel Technologies • Volume stabilization in 3Q
| • |
|
Planned refinery turnarounds for 2016 are up relative to 2015 |
Performance Bromine • Expect volume decline in methyl bromide and lower deep water drilling Chemicals completions in
2016
| • |
|
Modest expectation for brominated flame retardants on cautious electronics industry outlook
|
| • |
|
Price-volume optimization will improve margins |
| • |
|
Expect flat to slightly down EBITDA |
Lithium • High single digit to low double growth driven by strong demand and improved pricing for battery grade
lithium products
| • |
|
Will increase spodumene tolling and conversion from Talison in advance of battery grade investments
|
PCS / Curatives • Outlook for polyolefins remain strong with solid growth and increased
demand expected
| • |
|
Modest curatives growth; 2015 benefited from competitor outage |
Surface Surface Treatment • Mid to high single digit growth from product mix improvement, positive Treatment pricing
and share gains
Total Company • YoY FX impact should be lower
| • |
|
Adjusted EBITDA growth as core business performance and additional synergies more than offset first quarter
2015 FX gain and loss of EBITDA from divested businesses |
| • |
|
Margins increasing as lower margin non-core businesses are divested |
| • |
|
Interest expense benefit from 4Q 2015 ROC 2020 refinancing |
| • |
|
Free Cash Flow $450M to $550M |
Better Worse Down compared to Similar than 2015 than 2015 2015 but improving to 2015 16 ALBEMARLE

www.albemarle.com
ALB LISTED NYSE
17 ALBEMARLE
Non-GAAP Financial Measures
It should be noted
that adjusted net income attributable to Albemarle Corporation (“adjusted earnings”), adjusted diluted earnings per share, adjusted effective income tax rates, segment operating profit, segment income, EBITDA, adjusted EBITDA, adjusted
EBITDA by operating segment, EBITDA margin and adjusted EBITDA margin are financial measures that are not required by, or presented in accordance with, accounting principles generally accepted in the United States, or GAAP. These measures are
presented here to provide additional useful measurements to review our operations, provide transparency to investors and enable period-to-period comparability of financial performance.
A description of these and other non-GAAP financial measures that we use to evaluate our operations and financial
performance, and reconciliation of these non-GAAP financial measures to the most directly comparable financial measures calculated and reported in accordance with GAAP, can be found herein.
18 ALBEMARLE
APPENDIX
Non-GAAP Reconciliations
19 ALBEMARLE
Net Income and EBITDA
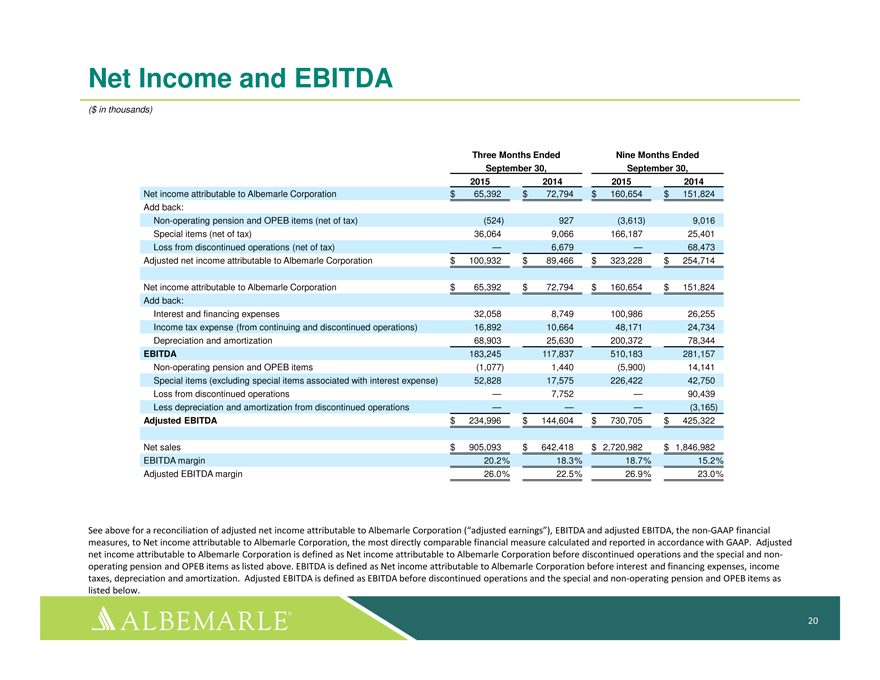
($ in thousands)
Three Months Ended Nine Months Ended September 30, September 30, 2015 2014 2015 2014
Net income attributable to Albemarle Corporation $ 65,392 $ 72,794 $ 160,654 $ 151,824 Add back: Non-operating
pension and OPEB items (net of tax) (524) 927 (3,613) 9,016 Special items (net of tax) 36,064 9,066 166,187 25,401 Loss from discontinued operations (net of tax) — 6,679 — 68,473 Adjusted net income attributable to Albemarle
Corporation $ 100,932 $ 89,466 $ 323,228 $ 254,714
Net income attributable to Albemarle Corporation $ 65,392 $
72,794 $ 160,654 $ 151,824 Add back: Interest and financing expenses 32,058 8,749 100,986 26,255 Income tax expense (from continuing and discontinued operations) 16,892 10,664 48,171 24,734 Depreciation and amortization 68,903 25,630 200,372 78,344
EBITDA 183,245 117,837 510,183 281,157 Non-operating pension and OPEB items (1,077) 1,440 (5,900) 14,141 Special items (excluding special items associated with interest expense) 52,828 17,575 226,422 42,750 Loss from discontinued
operations — 7,752 — 90,439 Less depreciation and amortization from discontinued operations — — — (3,165) Adjusted EBITDA $ 234,996 $ 144,604 $ 730,705 $ 425,322
Net sales $ 905,093 $ 642,418 $ 2,720,982 $ 1,846,982 EBITDA margin 20.2% 18.3% 18.7% 15.2% Adjusted EBITDA margin 26.0%
22.5% 26.9% 23.0%
See above for a reconciliation of adjusted net income attributable to Albemarle Corporation
(“adjusted earnings”), EBITDA and adjusted EBITDA, the non-GAAP financial measures, to Net income attributable to Albemarle Corporation, the most directly comparable financial measure calculated and reported in accordance with GAAP.
Adjusted net income attributable to Albemarle Corporation is defined as Net income attributable to Albemarle Corporation before discontinued operations and the special and non-operating pension and OPEB items as listed above. EBITDA is defined as
Net income attributable to Albemarle Corporation before interest and financing expenses, income taxes, depreciation and amortization. Adjusted EBITDA is defined as EBITDA before discontinued operations and the special and non-operating pension and
OPEB items as listed below.
20 ALBEMARLE
EBITDA supplemental
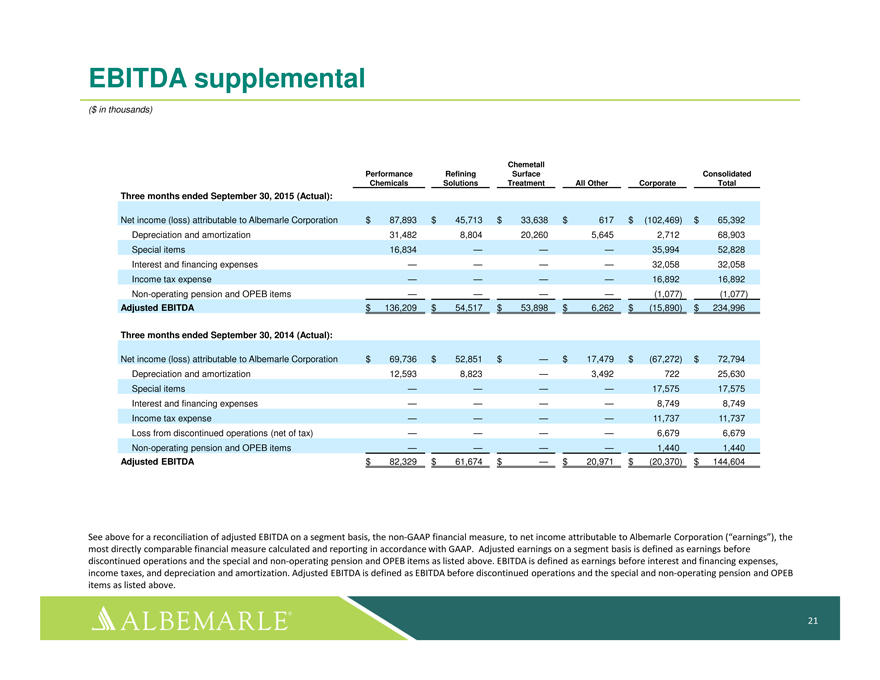
($ in thousands)
Chemetall
Performance Refining Surface Consolidated Chemicals Solutions Treatment All Other Corporate Total
Three months ended September 30, 2015 (Actual):
Net income (loss) attributable to Albemarle Corporation $ 87,893 $ 45,713 $ 33,638 $ 617 $ (102,469) $ 65,392 Depreciation and amortization 31,482 8,804 20,260 5,645 2,712 68,903
Special items 16,834 — — — 35,994 52,828 Interest and financing expenses — — — — 32,058 32,058 Income tax expense — — — — 16,892 16,892 Non-operating pension and OPEB items — — —
— (1,077) (1,077) Adjusted EBITDA $ 136,209 $ 54,517 $ 53,898 $ 6,262 $ (15,890) $ 234,996
Three months ended September 30, 2014 (Actual):
Net income (loss) attributable to Albemarle Corporation $ 69,736 $ 52,851 $ — $ 17,479 $ (67,272) $ 72,794
Depreciation and amortization 12,593 8,823 — 3,492 722 25,630 Special items — — — — 17,575 17,575 Interest and financing expenses — — — — 8,749 8,749 Income tax expense — — — — 11,737
11,737 Loss from discontinued operations (net of tax) — — — — 6,679 6,679 Non-operating pension and OPEB items — — — — 1,440 1,440 Adjusted EBITDA $ 82,329 $ 61,674 $ — $ 20,971 $ (20,370) $ 144,604
See above for a reconciliation of adjusted EBITDA on a segment basis, the non-GAAP financial measure, to net
income attributable to Albemarle Corporation (“earnings”), the most directly comparable financial measure calculated and reporting in accordance with GAAP. Adjusted earnings on a segment basis is defined as earnings before discontinued
operations and the special and non-operating pension and OPEB items as listed above. EBITDA is defined as earnings before interest and financing expenses, income taxes, and depreciation and amortization. Adjusted EBITDA is defined as EBITDA before
discontinued operations and the special and non-operating pension and OPEB items as listed above.
21 ALBEMARLE

EBITDA supplemental
($ in thousands)
Chemetall
Performance Refining Surface Consolidated Chemicals Solutions Treatment All Other Corporate Total
Three months ended September 30, 2014 (Pro forma):
Net income (loss) attributable to Albemarle Corporation $ 104,553 $ 52,851 $ 43,557 $ 23,107 $ (65,466) $ 158,602 Depreciation and amortization 23,678 8,823 7,897 4,314 5,579 50,291
Special items — — — — (22,750) (22,750) Interest and financing expenses — — — — 22,249 22,249 Income tax expense — — — — 51,137 51,137 Loss from discontinued operations (net of
tax) — — — — (24,821) (24,821) Non-operating pension and OPEB items — — — — 1,495 1,495 Adjusted EBITDA $ 128,231 $ 61,674 $ 51,454 $ 27,421 $ (32,577) $ 236,203
See above for a reconciliation of adjusted EBITDA on a segment basis, the non-GAAP financial measure, to net income
attributable to Albemarle Corporation (“earnings”), the most directly comparable financial measure calculated and reporting in accordance with GAAP. Adjusted earnings on a segment basis is defined as earnings before discontinued operations
and the special and non-operating pension and OPEB items as listed above. EBITDA is defined as earnings before interest and financing expenses, income taxes, and depreciation and amortization. Adjusted EBITDA is defined as EBITDA before discontinued
operations and the special and non-operating pension and OPEB items as listed above.
22 ALBEMARLE
EBITDA supplemental
($ in thousands)
Chemetall
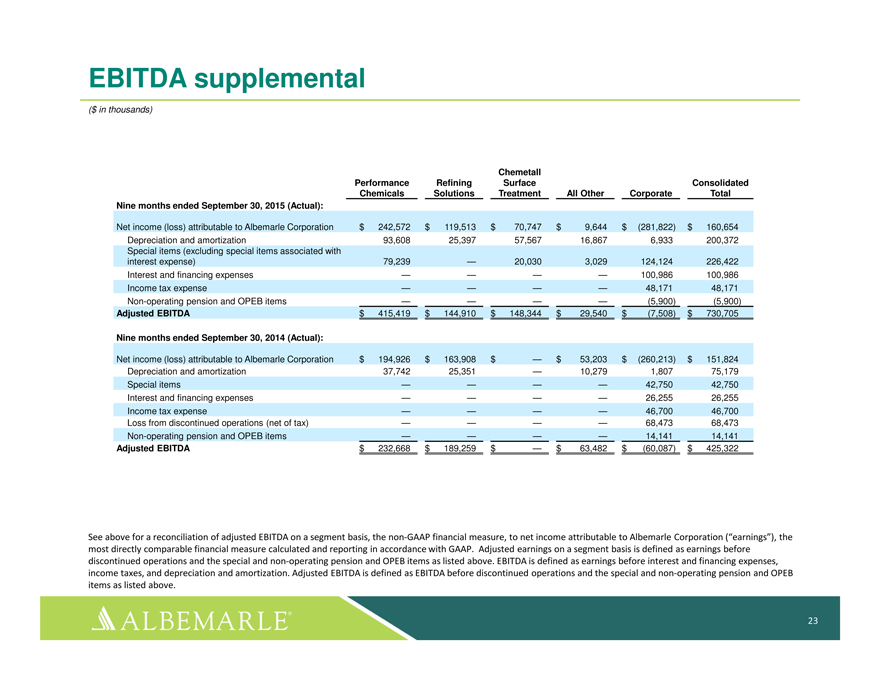
Performance Refining Surface Consolidated Chemicals Solutions Treatment All Other Corporate Total Nine months ended September 30, 2015 (Actual):
Net income (loss) attributable to Albemarle Corporation $ 242,572 $ 119,513 $ 70,747 $ 9,644 $ (281,822) $ 160,654
Depreciation and amortization 93,608 25,397 57,567 16,867 6,933 200,372 Special items (excluding special items associated with interest expense) 79,239 — 20,030 3,029 124,124 226,422 Interest and financing expenses — — — —
100,986 100,986 Income tax expense — — — — 48,171 48,171 Non-operating pension and OPEB items — — — — (5,900) (5,900) Adjusted EBITDA $ 415,419 $ 144,910 $ 148,344 $ 29,540 $ (7,508) $ 730,705
Nine months ended September 30, 2014 (Actual):
Net income (loss) attributable to Albemarle Corporation $ 194,926 $ 163,908 $ — $ 53,203 $ (260,213) $ 151,824
Depreciation and amortization 37,742 25,351 — 10,279 1,807 75,179 Special items — — — — 42,750 42,750 Interest and financing expenses — — — — 26,255 26,255 Income tax expense — — — —
46,700 46,700 Loss from discontinued operations (net of tax) — — — — 68,473 68,473 Non-operating pension and OPEB items — — — — 14,141 14,141 Adjusted EBITDA $ 232,668 $ 189,259 $ — $ 63,482 $
(60,087) $ 425,322
See above for a reconciliation of adjusted EBITDA on a segment basis, the non-GAAP
financial measure, to net income attributable to Albemarle Corporation (“earnings”), the most directly comparable financial measure calculated and reporting in accordance with GAAP. Adjusted earnings on a segment basis is defined as
earnings before discontinued operations and the special and non-operating pension and OPEB items as listed above. EBITDA is defined as earnings before interest and financing expenses, income taxes, and depreciation and amortization. Adjusted EBITDA
is defined as EBITDA before discontinued operations and the special and non-operating pension and OPEB items as listed above.
23 ALBEMARLE
EBITDA supplemental
($ in thousands)
Chemetall
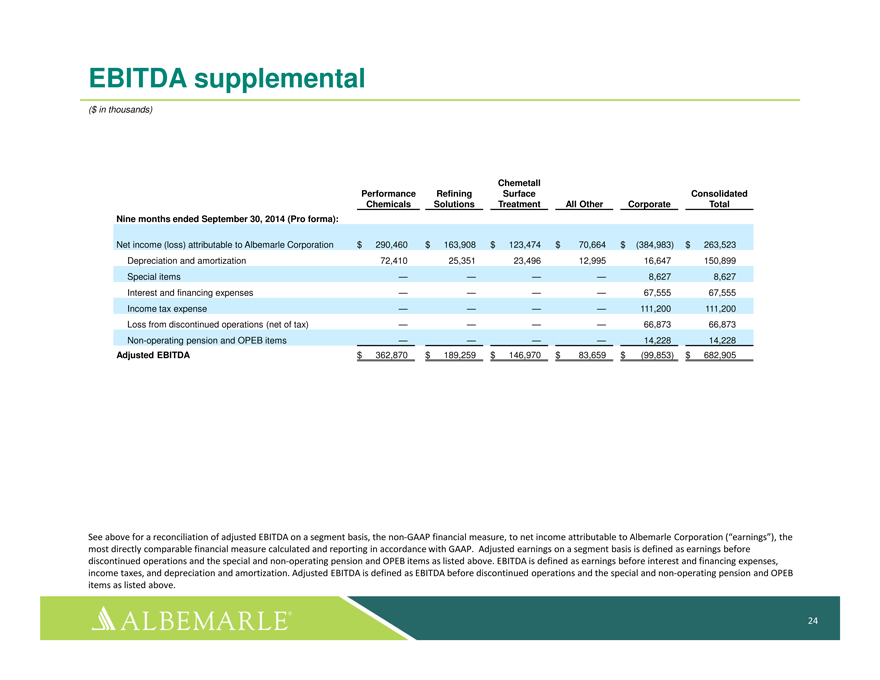
Performance Refining Surface Consolidated Chemicals Solutions Treatment All Other Corporate Total Nine months ended September 30, 2014 (Pro forma):
Net income (loss) attributable to Albemarle Corporation $ 290,460 $ 163,908 $ 123,474 $ 70,664 $ (384,983) $ 263,523
Depreciation and amortization 72,410 25,351 23,496 12,995 16,647 150,899 Special items — — — — 8,627 8,627 Interest and financing expenses — — — — 67,555 67,555 Income tax expense — — — —
111,200 111,200 Loss from discontinued operations (net of tax) — — — — 66,873 66,873
Non-operating pension and OPEB items — — — — 14,228 14,228 Adjusted EBITDA $ 362,870 $ 189,259 $
146,970 $ 83,659 $ (99,853) $ 682,905
See above for a reconciliation of adjusted EBITDA on a segment
basis, the non-GAAP financial measure, to net income attributable to Albemarle Corporation (“earnings”), the most directly comparable financial measure calculated and reporting in accordance with GAAP. Adjusted earnings on a segment basis
is defined as earnings before discontinued operations and the special and non-operating pension and OPEB items as listed above. EBITDA is defined as earnings before interest and financing expenses, income taxes, and depreciation and amortization.
Adjusted EBITDA is defined as EBITDA before discontinued operations and the special and non-operating pension and OPEB items as listed above.
24 ALBEMARLE
EBITDA supplemental
($ in thousands)
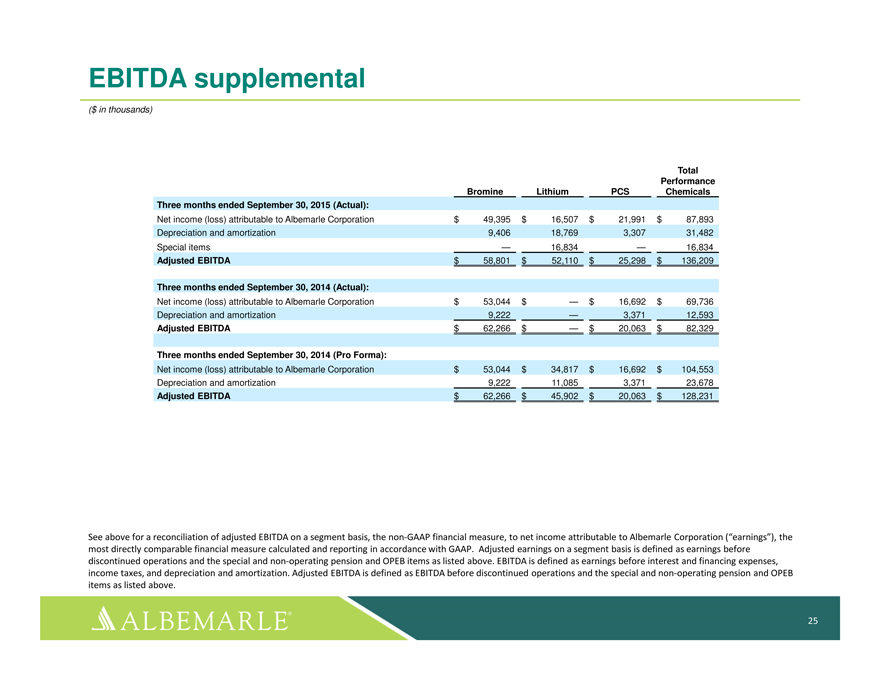
Total Performance Bromine Lithium PCS Chemicals Three months ended September 30, 2015 (Actual):
Net income (loss) attributable to Albemarle Corporation $ 49,395 $ 16,507 $ 21,991 $ 87,893 Depreciation and amortization
9,406 18,769 3,307 31,482 Special items — 16,834 — 16,834 Adjusted EBITDA $ 58,801 $ 52,110 $ 25,298 $ 136,209
Three months ended September 30, 2014 (Actual):
Net income (loss) attributable to Albemarle Corporation $ 53,044 $ — $ 16,692 $ 69,736 Depreciation and amortization 9,222 — 3,371 12,593 Adjusted EBITDA $ 62,266 $ — $
20,063 $ 82,329
Three months ended September 30, 2014 (Pro Forma):
Net income (loss) attributable to Albemarle Corporation $ 53,044 $ 34,817 $ 16,692 $ 104,553 Depreciation and amortization
9,222 11,085 3,371 23,678 Adjusted EBITDA $ 62,266 $ 45,902 $ 20,063 $ 128,231
See above for a reconciliation
of adjusted EBITDA on a segment basis, the non-GAAP financial measure, to net income attributable to Albemarle Corporation (“earnings”), the most directly comparable financial measure calculated and reporting in accordance with GAAP.
Adjusted earnings on a segment basis is defined as earnings before discontinued operations and the special and non-operating pension and OPEB items as listed above. EBITDA is defined as earnings before interest and financing expenses, income taxes,
and depreciation and amortization. Adjusted EBITDA is defined as EBITDA before discontinued operations and the special and non-operating pension and OPEB items as listed above.
25 ALBEMARLE
EBITDA supplemental
($ in thousands)
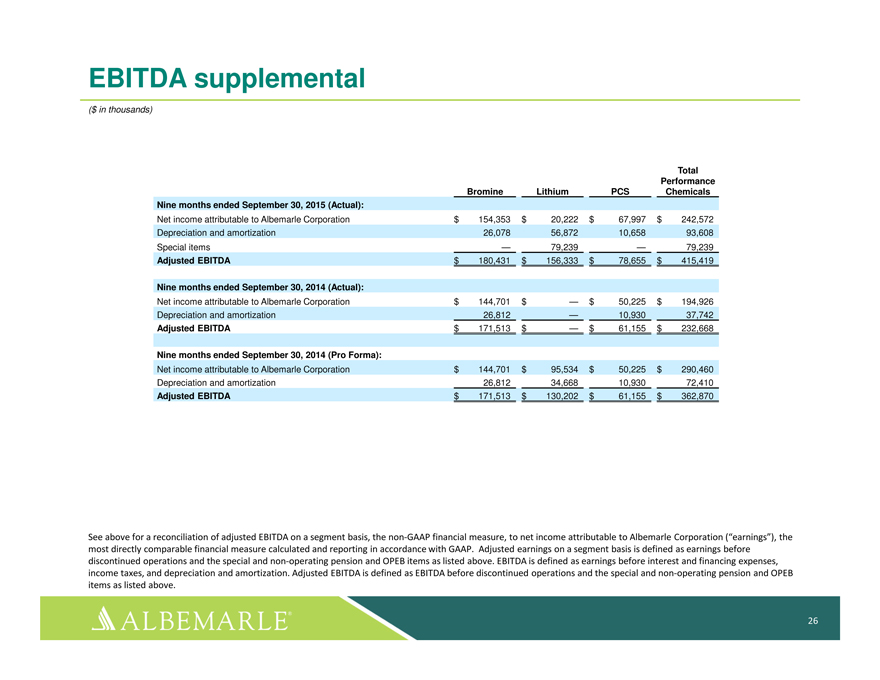
Total Performance Bromine Lithium PCS Chemicals Nine months ended September 30, 2015 (Actual):
Net income attributable to Albemarle Corporation $ 154,353 $ 20,222 $ 67,997 $ 242,572 Depreciation and amortization
26,078 56,872 10,658 93,608 Special items — 79,239 — 79,239 Adjusted EBITDA $ 180,431 $ 156,333 $ 78,655 $ 415,419
Nine months ended September 30, 2014 (Actual):
Net income attributable to Albemarle Corporation $ 144,701 $ — $ 50,225 $ 194,926 Depreciation and amortization
26,812 — 10,930 37,742 Adjusted EBITDA $ 171,513 $ — $ 61,155 $ 232,668
Nine months ended
September 30, 2014 (Pro Forma):
Net income attributable to Albemarle Corporation $ 144,701 $ 95,534 $
50,225 $ 290,460 Depreciation and amortization 26,812 34,668 10,930 72,410 Adjusted EBITDA $ 171,513 $ 130,202 $ 61,155 $ 362,870
See above for a reconciliation of adjusted EBITDA on a segment basis, the non-GAAP financial measure, to net income attributable to Albemarle Corporation (“earnings”), the most
directly comparable financial measure calculated and reporting in accordance with GAAP. Adjusted earnings on a segment basis is defined as earnings before discontinued operations and the special and non-operating pension and OPEB items as listed
above. EBITDA is defined as earnings before interest and financing expenses, income taxes, and depreciation and amortization. Adjusted EBITDA is defined as EBITDA before discontinued operations and the special and non-operating pension and OPEB
items as listed above.
26 ALBEMARLE
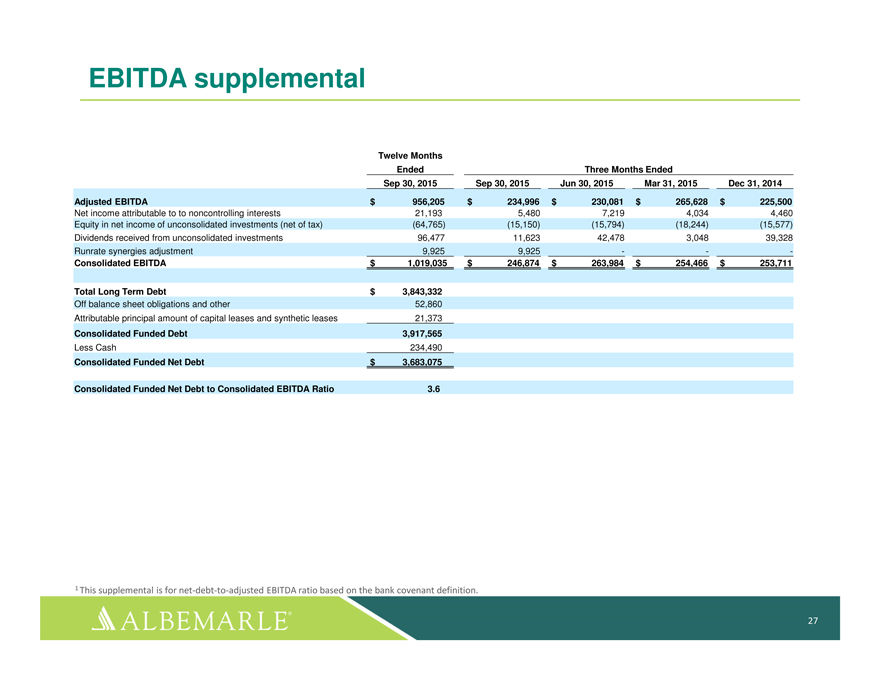
EBITDA supplemental
Twelve Months
Ended Three Months Ended
Sep 30, 2015 Sep 30, 2015 Jun 30, 2015 Mar 31, 2015 Dec 31, 2014
Adjusted EBITDA $ 956,205 $ 234,996 $ 230,081 $ 265,628 $ 225,500
Net income attributable to to noncontrolling interests 21,193 5,480 7,219 4,034 4,460 Equity in net income of unconsolidated investments (net of tax)
(64,765) (15,150) (15,794) (18,244) (15,577) Dividends received from unconsolidated investments 96,477 11,623 42,478 3,048 39,328 Runrate synergies adjustment 9,925 9,925 — -
Consolidated EBITDA $ 1,019,035 $ 246,874 $ 263,984 $ 254,466 $ 253,711
Total Long Term Debt $ 3,843,332
Off balance sheet obligations and other 52,860 Attributable principal amount of capital leases and synthetic leases 21,373
Consolidated Funded Debt 3,917,565
Less Cash 234,490
Consolidated Funded Net Debt $
3,683,075
Consolidated Funded Net Debt to Consolidated EBITDA Ratio 3.6
| 1 |
|
This supplemental is for net-debt-to-adjusted EBITDA ratio based on the bank covenant definition.
|
27 ALBEMARLE
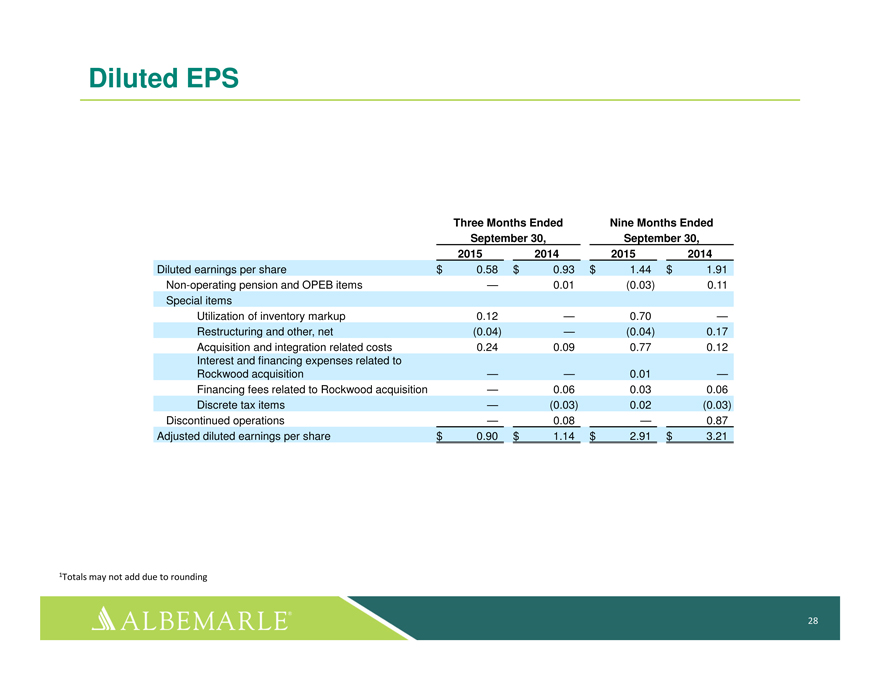
Diluted EPS
Three Months Ended Nine Months Ended
September 30, September 30, 2015 2014 2015 2014
Diluted earnings per share $ 0.58 $ 0.93 $ 1.44
$ 1.91 Non-operating pension and OPEB items — 0.01 (0.03) 0.11 Special items Utilization of inventory markup 0.12 — 0.70 — Restructuring and other, net (0.04) — (0.04) 0.17 Acquisition and integration related costs 0.24 0.09 0.77
0.12 Interest and financing expenses related to Rockwood acquisition — — 0.01 — Financing fees related to Rockwood acquisition — 0.06 0.03 0.06 Discrete tax items — (0.03) 0.02 (0.03) Discontinued operations — 0.08
— 0.87 Adjusted diluted earnings per share $ 0.90 $ 1.14 $ 2.91 $ 3.21
1Totals may not add due to
rounding
28 ALBEMARLE
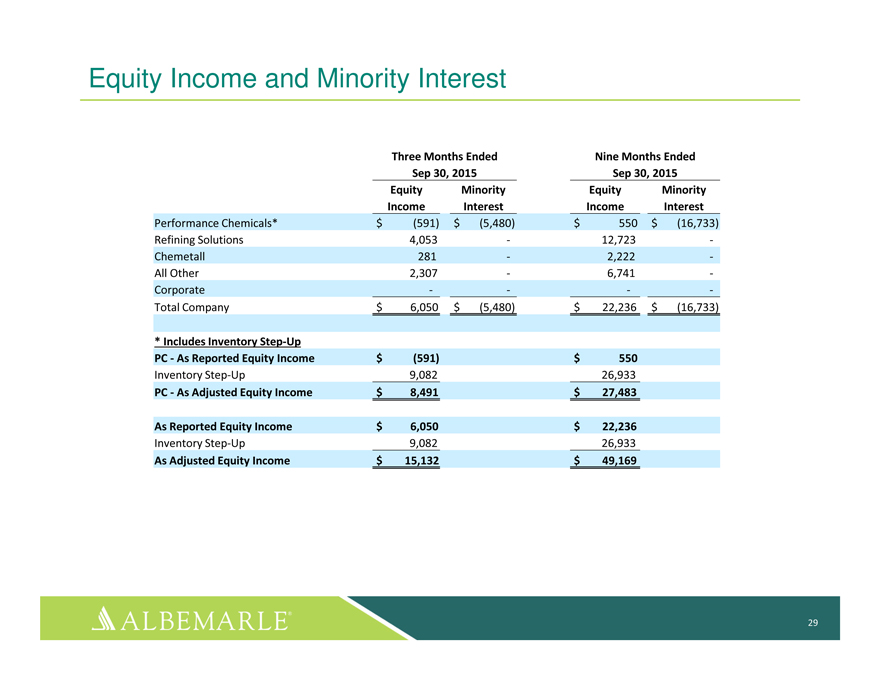
Equity Income and Minority Interest
Three Months
Ended Nine Months Ended Sep 30, 2015 Sep 30, 2015 Equity Minority Equity Minority Income Interest Income Interest
Performance Chemicals* $ (591) $ (5,480) $ 550 $ (16,733) Refining Solutions 4,053—12,723 -Chemetall 281—2,222 -All Other 2,307—6,741 -Corporate —
—Total Company $ 6,050 $ (5,480) $ 22,236 $ (16,733)
| * |
|
Includes Inventory Step-Up |
PC—As Reported Equity Income $ (591) $ 550
Inventory Step-Up 9,082 26,933
PC—As Adjusted Equity Income $ 8,491 $ 27,483
As Reported Equity Income $ 6,050 $ 22,236
Inventory Step-Up 9,082 26,933
As Adjusted Equity
Income $ 15,132 $ 49,169
29 ALBEMARLE

www.albemarle.com
albe LISTED NYSE ALBEMARLE
Albemarle (NYSE:ALB)
Historical Stock Chart
From Mar 2024 to Apr 2024

Albemarle (NYSE:ALB)
Historical Stock Chart
From Apr 2023 to Apr 2024
