Correction to AXA Earnings Story
August 04 2015 - 2:04AM
Dow Jones News
The company said its solvency ratio--a key measure of an
insurance company's financial strength--was 258% at the end of
June, down from 266% at the end of December. ("AXA 1H Net Pft
EUR3.08B Vs. Pft EUR3.01B," at 0516 GMT, misstated the time period
for the previous solvency ratio in the fifth paragraph.)
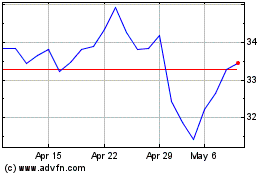
Axa (EU:CS)
Historical Stock Chart
From Mar 2024 to Apr 2024

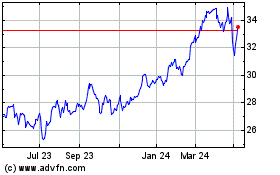
Axa (EU:CS)
Historical Stock Chart
From Apr 2023 to Apr 2024
